Annual Report 2009 - Evonik Industries AG
Annual Report 2009 - Evonik Industries AG
Annual Report 2009 - Evonik Industries AG

You also want an ePaper? Increase the reach of your titles
YUMPU automatically turns print PDFs into web optimized ePapers that Google loves.
<strong>Annual</strong> <strong>Report</strong> <strong>2009</strong><br />
A land of ideas<br />
Explore tomorrow’s solutions
Highlights<br />
Silicon production 18<br />
A joint venture with SolarWorld <strong>AG</strong> that uses up<br />
to 80 percent less energy to produce solar silicon.<br />
Lithium-ion batteries 20<br />
Huge batteries that store solar energy and<br />
release it when the sun is no longer shining.<br />
Solar tiles made of PLEXIGLAS� 22<br />
Roofing tiles for historic buildings that convert<br />
sunshine into power and heat extremely efficiently.<br />
Concentrated photovoltaics 24<br />
Micro-structured lenses made from PLEXIGLAS� that<br />
turn sunlight into solar power without CO2 emissions.<br />
Energy-efficient housing 26<br />
Climate-friendly homes that source all their energy<br />
requirements from solar power and geothermal energy.<br />
Key<br />
Highlights<br />
Start<br />
Management report<br />
Consolidated financial statements<br />
Supplementary information<br />
At a glance<br />
Background<br />
Potential<br />
Megatrend: resource efficiency<br />
Megatrend: health and nutrition<br />
Megatrend: globalization of<br />
technologies<br />
Technological benefits<br />
Economic benefits<br />
Ecological benefits
A clear structure<br />
Industrial<br />
Chemicals<br />
Inorganic<br />
Materials<br />
Business Areas<br />
<strong>Evonik</strong> <strong>Industries</strong><br />
Chemicals Energy Real Estate Business areas<br />
Consumer<br />
Specialties<br />
Health &<br />
Nutrition<br />
Coatings &<br />
Additives<br />
Performance<br />
Polymers<br />
Energy Real Estate Business units<br />
<strong>Evonik</strong> <strong>Industries</strong> will be focusing on specialty chemicals in the future—a field in which it ranks<br />
among the global leaders. The Energy and Real Estate Business Areas will operate as largely<br />
independent entities. The Executive Board’s new strategy for <strong>Evonik</strong> <strong>Industries</strong> <strong>AG</strong> was approved<br />
by the Supervisory Board on December 16, <strong>2009</strong>.<br />
Chemicals<br />
The Chemicals Business Area comes up with answers to economic megatrends and thus secures<br />
access to the high-growth markets of the future. We see especial opportunities in resource efficiency,<br />
health and nutrition, and the globalization of technologies. Market leadership already<br />
accounts for more than 80 percent of this business area’s sales. Our strengths are our balanced<br />
spectrum of activities and end-markets and close collaboration with customers. Market-focused<br />
research and development is a key driver of profitable growth: Products, processes and applications<br />
developed in the past five years account for around 20 percent of sales.<br />
Energy<br />
The core competencies of the Energy Business Area are planning, financing, building and operating<br />
highly efficient fossil-fueled power plants. As a grid-independent power generator, <strong>Evonik</strong> operates<br />
coal-fired power plants at eight locations in Germany, refinery power plants at two locations<br />
and a variety of facilities to generate energy from renewable resources. <strong>Evonik</strong>’s international<br />
successes comprise coal-fired power plants in Colombia, Turkey and the Philippines. Installed power<br />
totals around 9,400 Megawatts (MW) worldwide, including around 7,700 MW in Germany. In<br />
Germany we are positioned at the forefront of tomorrow’s market for renewable energies with<br />
activities in the areas of mine gas, biomass and geothermal energy.<br />
Real Estate<br />
The Real Estate Business Area manages a portfolio of around 60,000 company-owned residential<br />
units concentrated in the federal state of North Rhine-Westphalia (NRW) in Germany. It also has<br />
a 50 percent stake in THS, Essen (Germany), which owns more than 70,000 residential units. These<br />
are also located predominantly in NRW. <strong>Evonik</strong> is thus one of Germany’s leading privately owned<br />
residential real estate companies. Business focuses on letting homes to private households.
<strong>Evonik</strong> Group: Key figures<br />
in € million 2006 2007 2008 <strong>2009</strong><br />
Sales 14,125 14,444 15,873 13,076<br />
EBITDA1) 2,157 2,236 2,165 2,025<br />
EBITDA margin in % 15.3 15.5 13.6 15.5<br />
EBIT2) 1,179 1,363 1,298 1,194<br />
ROCE3) in % 8.4 9.7 9.0 8.4<br />
Net income 1,046 876 281 240<br />
Total assets as of December 31 20,953 19,800 20,115 18,907<br />
Equity ratio as of December 31 in % 20.6 25.7 25.6 27.6<br />
Cash flow from operating activities 1,142 1,215 388 2,092<br />
Capital expenditures4) 935 1,032 1,160 849<br />
Depreciation and amortization4) 943 862 842 798<br />
Net financial debt as of December 31 5,434 3,924 4,583 3,431<br />
Employees as of December 31 46,430 43,057 40,767 38,681<br />
Figures for 2008 restated; figures for 2006 and 2007 as reported.<br />
1) EBITDA = Earnings before interest, taxes, depreciation, amortization, write-downs and non-operating result.<br />
2) EBIT = Earnings before interest, taxes and non-operating result.<br />
3) Return on capital employed.<br />
4) Intangible assets, property, plant, equipment and investment property.<br />
Chemicals Business Area: Key figures<br />
in € million <strong>2009</strong> 2008<br />
External sales 9,978 11,762<br />
EBITDA 1,602 1,626<br />
EBIT 932 941<br />
Capital employed (annual average) 9,071 9,477<br />
ROCE in % 10.3 9.9<br />
EBITDA margin in % 16.1 13.8<br />
2008 figures restated.<br />
Energy Business Area: Key figures<br />
in € million <strong>2009</strong> 2008<br />
External sales 2,558 3,399<br />
EBITDA 418 517<br />
EBIT 326 415<br />
Capital employed (annual average) 3,355 3,152<br />
ROCE in % 9.7 13.2<br />
EBITDA margin in % 16.3 15.2<br />
2008 figures restated.<br />
Real Estate Business Area: Key figures<br />
in € million <strong>2009</strong> 2008<br />
External sales 378 375<br />
EBITDA 183 217<br />
EBIT 135 162<br />
Capital employed (annual average) 1,843 1,762<br />
ROCE in % 7.3 9.2<br />
EBITDA margin in % 48.4 57.9
◂ <strong>Evonik</strong> at a glance<br />
A land of ideas<br />
Explore tomorrow’s solutions<br />
Take a trip with <strong>Evonik</strong> <strong>Industries</strong> to the Land of Ideas—a world of pioneering products and<br />
solutions from our Chemicals, Energy and Real Estate Business Areas that showcase our<br />
position as a creative industrial group. Products and solutions that help achieve a healthier<br />
balance between the growing needs of the seven or eight billion people who will live on<br />
our planet in the near future.<br />
The sun is our guide through this annual report. It is the source of a vast array of new developments<br />
that help improve energy efficiency. Although fossil fuels will remain crucial in the<br />
coming decades, the sun has the potential to help us achieve a significant shift in our energy<br />
mix. After all, day by day it can provide the energy we humans need for the whole year.<br />
What’s more, that energy can be converted into power and heat with absolutely no carbon<br />
emissions.<br />
<strong>Evonik</strong> <strong>Industries</strong> has the capability to play a leading role in the growing area of resource<br />
efficiency—through its core competencies, targeted research and pioneering technologies.<br />
Backed up by a clear corporate strategy focused on the core specialty chemicals business and<br />
a precise vision of the future. That’s why we are resolutely exploiting the opportunities<br />
offered by three global megatrends: resource efficiency, health and nutrition and the globalization<br />
of technologies.<br />
Join us on a voyage of discovery.<br />
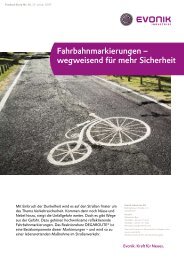
Design meets efficiency: This attractive solar facility in<br />
Barcelona uses resources efficiently
Tour of the<br />
annual report<br />
2<br />
Tour 1: Start<br />
4 Letter from the Chairman of the Executive Board<br />
10 Tour guide<br />
12 Roadmap<br />
18 Highlights<br />
Silicon production<br />
Solar tiles made of PLEXIGLAS�<br />
Energy-efficient housing<br />
70<br />
68<br />
<strong>Annual</strong> <strong>Report</strong> <strong>2009</strong> <strong>Evonik</strong> <strong>Industries</strong><br />
Lithium-ion batteries<br />
Concentrated photovoltaics<br />
60<br />
67<br />
71<br />
64<br />
41<br />
30<br />
45<br />
78 79<br />
75<br />
50<br />
40<br />
84<br />
44<br />
18<br />
12<br />
Tour 2: Management report<br />
30 Performance and business conditions<br />
40 Earnings position<br />
41 Financial condition<br />
44 Asset structure<br />
45 Research and development<br />
50 Performance of the business areas<br />
50 Chemicals Business Area<br />
60 Energy Business Area<br />
64 Real Estate Business Area<br />
67 Regional development<br />
68 Performance of <strong>Evonik</strong> <strong>Industries</strong> <strong>AG</strong><br />
70 Corporate responsibility<br />
71 Employees<br />
75 Environment, safety and health<br />
78 Corporate governance<br />
78 Events after the end of the reporting period<br />
79 Risk report<br />
84 Outlook<br />
10<br />
4<br />
◂ ◂ ◂ ◂ ◂ ◂ ◂ ◂ ◂ ◂ ◂ ◂ ◂ ◂ ◂ ◂ ◂ ◂ ◂ ◂ ◂ ◂ ◂ ◂ ◂ ◂ ◂ ◂ ◂ ◂ ◂ ◂ ◂ ◂ ◂ ◂ ◂ ◂ ◂ ◂◂ ◂ ◂ ◂ ◂ ◂ ◂ ◂ ◂ ◂ ◂ ◂ ◂ ◂ ◂ ◂ ◂ ◂ ◂◂ ◂ ◂ ◂ ◂ ◂ ◂ ◂ ◂ ◂ ◂ ◂ ◂ ◂ ◂ ◂ ◂ ◂ ◂ ◂ ◂ ◂ ◂ ◂ ◂ ◂ ◂ ◂ ◂ ◂ ◂ ◂ ◂ ◂ ◂ ◂ ◂ ◂ ◂ ◂
Start Management report Consolidated financial statements Supplementary information<br />
88<br />
89<br />
◂ ◂◂ ◂ ◂ ◂ ◂ ◂ ◂ ◂ ◂ ◂ ◂ ◂ ◂ ◂ ◂ ◂ ◂ ◂ ◂ ◂ ◂ ◂ ◂ ◂ ◂ ◂ ◂ ◂◂ ◂ ◂ ◂ ◂ ◂ ◂ ◂ ◂ ◂ ◂ ◂ ◂ ◂ ◂ ◂ ◂ ◂◂ ◂ ◂ ◂ ◂ ◂ ◂ ◂ ◂ ◂ ◂ ◂ ◂ ◂ ◂ ◂ ◂ ◂ ◂ ◂ ◂<br />
174<br />
90<br />
91 92<br />
94<br />
172<br />
170<br />
◂ ◂ ◂ ◂ ◂ ◂◂ ◂ ◂ ◂ ◂ ◂◂◂<br />
88 Income statement<br />
89 Statement of comprehensive income<br />
90 Balance sheet<br />
91 Statement of changes in equity<br />
92 Cash flow statement<br />
94 Notes<br />
Tour 3: Consolidated financial statements<br />
165<br />
◂ ◂ ◂ ◂ ◂ ◂ ◂ ◂<br />
168<br />
164<br />
Tour 4: Supplementary information<br />
164 Auditor’s report<br />
165 <strong>Report</strong> of the Supervisory Board<br />
168 Further information on corporate officers<br />
170 Major shareholdings<br />
172 Market positions<br />
174 Useful information for travelers<br />
7 pages<br />
<strong>Annual</strong> <strong>Report</strong> <strong>2009</strong> <strong>Evonik</strong> <strong>Industries</strong> 3
“We offer powerful ideas:<br />
sustainable solutions that exploit<br />
the power of sunlight.”<br />
Members of the Executive Board (from left):<br />
Ralf Blauth, Chief Human Resources Officer<br />
Dr. Wolfgang Colberg, Chief Financial Officer<br />
Dr. Klaus Engel, Chairman of the Executive Board of <strong>Evonik</strong> <strong>Industries</strong> <strong>AG</strong><br />
4<br />
<strong>Annual</strong> <strong>Report</strong> <strong>2009</strong> <strong>Evonik</strong> <strong>Industries</strong>
Start Management report Consolidated financial statements Supplementary information<br />
Letter from the Chairman of the Executive Board
6<br />
<strong>Annual</strong> <strong>Report</strong> <strong>2009</strong> <strong>Evonik</strong> <strong>Industries</strong>
Start Management report Consolidated financial statements Supplementary information<br />
Letter from the Chairman of the Executive Board
8<br />
<strong>Annual</strong> <strong>Report</strong> <strong>2009</strong> <strong>Evonik</strong> <strong>Industries</strong>
Start Management report Consolidated financial statements Supplementary information<br />
Letter from the Chairman of the Executive Board
Tour guide<br />
The sun—the source of a livable future.<br />
Age and origin<br />
The sun was formed around 4.6 billion years<br />
ago by the collapse of an interstellar gas cloud.<br />
As the matter solidified, it triggered a process<br />
of nuclear fusion, which releases incredible<br />
amounts of energy in the interior of the sun.<br />
In about 2 billion years time the average temperature<br />
on the sun’s surface will be over<br />
100 °C.<br />
And when it is roughly 12.5 billion years old,<br />
the sun will cool and disintegrate to form a<br />
white dwarf.<br />
10<br />
Climate data<br />
Average temperature in the sun’s core approx. 15,000,000 °C<br />
Average temperature in the photosphere 5,500–6,100 °C<br />
Precipitation in % 0.00<br />
<strong>Annual</strong> <strong>Report</strong> <strong>2009</strong> <strong>Evonik</strong> <strong>Industries</strong>
Start Management report Consolidated financial statements Supplementary information<br />
Tour guide<br />
Structure and mass<br />
The sun is made up of layers comprising the<br />
core, radiative zone, convective zone,<br />
photosphere, chromosphere and corona.<br />
The core accounts for just 1.6 percent of the<br />
sun’s total volume but 50 percent of its mass.<br />
Every second 564 million metric tons of hydrogen<br />
are fused to form helium in the sun’s core<br />
at a pressure of over 100 million bar.<br />
Overall, the sun’s mass is 1.989 x 1030 kg. That<br />
makes it 332,946 times heavier than the Earth,<br />
while its mass is 1,000 times greater than all<br />
other planets in the solar system taken together.<br />
Key data<br />
99.98<br />
170,000<br />
1,390,000<br />
150,000,000<br />
percent of the Earth’s energy comes<br />
from the sun.<br />
terawatts (= 170 trillion watts) of radiation<br />
are transmitted to the Earth every day.<br />
kilometers in diameter; that is 109 times<br />
the Earth’s diameter.<br />
kilometers—the mean distance between<br />
the sun and the Earth.<br />
<strong>Annual</strong> <strong>Report</strong> <strong>2009</strong> <strong>Evonik</strong> <strong>Industries</strong> 11
We are almost unrivaled in specialty<br />
chemicals. Surely that means we should<br />
use our strengths as a springboard for<br />
sustainable growth?<br />
12<br />
<strong>Annual</strong> <strong>Report</strong> <strong>2009</strong> <strong>Evonik</strong> <strong>Industries</strong>
Start Management report Consolidated financial statements Supplementary information<br />
Roadmap<br />
Strategy<br />
The roadmap to position <strong>Evonik</strong> as a leader in specialty chemicals<br />
with a strong foothold in other areas.<br />
Chemicals defined as <strong>Evonik</strong>’s core<br />
business<br />
<strong>Evonik</strong> <strong>Industries</strong> acted rapidly to counter the<br />
global economic crisis and lay the foundations<br />
for the post-crisis era. To make optimum use<br />
of the available growth opportunities, we<br />
are bundling our strengths and focusing on<br />
our biggest area of competency: specialty<br />
chemicals. In short, we are driving forward<br />
the development of <strong>Evonik</strong> <strong>Industries</strong> from<br />
a conglomerate to a leading global specialty<br />
chemicals corporation.<br />
In effect, we are aligning our portfolio<br />
principally to the strengths of our company<br />
and the three most significant global megatrends:<br />
resource efficiency, health and nutrition<br />
and the globalization of technologies.<br />
<strong>Evonik</strong> already ranks at the forefront of many<br />
of these markets and has a promising position<br />
in key technologies. Businesses that no longer<br />
fit in with our strategy or cannot meet our<br />
return requirements will be divested to optimize<br />
value.<br />
Opportunities for strong corporate<br />
entities<br />
In future, the Energy and Real Estate Business<br />
Areas will basically operate as independent<br />
business entities so that their growth and<br />
value creation potential can be leveraged<br />
even more effectively.<br />
Partners for the energy business: Our<br />
aim is to take on board one or more partners<br />
for our energy operations or for specific<br />
projects in this business area, while retaining<br />
it within the <strong>Evonik</strong> Group. Together,<br />
we should be able to tackle growth projects<br />
that have already been identified more<br />
quickly. As well as extending our activities<br />
in the field of regenerative energies, we want<br />
to take up international opportunities to build<br />
and operate power plants.<br />
Real estate on track for growth: We aim to<br />
utilize the attractive prospects for the Real<br />
Estate Business Area by combining <strong>Evonik</strong><br />
Immobilien GmbH and THS GmbH to form<br />
a new entity. This will create Germany’s<br />
third-largest residential real estate company<br />
with business totaling some €800 million and<br />
around 130,000 residential units. Ultimately,<br />
we aim to open up prospects to position this<br />
new real estate entity as an independent<br />
capital market player.<br />
Headed for the capital markets<br />
Our new corporate strategy has not altered<br />
our declared objective of making <strong>Evonik</strong><br />
more attractive for the capital markets. We<br />
regard that as essential to if we are to systematically<br />
exploit opportunities for sustainable<br />
growth.<br />
At a glance<br />
New strategy<br />
Driving forward the development of<br />
<strong>Evonik</strong> from a conglomerate to a global<br />
leader in specialty chemicals with a<br />
clearly focused portfolio<br />
Strong corporate entities<br />
Running the Energy and Real Estate<br />
Business Areas as largely independent<br />
entities<br />
Good prospects<br />
Aligning <strong>Evonik</strong> to the most significant<br />
global megatrends: resource efficiency,<br />
health and nutrition, and globalization<br />
of technologies<br />
<strong>Annual</strong> <strong>Report</strong> <strong>2009</strong> <strong>Evonik</strong> <strong>Industries</strong> 13
We are focused. But is it possible<br />
to keep a clear goal in sight while<br />
concentrating on three distinctive<br />
trends?<br />
14<br />
<strong>Annual</strong> <strong>Report</strong> <strong>2009</strong> <strong>Evonik</strong> <strong>Industries</strong>
Start Management report Consolidated financial statements Supplementary information<br />
Roadmap<br />
Megatrends<br />
How our activities can be good for people, the environment<br />
and our financial performance.<br />
Background<br />
For <strong>Evonik</strong>, megatrends are not simply<br />
overarching social trends that exert enormous<br />
pressure for change. They also offer<br />
above-average growth potential for the<br />
<strong>Evonik</strong> Group—because we have the creativity<br />
to produce pioneering products and<br />
solutions that enable us to reap the associated<br />
business benefits.<br />
Resource efficiency<br />
Vital resources such as fossil fuels, drinking<br />
water, timber and metals are not endless,<br />
yet demand for them is rising. <strong>Evonik</strong> offers<br />
the world commercially viable ideas on how<br />
to utilize resources more efficiently—ranging<br />
from products to generate and store solar<br />
power and other renewable resources,<br />
through solutions for electric vehicles that<br />
enhance mobility, and high-performance<br />
plastics and lubricant systems with a long<br />
service life, which reduce raw material<br />
requirements, to catalysts and additives for<br />
the production of environment-friendly<br />
products and starting materials.<br />
Resource efficiency: A sustainable balance<br />
between growth and protecting the basis of life<br />
is vital<br />
Health and nutrition<br />
Life expectancy in the industrialized countries<br />
and emerging markets is increasing as<br />
rapidly as the world’s population. That will<br />
raise living standards for a growing proportion<br />
of people, leading to a steady rise in<br />
demand for food and for products that<br />
enhance health and wellbeing. <strong>Evonik</strong>’s<br />
response includes feed additives and intermediates<br />
for the pharmaceuticals and cosmetics<br />
industries.<br />
Globalization of technologies<br />
New economic centers are emerging alongside<br />
the more highly developed markets,<br />
especially in the Asian growth regions. As<br />
prosperity and needs in these regions move<br />
into line with those in the western world,<br />
demand for the corresponding technologies<br />
is growing. <strong>Evonik</strong> is ready—with a wide<br />
range of silicon products to harness solar<br />
energy, methacrylate-based products and<br />
hydrogen peroxide, an environment-friendly<br />
bleaching agent for the paper industry, as<br />
well as the associated distribution structures.<br />
Health and nutrition: Population growth and<br />
aging are increasing demand for food, pharmaceuticals<br />
and personal care products<br />
Globalization of technologies: Key<br />
technologies are needed to support<br />
the development of new business<br />
centers<br />
<strong>Annual</strong> <strong>Report</strong> <strong>2009</strong> <strong>Evonik</strong> <strong>Industries</strong> 15
The world is changing dramatically.<br />
Surely that suggests we should<br />
focus on our strengths and endeavor<br />
to maximize our performance?<br />
16<br />
<strong>Annual</strong> <strong>Report</strong> <strong>2009</strong> <strong>Evonik</strong> <strong>Industries</strong>
Start Management report Consolidated financial statements Supplementary information<br />
Roadmap<br />
Core competencies<br />
<strong>Evonik</strong>’s positioning as a creative industrial group is<br />
an excellent basis for shaping the future.<br />
Background<br />
The power of the <strong>Evonik</strong> brand results from<br />
the specific abilities and characteristics that<br />
make up our core competencies. The heart<br />
of the <strong>Evonik</strong> brand is creativity. That is the<br />
basis for our business success and enables us<br />
to translate ideas into enterprising products<br />
and solutions that create new markets or<br />
place us at the forefront of established markets.<br />
We have the courage and imagination<br />
to move away from trodden paths in order<br />
to solve problems for our customers.<br />
Our specialization—concentrating on<br />
what we do particularly well—makes us<br />
clear experts. <strong>Evonik</strong> offers premium quality<br />
and cutting-edge expertise. And positions<br />
itself as the market, quality or technology<br />
leader.<br />
Our capacity for self-renewal enables us<br />
to constantly review business models, products<br />
and structures and adapt resolutely to<br />
changes to ensure we remain successful in<br />
tomorrow’s world. Self-renewal is a business<br />
principle at <strong>Evonik</strong> and our source of<br />
ideas, flexibility and motivation.<br />
Nevertheless, one thing remains constant in<br />
the face of change: our reliability. Fair, reliable<br />
and respectful collaboration characterizes<br />
our conduct towards each other and<br />
towards our customers and suppliers. From<br />
the learning process enshrined in responsible<br />
action and openness, a special corporate<br />
culture has grown up over the decades. That<br />
is reflected in our long-term business relationships.<br />
At a glance<br />
Creativity<br />
We use our creativity to come up with<br />
innovative ideas that create new markets<br />
Specialization<br />
Our clear specialization gives us an<br />
edge over our competitors<br />
Self-renewal<br />
Through continual self-renewal we<br />
are helping shape the future<br />
Reliability<br />
Our reliability marks us out as a<br />
preferred partner<br />
<strong>Annual</strong> <strong>Report</strong> <strong>2009</strong> <strong>Evonik</strong> <strong>Industries</strong> 17
Solar cells have one drawback:<br />
their energy profile. Wouldn’t it be<br />
wonderful if we could improve that?<br />
18<br />
<strong>Annual</strong> <strong>Report</strong> <strong>2009</strong> <strong>Evonik</strong> <strong>Industries</strong>
Start Management report Consolidated financial statements Supplementary information<br />
Highlights<br />
Energy-saving silicon production<br />
Discover a new method of producing solar silicon that uses<br />
80 percent less energy.<br />
Background<br />
JSSi GmbH (Joint Solar Silicon) in Rheinfelden<br />
(Germany), a joint venture of <strong>Evonik</strong><br />
and SolarWorld <strong>AG</strong>, produces solar silicon<br />
using a new process which needs far less<br />
energy. The trailblazing idea: Unlike the<br />
conventional production method, a multistep<br />
process is used to convert raw silicon<br />
into gaseous monosilane, from which ultrapure<br />
silicon is obtained by thermal decomposition.<br />
This process also generates two<br />
impressive figures: Energy requirements are<br />
reduced by up to 80 percent, and the silicon<br />
has 99.99 percent purity, making it suitable<br />
for top-performing solar modules.<br />
Potential<br />
The massive energy savings result in far more<br />
attractive production costs for expensive<br />
solar silicon. The new process therefore<br />
makes solar power cheaper and more competitive.<br />
As a producer of polycrystalline solar<br />
silicon, <strong>Evonik</strong> now has a foothold in all<br />
silicon-based photovoltaic technologies, as<br />
well as silicon tetrachloride, monosilanes,<br />
dichlorosilanes and trichlorosilanes and can<br />
offer customers a broad portfolio of silicon<br />
chemicals.<br />
At a glance<br />
Technological benefits<br />
A new production process that<br />
saves up to 80 percent energy<br />
Economic benefits<br />
Cost-saving production lowers<br />
unit costs, making solar modules<br />
more competitive<br />
Ecological benefits<br />
Energy savings reduce resource<br />
requirements and cut CO2 emissions<br />
Assembling solar modules manufactured using high-quality startting<br />
products from <strong>Evonik</strong><br />
<strong>Annual</strong> <strong>Report</strong> <strong>2009</strong> <strong>Evonik</strong> <strong>Industries</strong> 19
City lights are fascinating. Yet they waste<br />
vast amounts of energy. Wouldn’t it be<br />
wonderful if we could use solar energy<br />
to illuminate our cities at night?<br />
20<br />
<strong>Annual</strong> <strong>Report</strong> <strong>2009</strong> <strong>Evonik</strong> <strong>Industries</strong>
Start Management report Consolidated financial statements Supplementary information<br />
Highlights<br />
XXL lithium-ion batteries<br />
Discover a technology that stores solar power and releases it when<br />
the sun is no longer shining.<br />
Background<br />
<strong>Evonik</strong> has opened up new dimensions for<br />
its patented SEPARION� technology that go<br />
beyond electric vehicles: LESSY (lithium<br />
electricity storage systems) are large-scale<br />
batteries that store solar power and release<br />
it when the sun is no longer available to<br />
generate electricity. For example, at night<br />
or in bad weather.<br />
The advantages of lithium-ion batteries<br />
compared with other storage systems include<br />
extremely high efficiency of around 96 percent<br />
and the ability to store and release<br />
energy very fast. <strong>Evonik</strong> uses SEPARION�<br />
for these massive batteries. These membranes<br />
bring a four-to-fivefold increase in<br />
the heat resistance of the battery separators,<br />
making them very safe. 4,700 battery cells<br />
are used in this project, which is part of the<br />
Eco2 Science-to-Business Center run by<br />
Creavis Technologies & Innovation and<br />
receives funding from the German Ministry<br />
of Education and Research.<br />
Potential<br />
LESSY is currently a prototype at the test<br />
phase. However, its scalability indicates<br />
enormous potential for the future. This technology<br />
could be used for a wide variety of<br />
applications, ranging from small-scale storage<br />
systems for decentralized power supply, for<br />
example, for solar power for private households,<br />
to massive systems for industrially<br />
generated power.<br />
Another field that offers good prospects<br />
is the reserve power load required by German<br />
utilities to stabilize power supply in the grid.<br />
So far, this has mainly been assured by conventional<br />
procedures such as storage pumps<br />
or steam generators. However, these traditional<br />
systems are far slower than LESSY.<br />
At a glance<br />
Technological benefits<br />
Storage of power generated<br />
from renewable resources<br />
Economic benefits<br />
Future technology in which<br />
<strong>Evonik</strong> can utilize its leadingedge<br />
knowledge of lithium-ion<br />
batteries<br />
Ecological benefits<br />
Reducing the drawbacks of<br />
widely available regenerative<br />
energies and opening up new<br />
prospects of cutting CO2 emissions<br />
Technical representation of the<br />
lithium electricity storage system<br />
at Fenne power plant in Germany<br />
<strong>Annual</strong> <strong>Report</strong> <strong>2009</strong> <strong>Evonik</strong> <strong>Industries</strong> 21
Historic buildings are often monuments<br />
to extravagance. Wouldn’t it<br />
be wonderful if we could combine<br />
conservation with climate protection?<br />
22<br />
<strong>Annual</strong> <strong>Report</strong> <strong>2009</strong> <strong>Evonik</strong> <strong>Industries</strong>
Start Management report Consolidated financial statements Supplementary information<br />
Highlights<br />
Solar tiles made of PLEXIGLAS®<br />
Discover look-alike roof tiles that efficiently turn sunlight into power and heat.<br />
Background<br />
A bright idea is the key to harnessing solar<br />
power in historic buildings: Solar tiles may<br />
look like the clay tiles traditionally used on<br />
medieval buildings but that’s where the<br />
similarity ends. In fact, they are modern<br />
plastic tiles incorporating solar modules<br />
that capture sunlight and turn it into heat or<br />
electricity.<br />
PLEXIGLAS� plays a key role in this. The<br />
solar modules are camouflaged by an acrylic<br />
sheet that has to meet special requirements:<br />
Alongside high light transmittance and<br />
resistance to UV, it needs to be robust and<br />
impact-resistant. That makes PLEXIGLAS�<br />
an essential ingredient.<br />
Potential<br />
The sun is becoming an increasingly important<br />
source of energy. Moreover, more and<br />
more demanding standards are being set for<br />
the energy efficiency of buildings in Europe,<br />
and there is an enormous need to restore<br />
and modernize listed buildings. That’s why<br />
Italy—with its combination of sun and countless<br />
historic buildings—is ideal for growing<br />
use of solar tiles that can be used to generate<br />
power or heat water.<br />
The Middle Ages meet the future: The TechTile system has<br />
a PLEXIGLAS� cover that lets the sun’s rays through to a<br />
solar cell or collector underneath<br />
At a glance<br />
Technological benefits<br />
Thanks to the high light transmittance<br />
of PLEXIGLAS�,<br />
90 percent of the sun’s energy<br />
can be utilized<br />
Economic benefits<br />
A dual function: roofs that fit<br />
in with their surroundings and<br />
generate energy<br />
Ecological benefits<br />
Using renewable energy sources<br />
reduces resource requirements<br />
and cut CO2 emissions<br />
<strong>Annual</strong> <strong>Report</strong> <strong>2009</strong> <strong>Evonik</strong> <strong>Industries</strong> 23
PLEXIGLAS® is a fascinating material.<br />
Wouldn’t it be wonderful if more<br />
applications could see the light of day?<br />
24<br />
<strong>Annual</strong> <strong>Report</strong> <strong>2009</strong> <strong>Evonik</strong> <strong>Industries</strong>
Start Management report Consolidated financial statements Supplementary information<br />
Highlights<br />
Concentrated photovoltaics<br />
Discover a highly efficient method of turning solar energy<br />
into electric power.<br />
Background<br />
Concentrated photovoltaics (CPV) is one of<br />
the most efficient ways of turning sunlight<br />
into usable energy. Micro-structured lenses<br />
mounted in front of solar cells concentrate<br />
the sunlight on a very small area. The sunlight<br />
that impinges the lens is channeled to a highly<br />
efficient solar cell with minimum energy loss.<br />
PLEXIGLAS� SOLAR from <strong>Evonik</strong> comprises<br />
a full range of molding compounds<br />
and acrylic sheet for the production of these<br />
concentrator lenses. The PLEXIGLAS�<br />
material has amazingly high transparency,<br />
92 percent light transmittance, high durability<br />
and excellent resistance to UV radiation<br />
and weathering. Moreover, it is an inexpensive<br />
way for operators of solar facilities to<br />
increase the amount of power generated<br />
without having to invest in additional, expensive<br />
solar modules.<br />
Potential<br />
CPV broadens the opportunities for generating<br />
power from solar energy. <strong>Evonik</strong>’s<br />
customers benefit from PLEXIGLAS� SOLAR,<br />
an ideal material for the manufacture of<br />
highly specialized lenses. Moreover, <strong>Evonik</strong><br />
makes its unique expertise in implementing<br />
new ideas in the field of photovoltaics available<br />
to partners and development alliances.<br />
At a glance<br />
Technological benefits<br />
PLEXIGLAS� SOLAR offers<br />
customized transmittance<br />
properties for concentrated<br />
photovoltaic systems<br />
Economic benefits<br />
Raising the efficiency of solar<br />
power generators by increasing<br />
power yields and stepping up the<br />
use of less expensive materials<br />
Ecological benefits<br />
Resource efficiency and new<br />
prospects for photovoltaics leading<br />
to emission-free applications<br />
Close-up of a micro-structured lens made from PLEXIGLAS�: Sunlight is<br />
channeled to a small area of the solar cell with minimum energy loss<br />
<strong>Annual</strong> <strong>Report</strong> <strong>2009</strong> <strong>Evonik</strong> <strong>Industries</strong> 25
Many people dream of owning their<br />
own home. Surely it would be wonderful<br />
if they could meet their energy needs<br />
independently too?<br />
26<br />
<strong>Annual</strong> <strong>Report</strong> <strong>2009</strong> <strong>Evonik</strong> <strong>Industries</strong>
Start Management report Consolidated financial statements Supplementary information<br />
Highlights<br />
Energy-efficient housing<br />
Discover projects that permit autonomous generation of solar<br />
power and heat in residential areas.<br />
Background<br />
Buildings account for a high proportion of<br />
global energy consumption and CO2 emissions.<br />
In Moers-Kapellen in Germany, <strong>Evonik</strong><br />
is building a new residential complex comprising<br />
energy-efficient, cost-saving homes.<br />
This environment-friendly project is creating<br />
homes that meet tomorrow’s needs.<br />
The sixty owner-occupied homes at this<br />
complex get their heat from geothermal<br />
energy and their hot water from solar collectors.<br />
The indoor climate is optimized by<br />
special ventilation equipment aligned to<br />
the seasons, thus greatly reducing heating<br />
requirements. And some of the houses have<br />
photovoltaic systems that generate carbonfree<br />
power which is fed into the local electricity<br />
grid.<br />
Systematic utilization of renewable<br />
resources such as solar power and geothermal<br />
energy cuts CO2 emissions and protects<br />
living costs against the long-term rise in<br />
energy prices.<br />
Potential<br />
Globally, buildings emit around 8 gigatons<br />
of CO2 every year. In Germany, public and<br />
private buildings account for 40 percent<br />
of total energy requirements and nearly<br />
20 percent of total CO2 emissions. Residential<br />
buildings thus offer enormous potential<br />
to raise energy efficiency and cut CO2<br />
emissions.<br />
To be successful in tomorrow’s real estate<br />
markets, all-round concepts that take account<br />
of social, economic and ecological factors will<br />
be essential. Today’s strategic investments in<br />
energy efficiency and environmental protection<br />
will therefore safeguard the profitability<br />
of our real estate portfolio in the future.<br />
At a glance<br />
Technological benefits<br />
Self-sufficient energy sourcing<br />
using geothermal pumps and<br />
solar collectors<br />
Economic benefits<br />
Lower costs for heating and<br />
hot water<br />
Ecological benefits<br />
Increased efficiency and the use<br />
of renewable energy resources<br />
reduce CO2 emissions and pressure<br />
on raw materials<br />
A better way to live: modern, energy-efficient housing<br />
for families and senior citizens<br />
<strong>Annual</strong> <strong>Report</strong> <strong>2009</strong> <strong>Evonik</strong> <strong>Industries</strong> 27
Tour 2:<br />
Management report<br />
28<br />
Combined management report for <strong>2009</strong><br />
This management report is a combined management report for the <strong>Evonik</strong><br />
Group and <strong>Evonik</strong> <strong>Industries</strong> <strong>AG</strong>. Given the influence of the business<br />
areas, statements relating to the development of the business areas in the<br />
<strong>Evonik</strong> Group also apply for <strong>Evonik</strong> <strong>Industries</strong> <strong>AG</strong>. The consolidated<br />
financial statements for the <strong>Evonik</strong> Group have been prepared in accordance<br />
with the International Financial <strong>Report</strong>ing Standards (IFRS) and<br />
the financial statements of <strong>Evonik</strong> <strong>Industries</strong> <strong>AG</strong> have been prepared in<br />
accordance with the provisions of the German Commercial Code (HGB).<br />
Detailed overview: total length = 56 pages<br />
70<br />
68<br />
<strong>Annual</strong> <strong>Report</strong> <strong>2009</strong> <strong>Evonik</strong> <strong>Industries</strong><br />
60<br />
67<br />
71<br />
64<br />
41<br />
78<br />
30<br />
45<br />
75<br />
79<br />
50<br />
40<br />
84<br />
◂ ◂ ◂ ◂ ◂ ◂ ◂ ◂ ◂ ◂ ◂ ◂ ◂ ◂ ◂ ◂ ◂<br />
44<br />
◂ ◂ ◂ ◂ ◂ ◂ ◂ ◂ ◂ ◂ ◂ ◂ ◂ ◂ ◂ ◂ ◂ ◂ ◂ ◂ ◂ ◂ ◂ ◂ ◂ ◂ ◂ ◂ ◂ ◂ ◂ ◂ ◂ ◂ ◂ ◂ ◂ ◂ ◂ ◂◂ ◂ ◂ ◂ ◂ ◂ ◂ ◂ ◂ ◂ ◂ ◂ ◂ ◂ ◂ ◂ ◂ ◂ ◂◂ ◂ ◂ ◂ ◂ ◂ ◂ ◂ ◂ ◂ ◂ ◂ ◂ ◂ ◂ ◂ ◂ ◂ ◂ ◂ ◂ ◂ ◂ ◂ ◂ ◂ ◂ ◂ ◂ ◂ ◂ ◂ ◂ ◂ ◂ ◂ ◂ ◂ ◂ ◂<br />
◂ ◂ ◂ ◂ ◂ ◂ ◂ ◂ ◂ ◂ ◂ ◂ ◂◂ ◂ ◂ ◂ ◂ ◂ ◂ ◂ ◂ ◂ ◂ ◂ ◂ ◂ ◂ ◂ ◂ ◂ ◂ ◂ ◂ ◂ ◂ ◂◂ ◂ ◂ ◂ ◂ ◂ ◂ ◂ ◂ ◂ ◂ ◂ ◂ ◂
◂ ◂ ◂ ◂ ◂ ◂ ◂ ◂ ◂ ◂ ◂ ◂ ◂ ◂ ◂ ◂ ◂ ◂ ◂ ◂ ◂ ◂ ◂ ◂ ◂ ◂ ◂ ◂ ◂ ◂ ◂ ◂ ◂ ◂ ◂ ◂ ◂ ◂ ◂ ◂ ◂ ◂ ◂ ◂ ◂ ◂ ◂ ◂ ◂ ◂ ◂ ◂ ◂<br />
◂ ◂ ◂<br />
Start Management report Consolidated financial statements Supplementary information<br />
◂ ◂ ◂ ◂ ◂ ◂ ◂ ◂ ◂ ◂ ◂ ◂ ◂ ◂ ◂ ◂ ◂<br />
Tour 2: Management report<br />
30 Performance and business conditions<br />
40 Earnings position<br />
41 Financial condition<br />
◂ ◂◂ ◂ ◂ ◂ ◂ ◂ ◂ ◂ ◂ ◂ ◂ ◂ ◂ ◂ ◂ ◂ ◂ ◂ ◂ ◂ ◂ ◂ ◂ ◂ ◂ ◂ ◂ ◂◂ ◂ ◂ ◂ ◂ ◂ ◂ ◂ ◂ ◂ ◂ ◂ ◂ ◂ ◂ ◂ ◂ ◂◂ ◂ ◂ ◂ ◂ ◂ ◂ ◂ ◂ ◂ ◂ ◂ ◂ ◂ ◂ ◂ ◂ ◂ ◂ ◂ ◂<br />
44 Asset structure<br />
45 Research and development<br />
50 Performance of the business areas<br />
50 Chemicals Business Area<br />
60 Energy Business Area<br />
64 Real Estate Business Area<br />
67 Regional development<br />
68 Performance of <strong>Evonik</strong> <strong>Industries</strong> <strong>AG</strong><br />
70 Corporate responsibility<br />
71 Employees<br />
75 Environment, safety and health<br />
78 Corporate governance<br />
78 Events after the end of the reporting period<br />
79 Risk report<br />
84 Outlook<br />
◂ ◂ ◂ ◂ ◂ ◂◂ ◂ ◂ ◂ ◂ ◂◂◂<br />
◂ ◂ ◂ ◂ ◂ ◂ ◂ ◂<br />
<strong>Annual</strong> <strong>Report</strong> <strong>2009</strong> <strong>Evonik</strong> <strong>Industries</strong> 29
30<br />
Overview<br />
<strong>Annual</strong> <strong>Report</strong> <strong>2009</strong> <strong>Evonik</strong> <strong>Industries</strong><br />
Crisis year countered effectively—<br />
Focusing on specialty chemicals<br />
Performance and business conditions<br />
Resolute counteraction<br />
<strong>2009</strong> was an extremely challenging year for<br />
<strong>Evonik</strong>. The global financial and economic<br />
crisis had a dramatic impact, especially in<br />
the early months of the year, leading to a<br />
global recession. Our company also suffered<br />
severely. However, we took firm action, and<br />
quickly initiated significant cost reductions<br />
and efficiency improvements to counteract<br />
the effects. Moreover, in the midst of the<br />
crisis we demonstrated foresight by introducing<br />
a new corporate strategy to drive<br />
forward the growth-oriented development<br />
of the <strong>Evonik</strong> Group.<br />
The uncertainty that prevailed in the early<br />
part of <strong>2009</strong> made it very difficult to forecast<br />
how the economy would develop during the<br />
year. Consequently, immediate action to<br />
secure earnings and liquidity had absolute<br />
priority. That involved rapidly scaling back<br />
net working capital, utilizing scope to increase<br />
the flexibility of investment plans and taking<br />
rapid and resolute steps to introduce a Groupwide<br />
program to cut costs: Our ambitious<br />
goal was to achieve short-term savings of at<br />
least €300 million in <strong>2009</strong>. On top of that,<br />
our objective is a sustained reduction in costs<br />
of around €500 million from 2012. All activities<br />
geared to strengthening our long-term<br />
competitiveness have since been bundled in<br />
the On Track efficiency enhancement program,<br />
which entails reviewing all major cost<br />
items throughout the Group.<br />
Very strong improvement in cash flow<br />
Our cost discipline had a clear effect in <strong>2009</strong>.<br />
The cash flow from operating activities<br />
improved by €1.7 billion to €2.1 billion, permitting<br />
a perceptible reduction in net financial<br />
debt. We achieved short-term savings of<br />
around €500 million, well above our target<br />
of €300 million. Our employees made a<br />
major contribution to this. That helped us<br />
keep the reduction in EBITDA (earnings<br />
before interest, taxes, depreciation, amortization<br />
and the non-operating result) in the<br />
mid single-digit percentage range. Although<br />
sales contracted, our successful cost-cutting<br />
drive enabled us to lift the EBITDA margin<br />
to 15.5 percent, up from 13.6 percent in the<br />
previous year.<br />
<strong>Evonik</strong>’s financing is soundly based.<br />
Despite the global financial markets crisis,<br />
we were able to broaden our refinancing<br />
base in <strong>2009</strong> and lengthen the maturity<br />
structure of financial liabilities. This was<br />
achieved by the placement in October of<br />
a five-year corporate bond with a nominal<br />
value of €750 million, which attracted great<br />
interest from private and institutional investors<br />
in Europe.<br />
Selective expansion of market positions<br />
Despite the challenging economic environment,<br />
we reinforced our leadership in the<br />
chemicals and energy markets in <strong>2009</strong>. One<br />
milestone was the start-up of the integrated<br />
production complex for methacrylates and<br />
methacrylate specialties in Shanghai (China).<br />
Another important step was the boiler<br />
pressure test on Walsum 10, the innovative<br />
790 MW hard-coal power plant which is<br />
currently our biggest investment project.<br />
Through an extensive drive to step up customer<br />
focus, we also improved our position<br />
as one of Germany’s leading private-sector<br />
residential real estate companies.<br />
One key success factor behind <strong>Evonik</strong>’s<br />
promising position in the marketplace is our<br />
innovative strength. This is demonstrated<br />
clearly by the CERIO� technology developed<br />
by us to manufacture cells for large-scale<br />
lithium-ion batteries. On this basis our strategic<br />
partnership with Daimler <strong>AG</strong> in Kamenz<br />
(Dresden, Germany) is preparing to start up<br />
serial production of lithium-ion battery cells<br />
for automotive applications in 2011.
Start Management report Consolidated financial statements Supplementary information<br />
Performance and business conditions<br />
Focusing on specialty chemicals<br />
<strong>2009</strong> was a year in which <strong>Evonik</strong> took fundamental<br />
decisions to pave the way for further<br />
profitable growth and sustained value<br />
creation. Following an extensive portfolio<br />
analysis, with a view to our strategic development<br />
and the proposed IPO, we have<br />
decided to focus on specialty chemicals,<br />
where we already rank among the global<br />
leaders. We want to enable our energy<br />
business to fully exploit its considerable<br />
growth potential in collaboration with one<br />
or more partners, while remaining part of<br />
the <strong>Evonik</strong> Group. In addition, we intend<br />
to combine our real estate operations with<br />
THS and then develop perspectives for<br />
these operations on the capital markets. In<br />
our Chemicals Business Area we are systematically<br />
focusing on high-margin businesses<br />
with attractive growth and earnings potential.<br />
Above all, we want to benefit from<br />
global megatrends: resource efficiency,<br />
health and nutrition, and the globalization<br />
of technologies.<br />
<strong>Evonik</strong> successfully mastered the challenges<br />
in <strong>2009</strong>. We have the strength to<br />
derive new opportunities and new business<br />
from such challenges. That makes us optimistic<br />
about the future.<br />
Appreciable drop in volumes<br />
The global economic crisis adversely affected<br />
our business, especially in the first half of<br />
the year. The significant reduction in demand<br />
from virtually all sectors of industry and<br />
systematic destocking by our customers led<br />
to a dramatic drop in volumes. From the<br />
summer, demand picked up slightly from<br />
the low level at the start of the year. Overall<br />
the <strong>Evonik</strong> Group’s sales fell 18 percent to<br />
€13.1 billion. In the Chemicals Business Area,<br />
sales contracted by 15 percent to €10.0 billion,<br />
mainly due to lower demand. The 25 percent<br />
drop in sales to €2.6 billion in the Energy<br />
Business Area was principally attributable<br />
to a sharp drop in coal prices and lower<br />
volume sales of energy. In the Real Estate<br />
Business Area, sales improved slightly to<br />
€378 million.<br />
EBITDA only slightly down year-on-year<br />
thanks to cost-savings<br />
The operating result was trimmed substantially<br />
by plummeting demand, which caused<br />
significant underutilization of production<br />
facilities, and by the sharp drop in coal<br />
prices. Other major downside factors were<br />
impairment losses on inventories in the<br />
Chemicals and Energy Business Areas,<br />
reflecting the massive downslide in raw<br />
material prices. We responded quickly to<br />
the dramatic drop in earnings by introducing<br />
an extensive range of short and long-term<br />
measures to secure earnings and liquidity.<br />
Systematic short-term action included, first<br />
and foremost, reducing net working capital,<br />
adjusting investment spending and immediate<br />
cost-savings. The persistent underutilization<br />
of chemical production capacity forced<br />
us to make considerable operational adjustments<br />
worldwide. In Germany, which<br />
remains our most important region despite<br />
massive internationalization, we were able<br />
to cushion this by using short-time working.<br />
Thanks to successful action to cut costs<br />
and raise efficiency and to the upturn in<br />
demand from June onwards, EBITDA was<br />
€2,025 million, only 6 percent lower than<br />
in the previous year, compared with a yearon-year<br />
decline of 34 percent at the end of<br />
the first six months.<br />
In the Chemicals Business Area EBITDA<br />
was only slightly below the year-back figure<br />
at €1,602 million. In the Energy Business Area<br />
EBITDA fell 19 percent to €418 million, principally<br />
due to lower coal prices and a reduction<br />
in volume sales of energy. EBITDA<br />
slipped to €183 million in the Real Estate<br />
Business Area, a drop of 16 percent from<br />
the year-back figure, which was boosted<br />
by one-off income from the divestment of<br />
commercial real estate.<br />
<strong>Annual</strong> <strong>Report</strong> <strong>2009</strong> <strong>Evonik</strong> <strong>Industries</strong> 31
32<br />
<strong>Annual</strong> <strong>Report</strong> <strong>2009</strong> <strong>Evonik</strong> <strong>Industries</strong><br />
Sales and reconciliation from EBITDA to net income<br />
in € million <strong>2009</strong> 2008 Change in %<br />
Sales 13,076 15,873 −18<br />
EBITDA (before non-operating result) 2,025 2,165 −6<br />
Depreciation and amortization −831 −867<br />
EBIT (before non-operating result) 1,194 1,298 −8<br />
Non-operating result, continuing operations −299 −406<br />
Operating income 895 892 0<br />
Net interest expense −483 −530<br />
Income before income taxes, continuing operations 412 362 14<br />
Income before income taxes, discontinued operations 0 134<br />
Income before income taxes (total) 412 496 −17<br />
Income taxes, continuing operations −94 −128<br />
Income taxes, discontinued operations −6 −17<br />
Income after taxes 312 351 −11<br />
Non-controlling interests −72 −70<br />
Net income 240 281 −15<br />
Prior-year figures restated.<br />
Net income below prior-year figure,<br />
which was boosted by divestments<br />
EBIT (earnings before interest, taxes and the<br />
non-operating result) decreased 8 percent<br />
to €1,194 million. The non-operating loss of<br />
€299 million is the net balance of non-operating<br />
expense and non-operating income<br />
items which are by nature one-off or rare.<br />
The main non-operating expenses related<br />
to the On Track efficiency enhancement<br />
program, impairment losses on assets, the<br />
divestment of the NCN chemicals activities,<br />
a one-off payment to the German pension<br />
insurance association (Pensions-Sicherungs-<br />
Verein a. G.) and restructuring. Income<br />
mainly came from the reversal of provisions.<br />
In 2008, the main non-operating expenses<br />
were impairment losses on assets in the<br />
Chemicals Business Area, expenses for<br />
restructuring the Group, strengthening the<br />
<strong>Evonik</strong> brand and the planned shutdown of<br />
some small chemicals sites.<br />
Since non-operating expenses were<br />
lower in <strong>2009</strong>, operating income was virtually<br />
unchanged from the previous year at<br />
€895 million. Net interest expense declined<br />
to €483 million, principally due to lower<br />
interest on borrowing. The income before<br />
income taxes from the continuing operations<br />
therefore rose 14 percent to €412 mil-<br />
lion. In 2008, income before income taxes<br />
from the discontinued operations included<br />
substantial proceeds from the divestment<br />
of the tar refining and initiators businesses.<br />
Consequently, income before income taxes<br />
dropped 17 percent in <strong>2009</strong> to €412 million.<br />
The income tax rate was 24 percent and thus<br />
below the expected Group tax rate of 30 percent<br />
owing principally to income from writeups<br />
of deferred tax assets. Net income<br />
declined by 15 percent to €240 million.<br />
Forecast exceeded<br />
In view of the unforeseeable implications of<br />
the global economic crisis, it was difficult to<br />
provide guidance on <strong>2009</strong>. In the light of the<br />
economic downswing, we assumed that sales<br />
would drop considerably, and that this would<br />
also have a negative impact on EBITDA and<br />
EBIT. Indeed, sales contracted by 18 percent.<br />
However, at the operating level we were<br />
able to offset much of the decline in income<br />
through successful action to lower costs.<br />
As a result, EBITDA only slipped 6 percent<br />
year-on-year, while EBIT was 8 percent<br />
lower.<br />
Our investment plans for <strong>2009</strong> were<br />
revised in January <strong>2009</strong> in response to the<br />
difficult business conditions. Overall, we<br />
invested nearly €900 million in property,
Start Management report Consolidated financial statements Supplementary information<br />
Performance and business conditions<br />
plant and equipment and financial assets in<br />
<strong>2009</strong>, without forgoing major future-oriented<br />
investments. Capital expenditures were<br />
27 percent lower than in 2008, when we<br />
invested around €1.2 billion.<br />
Economic background<br />
Global financial markets crisis plunged<br />
the world into recession<br />
The global economy moved into a deep<br />
recession in <strong>2009</strong>, triggered by the financial<br />
markets crisis. In all, the world economy<br />
shrank by 1.2 percent. According to the<br />
OECD, the major, developed economies<br />
in the western world were worst affected<br />
by the economic downturn. By contrast,<br />
emerging markets such as Brazil, China<br />
and India held up relatively well. The only<br />
BRIC state that suffered a painful downturn<br />
was Russia.<br />
The German economy contracted by<br />
4.9 percent, one of the sharpest downturns<br />
since the Great Depression of 1931/1932.<br />
The country’s strong export focus proved its<br />
Achilles heel in this situation: Overall, exports<br />
declined by 14.4 percent in the wake of the<br />
global drop in demand. Demand for starting<br />
products and capital goods also declined<br />
within Germany due to the underutilization<br />
of industrial capacity. Gross investment<br />
slipped 17.5 percent. Only consumer spending<br />
remained comparatively stable. In fact,<br />
it increased by a marginal 0.8 percent yearon-year.<br />
Thanks to short-time working, the<br />
recession did not have a direct impact on the<br />
labor market, but the unemployment rate<br />
nevertheless rose by 1.1 percentage points to<br />
8.3 percent. Initial signs of revival emerged<br />
in the second half of the year, and exports in<br />
particular picked up. In the remaining countries<br />
in the euro zone economic growth<br />
shrank by an average of 4 percent. Here too,<br />
export-oriented countries were hardest hit.<br />
The Dutch and Italian economies contracted<br />
by 4.3 percent and 4.8 percent respectively,<br />
whereas France reported a drop of 2.3 percent.<br />
Spain and Ireland were also badly<br />
affected, with the recession causing their<br />
economies to shrink by 3.6 percent and<br />
7.5 percent. The new member states of the<br />
European Union (EU), which had previously<br />
driven growth, along with Spain and Ireland,<br />
contracted by between 14.4 percent (Estonia)<br />
and 4.4 percent (Czech Republic). The<br />
only country in this group that reported<br />
growth was Poland (1.4 percent). The<br />
British and Scandinavian economies contracted<br />
by between 4.5 percent (Denmark)<br />
and 6.9 percent (Finland). As a result, the<br />
EU economy as a whole shrank by 3.9 percent.<br />
Russia was severely affected by the global<br />
crisis. Economic output slipped 8.7 percent<br />
year-on-year, not least because of the sharp<br />
drop in energy and raw material prices.<br />
The Japanese economy also contracted<br />
by a substantial 5.3 percent. By contrast,<br />
South Korea registered minimal growth of<br />
0.1 percent.<br />
The United States, where the global<br />
crisis started, reported 2.5 percent economic<br />
contraction. Consumer spending declined<br />
by a further 0.6 percent.<br />
The economic development of China<br />
and India was chiefly responsible for checking<br />
the extent of the global recession. Having<br />
stalled briefly, the growth engines in both<br />
countries started up again, driven principally<br />
by government stimulus packages and robust<br />
domestic demand. With growth rates of<br />
6.1 percent in India and 8.3 percent in China,<br />
these economies matched or almost matched<br />
the previous year’s performance. Brazil also<br />
held up well, with economic output remaining<br />
stable compared with the previous year.<br />
During the crisis, Indonesia emerged as a new<br />
source of impetus for the world economy.<br />
This populous, commodity-rich country grew<br />
by 4.5 percent in <strong>2009</strong>.<br />
<strong>Annual</strong> <strong>Report</strong> <strong>2009</strong> <strong>Evonik</strong> <strong>Industries</strong> 33
34<br />
<strong>Annual</strong> <strong>Report</strong> <strong>2009</strong> <strong>Evonik</strong> <strong>Industries</strong><br />
Trends in the chemical sector<br />
In recent years, demand for chemical products<br />
has been boosted by continuous global<br />
growth. However, the downturn hit this<br />
sector very fast and extremely sharply. In<br />
Germany, the chemical industry declined<br />
by 15.8 percent, the biggest downturn in<br />
business in 30 years. The drop in foreign<br />
demand was a particularly sharp 19 percent.<br />
This was attributable to lower orders from<br />
the EU and Asia (excluding Japan). By contrast,<br />
exports to Japan and the USA remained<br />
relatively stable, mainly because of the comparatively<br />
non-cyclical pharmaceuticals segment,<br />
which reported a decline of 2.3 percent,<br />
well below the downturn registered<br />
by other fields. The worst affected segments<br />
were manmade fibers and inorganic<br />
commodities, where business receded by<br />
28.7 percent and 21.8 percent respectively.<br />
Demand within Germany was almost as<br />
weak as export business, with sales dropping<br />
17.6 percent. This was due to virtually<br />
zero demand from some major customers<br />
such as the automotive, construction, rubber<br />
and plastics industries.<br />
The chemical industry worldwide also<br />
suffered from the effects of the economic<br />
crisis. The EU and USA saw output drop by<br />
5.0 percent, while in Japan the downturn<br />
was 9.0 percent. The downtick in Brazil was<br />
a more modest 0.5 percent. In South Korea<br />
the sector grew by 2.5 percent year-on-year,<br />
while the Indian chemical industry gained<br />
6.5 percent. China also reported growth,<br />
although at 7 percent it was a good 6 percentage<br />
points lower than in 2008. Worldwide,<br />
the decline was 3.0 percent.<br />
Trends in the energy sector1)<br />
Energy consumption in Germany dropped<br />
significantly in <strong>2009</strong> due to the economic<br />
crisis. The decline was principally attributable<br />
to the energy-intensive primary manufacturing<br />
industry, which suffered particularly<br />
badly from the economic downturn.<br />
Overall, primary energy consumption was<br />
6.5 percent lower than in 2008 at around<br />
450 million metric tons hard coal equivalents.<br />
Demand for hard coal was worst affected by<br />
the economic situation: Power plants used<br />
around 13 percent less hard coal than in the<br />
previous year. Consumption of lignite slipped<br />
3 percent, reflecting the drop in supply to<br />
the energy sector. The proportion of renewable<br />
resources in the energy mix rose from<br />
8.2 percent in 2008 to around 9 percent in<br />
<strong>2009</strong>.<br />
In view of the lower demand from industrial<br />
users, German power consumption<br />
declined by more than 5.3 percent to around<br />
580 terawatt hours (TWh) in <strong>2009</strong>. Gross<br />
power generation was around 596 TWh.<br />
Nuclear power generation decreased by<br />
9.6 percent to around 135 TWh. Power generation<br />
from hard coal declined 12.5 percent<br />
to around 109 TWh while power generated<br />
from lignite fell 2.7 percent to around<br />
147 TWh. Power generation from natural<br />
gas decreased by 11.2 percent to around<br />
87 TWh. Renewable energies accounted for<br />
93 TWh of total energy generation.<br />
Prices on the international oil and coal<br />
markets started to plummet in the third<br />
quarter of 2008 and this trend continued in<br />
the first quarter of <strong>2009</strong>. The price of crude<br />
oil subsequently edged upwards again and<br />
by year end <strong>2009</strong> it was almost twice as high<br />
as at the start of the year. The price trend for<br />
hard coal was dominated by lower demand<br />
in the USA and Europe, despite the stabilizing<br />
effect of demand in India and China.<br />
Following the decline at the start of the<br />
year, prices initially stabilized at a low level<br />
and only picked up towards year end as<br />
demand increased.<br />
Wholesale prices for CO2 allowances and<br />
power were also dominated by the economic<br />
crisis. In view of the decline in production in<br />
energy-intensive sectors, there were a large<br />
number of additional CO2 allowances on the<br />
market. This pushed down their price considerably,<br />
so the average price was lower<br />
than in 2008. The average price of base and<br />
peak-load electricity in <strong>2009</strong> was also far<br />
lower than in 2008.<br />
At the instigation of the German government,<br />
a new energy concept is to be adopted<br />
by fall 2010. One outcome is expected to be<br />
an increase in the period for which German<br />
nuclear power plants may be operated. That<br />
will impact the German power plant landscape<br />
and the need to replace facilities.<br />
1) All data on primary energy consumption and power generation/consumption are provisional data from<br />
<strong>AG</strong> Energiebilanzen e. V. and the German water and energy industry association (BDEW).
Start Management report Consolidated financial statements Supplementary information<br />
Performance and business conditions<br />
Trends in the residential real estate sector<br />
The German housing market is dominated<br />
by owner-occupiers and private landlords.<br />
Foreign institutional investors have strengthened<br />
their position on the market in recent<br />
years by acquiring property portfolios and<br />
real estate companies from public-sector<br />
housing corporations and other owners.<br />
Activity by foreign investors on the German<br />
residential real estate market declined considerably<br />
as a result of the financial markets<br />
crisis, a trend which was already evident in<br />
2008. As a result only 107 residential real<br />
estate portfolios with around 56,000 residential<br />
units in total changed hands in <strong>2009</strong>.<br />
General demand for housing is directly<br />
linked to the number of private households<br />
and their disposable incomes. The number<br />
of households is continuing to rise as the average<br />
size of households is declining, although<br />
there is a clear divergence between the situation<br />
in different towns and communities.<br />
There were also differences in the development<br />
of net rents for residential property<br />
(excluding utility charges). Overall the average<br />
net rent for new contracts increased by<br />
nearly 0.9 percent in <strong>2009</strong> (2008: 1.1 percent).<br />
There was still no sign of a sustained turnaround<br />
in residential construction in <strong>2009</strong>.<br />
Construction permits for 176,000 residential<br />
units were issued, slightly more than in<br />
2008 (174,600). In <strong>2009</strong>, around 143,000<br />
housing units were completed (2008: around<br />
200,000). Construction of new apartments<br />
and owner-occupied properties was thus once<br />
again well below the forecast requirement<br />
of almost 300,000 units p.a. up to 2030.<br />
Business activities<br />
Corporate strategy geared to<br />
profitable growth<br />
<strong>Evonik</strong> is a modern industrial group based in<br />
Germany. Our activities are bundled in eight<br />
business units within the Chemicals, Energy<br />
and Real Estate Business Areas. The Corporate<br />
Center supports the Executive Board in<br />
the strategic management of the company,<br />
while a Shared Service Center efficiently<br />
bundles internal services. <strong>Evonik</strong>’s mid-term<br />
objective is a stock market listing, depending<br />
on the future development of the global<br />
financial markets. The company’s owners<br />
are R<strong>AG</strong>-Stiftung (direct and indirect shareholdings<br />
74.99 percent) and funds of the<br />
financial investor CVC Capital Partners<br />
(25.01 percent).<br />
In December <strong>2009</strong> we decided that in<br />
future we would concentrate on specialty<br />
chemicals, where we already rank among<br />
the global leaders. We want to enable our<br />
energy business to fully exploit its considerable<br />
growth potential in collaboration with<br />
one or more partners, while remaining part<br />
of the <strong>Evonik</strong> Group. In addition, we intend<br />
to combine our real estate operations with<br />
THS and then develop capital market perspectives<br />
for these operations.<br />
Profitable growth and sustained value<br />
creation are the heart of our corporate strategy.<br />
Our particular focus is on the economic<br />
megatrends resource efficiency, health and<br />
nutrition, and globalization of technologies.<br />
<strong>Evonik</strong> is managed in accordance with the<br />
clear principles of state-of-the-art value<br />
management. Active portfolio management,<br />
accompanied by efficient capital allocation,<br />
has high priority for the <strong>Evonik</strong> Group: We<br />
only invest in businesses with sustained and<br />
profitable growth prospects. Businesses that<br />
no longer fit our strategy or fail to meet profitability<br />
requirements are divested.<br />
<strong>Annual</strong> <strong>Report</strong> <strong>2009</strong> <strong>Evonik</strong> <strong>Industries</strong> 35
36<br />
<strong>Annual</strong> <strong>Report</strong> <strong>2009</strong> <strong>Evonik</strong> <strong>Industries</strong><br />
New Executive Board members<br />
At the start of <strong>2009</strong>, the Executive Board of<br />
<strong>Evonik</strong> <strong>Industries</strong> <strong>AG</strong> comprised Dr. Klaus<br />
Engel, Chairman of the Executive Board,<br />
with Heinz-Joachim Wagner as Chief Financial<br />
Officer and Ulrich Weber as Chief Human<br />
Resources Officer.<br />
The planned change in the company’s<br />
Chief Financial Officer took place on April 1,<br />
<strong>2009</strong>: Dr. Wolfgang Colberg, previously<br />
a member of the Managing Board of BSH<br />
Bosch and Siemens Hausgeräte GmbH,<br />
Munich (Germany), succeeded Heinz-<br />
Joachim Wagner, who retired.<br />
Ulrich Weber left <strong>Evonik</strong>’s Executive<br />
Board at his own request on June 30, <strong>2009</strong><br />
to take up a position as Chief Human<br />
Resources Officer at Deutsche Bahn <strong>AG</strong>.<br />
Ralf Blauth was appointed his successor on<br />
<strong>Evonik</strong>’s Executive Board effective July 1,<br />
<strong>2009</strong>. He remained a member of the<br />
Board of Management and Chief Human<br />
Resources Officer at <strong>Evonik</strong> Degussa GmbH<br />
until October 31, <strong>2009</strong>.<br />
<strong>Evonik</strong> accepts its responsibility<br />
<strong>Evonik</strong> aims to be a responsible, fair and<br />
reliable partner, even in periods of economic<br />
difficulty. We accept responsibility—for our<br />
business, our employees and society. That<br />
is how we define corporate responsibility<br />
(CR). In summer <strong>2009</strong> we joined the United<br />
Nations Global Compact, which sets out<br />
principles for human rights, labor standards,<br />
environmental protection and anti-corruption.<br />
As part of our corporate strategy, our CR<br />
strategy takes up economic megatrends as<br />
well as ecological and social challenges and<br />
supports the development of new business<br />
activities. We are systematically extending<br />
our CR activities on this strategic basis and<br />
inform the general public of our activities.<br />
On Track is making <strong>Evonik</strong> much<br />
more efficient<br />
We responded fast and resolutely to the<br />
economic crisis. Our top priority at the start<br />
of <strong>2009</strong> was safeguarding liquidity and<br />
earnings. Above all, we concentrated on<br />
achieving a substantial reduction in net<br />
working capital. At the same time, we<br />
scaled back our investment plans considerably<br />
and quickly defined ambitious cost<br />
reductions. For instance, we set a goal of<br />
achieving savings of at least €300 million<br />
in <strong>2009</strong>. We also set ourselves the target<br />
of a sustained reduction in costs of around<br />
€500 million from 2012. All activities geared<br />
to strengthening our long-term competitiveness<br />
are bundled in the On Track efficiency<br />
enhancement program. As part of this program,<br />
we are reviewing all major cost items<br />
in the Group and analyzing structures and<br />
processes. That includes, in particular, the<br />
Corporate Center and Shared Service<br />
Center, procurement and site services in the<br />
Chemicals Business Area and all operating<br />
units. Through the action defined by the<br />
end of <strong>2009</strong> we have already achieved over<br />
a quarter of the sustained savings targeted<br />
by On Track.<br />
At a glance<br />
Short-term target exceeded<br />
Savings of around €500 million top<br />
€300 million planned for <strong>2009</strong><br />
Concerted action<br />
Employees made a significant contribution<br />
through lower bonuses<br />
On Track<br />
Aiming for a sustained improvement<br />
in competitiveness<br />
From 2012<br />
Lasting cost-savings of around<br />
€500 million<br />
Improving efficiency<br />
All major structures and processes are<br />
being reviewed
Start Management report Consolidated financial statements Supplementary information<br />
Performance and business conditions<br />
Well ahead of our short-term<br />
savings target<br />
We have implemented our cost-cutting<br />
measures with great discipline and achieved<br />
impressive results. The short-term savings<br />
made in <strong>2009</strong> amounted to around €500 million<br />
instead of the €300 million originally<br />
envisaged. Much of this was due to cutting<br />
back outsourcing, travel expenses and other<br />
operating costs. Employees also made a<br />
considerable contribution: In the spring, all<br />
bonuses and comparable variable remuneration<br />
payments were cut by 50 percent for<br />
<strong>2009</strong> and it was decided that Group executives<br />
would not receive an increase in their<br />
basic pay in <strong>2009</strong>. Since business performance<br />
improved remarkably in the second<br />
half of the year, in December we were able<br />
to revise the bonus cuts to just 25 percent.<br />
Nevertheless, the economic outlook for 2010<br />
remains uncertain. Moreover, many of the<br />
cost-savings achieved so far have been due<br />
to one-off factors. Consequently, we have<br />
negotiated the option to reduce bonuses by<br />
a maximum of 25 percent this year if earnings<br />
are significantly below target.<br />
Global activities<br />
<strong>Evonik</strong> operates worldwide and has production<br />
facilities in 28 countries. The largest sites<br />
such as Marl, Wesseling and Rheinfelden<br />
(Germany), Antwerp (Belgium), Mobile<br />
(Alabama, USA) and Shanghai (China) have<br />
integrated production structures used by<br />
various business units. That means, for<br />
example, that by-products from one production<br />
facility can be used as starting<br />
materials for other products, resulting in<br />
optimum use of resources and thus high<br />
added value. Moreover, the business units<br />
can share the site energy supply and infrastructure<br />
cost-effectively. For technical or<br />
logistics reasons, we operate some production<br />
facilities close to our customers or on<br />
their sites (fence-to-fence facilities). There<br />
are also many smaller sites around the world<br />
that are only used by one business unit.<br />
Optimized procurement<br />
The procurement organization has been<br />
analyzed and restructured as part of the On<br />
Track project. The new structure, which was<br />
introduced on October 1, <strong>2009</strong>, strengthens<br />
profit orientation and enables our business<br />
units to respond faster to changing market<br />
trends and bundle procurement volumes.<br />
Management and coordination—in other<br />
words, procurement strategy, compliance<br />
and performance-oriented management—<br />
are central tasks. They are performed Groupwide<br />
by the procurement manager for the<br />
Chemicals Business Area, who is also the<br />
Chief Procurement Officer for the <strong>Evonik</strong><br />
Group. Through more efficient procurement<br />
we can leverage substantial and sustained<br />
savings.<br />
In addition, immediate action was taken<br />
to minimize the increased short-term risks<br />
resulting from the economic crisis. Through<br />
contingency plans to handle possible delivery<br />
stoppages and additional negotiations<br />
with suppliers, we were able to offset shortterm<br />
bottlenecks in our supply chain and<br />
avoid economic disadvantages.<br />
In <strong>2009</strong>, <strong>Evonik</strong> spent more than €7 billion<br />
on raw materials, technical equipment<br />
and services. Raw materials account for<br />
around 60 percent of total procurement volume.<br />
Of especial importance for the <strong>Evonik</strong><br />
Group are petrochemical feedstocks, particularly<br />
steam cracker products and their<br />
derivatives, which make up around 30 percent<br />
of procurement of raw materials. Silicon<br />
and silicone compounds and renewable raw<br />
materials are also very important. The decline<br />
in the oil price led to far lower prices, especially<br />
for petrochemical feedstocks. In the<br />
Chemicals Business Area, the internal raw<br />
material index, which shows the price trend<br />
for the main raw materials used, dropped<br />
back 24 percent compared with the previous<br />
year.<br />
In <strong>2009</strong>, nearly 650,000 metric tons of<br />
renewable resources were used in our chemical<br />
production processes—mainly dextrose,<br />
saccharose, fats, oils and bioethanol. That was<br />
more than 7 percent of our total consumption<br />
<strong>Annual</strong> <strong>Report</strong> <strong>2009</strong> <strong>Evonik</strong> <strong>Industries</strong> 37
38<br />
<strong>Annual</strong> <strong>Report</strong> <strong>2009</strong> <strong>Evonik</strong> <strong>Industries</strong><br />
of raw materials. By far the highest proportion<br />
is for fermentation processes for amino<br />
acids and cosmetic products. About 80 percent<br />
of <strong>Evonik</strong>’s products for the cosmetic<br />
industry are already based on natural raw<br />
materials.<br />
All business areas created value<br />
<strong>Evonik</strong> is managed on the basis of a consistent<br />
system of value-based indicators. These<br />
are used to assess the performance of the<br />
operational units and the Group. Through<br />
systematic alignment to these indicators, the<br />
Group endeavors to generate cash flows to<br />
create value and ensure profitable growth.<br />
Due to <strong>Evonik</strong>’s structure, the indicators<br />
have to take account of the differences<br />
between the various operations yet be comparable<br />
across the Group. The value-driven<br />
performance indicator system is therefore<br />
divided into three different levels. Starting<br />
from the goals of creating value and generating<br />
positive cash flows, cash flow parameters<br />
and profitability form the apex of the<br />
pyramid. These indicators are derived from<br />
uniformly defined performance indicators<br />
taken from the income statement, balance<br />
sheet and cash flow statement. The central<br />
parameters are EBITDA, EBIT and operating<br />
income.<br />
ROCE measures the return on capital<br />
employed based on the Group’s cost of capital.<br />
If ROCE is above the cost of capital, the<br />
company makes a positive contribution to<br />
economic value added. ROCE is calculated<br />
from the ratio of EBIT to average capital<br />
employed. Economic value added is calculated<br />
by multiplying capital employed by the<br />
difference between ROCE and the cost of<br />
capital.<br />
The cost of capital for the business areas is<br />
the risk-adjusted return target. It is calculated<br />
using the capital asset pricing model and<br />
WACC (weighted average cost of capital)<br />
based on peer groups for each business<br />
area. WACC reflects the internal mid-term<br />
management perspective. The annual review<br />
for <strong>2009</strong> did not reveal any need to adjust<br />
this figure compared with 2008. <strong>Evonik</strong>’s<br />
overall cost of capital is thus still 8.0 percent<br />
before taxes.<br />
Cost of capital (WACC) in <strong>2009</strong><br />
in % before taxes after taxes<br />
Chemicals 9.0 5.4<br />
Energy 7.5 4.5<br />
Real Estate 5.3 4.2<br />
<strong>Evonik</strong> 8.0 5.1<br />
In <strong>2009</strong> <strong>Evonik</strong> achieved an ROCE of 8.4 percent,<br />
which was above the cost of capital<br />
but below the previous year’s ROCE of<br />
9.0 percent. Economic value added was<br />
therefore €52 million (2008: €145 million).<br />
All three business areas earned a return<br />
above their specific cost of capital and thus<br />
made a positive contribution. In the Chemicals<br />
Business Area the improvement in ROCE<br />
was mainly due to the reduction in net working<br />
capital. In the Energy and Real Estate<br />
Business Areas a decrease in EBIT accompanied<br />
by a rise in capital employed resulted<br />
in a reduction in ROCE.
Start Management report Consolidated financial statements Supplementary information<br />
Capital employed and ROCE<br />
Performance and business conditions<br />
in € million <strong>2009</strong> 2008<br />
EBIT 1,194 1,298<br />
Intangible assets 4,022 4,109<br />
Property, plant and equipment/investment property 7,200 7,111<br />
+ Investments 712 686<br />
+ Inventories 1,865 2,004<br />
+ Trade accounts receivable 2,119 2,563<br />
+ Other non-interest-bearing assets 2,359 2,391<br />
− Interest-free provisions −1,760 −2,078<br />
− Trade accounts payable −1,073 −1,375<br />
− Other interest-free liabilities −1,161 −981<br />
− Liabilities held for sale −6 −26<br />
= Capital employed1) 14,277 14,404<br />
ROCE (EBIT/capital employed) in % 8.4 9.0<br />
1) <strong>Annual</strong> averages.<br />
ROCE by business area<br />
in % <strong>2009</strong> 2008<br />
In 2010 we will be introducing EVA� as our<br />
main indicator, together with the relevant<br />
value drivers and associated indicators, to<br />
manage the Group and enhance enterprise<br />
value.<br />
Improved margins thanks to<br />
cost reductions<br />
Since the EBITDA margin is a relative figure,<br />
it provides a key basis for internal and external<br />
comparison of cost structures and profitability.<br />
Depreciation, amortization and<br />
impairment write-downs are not included<br />
in EBITDA, so the EBITDA margin can be<br />
taken as an approximation of the return on<br />
sales-related cash flows.<br />
The Group’s EBITDA margin rose from<br />
13.6 percent to 15.5 percent as the sharp<br />
reduction in sales was accompanied by an<br />
only slight drop in EBITDA. This was mainly<br />
achieved through effective action to reduce<br />
costs.<br />
EBITDA margin by business area<br />
WACC<br />
before taxes<br />
Chemicals 10.3 9.9 9.0<br />
Energy 9.7 13.2 7.5<br />
Real Estate 7.3 9.2 5.3<br />
<strong>Evonik</strong> 8.4 9.0 8.0<br />
in % <strong>2009</strong> 2008<br />
Chemicals 16.1 13.8<br />
Energy 16.3 15.2<br />
Real Estate 48.4 57.9<br />
<strong>Evonik</strong> 15.5 13.6<br />
<strong>Annual</strong> <strong>Report</strong> <strong>2009</strong> <strong>Evonik</strong> <strong>Industries</strong> 39
40<br />
<strong>Annual</strong> <strong>Report</strong> <strong>2009</strong> <strong>Evonik</strong> <strong>Industries</strong><br />
Earnings position<br />
Impact of drop in sales mitigated<br />
by lower costs<br />
Sales contracted 18 percent in the <strong>Evonik</strong><br />
Group to €13,076 million, chiefly due to<br />
volume and price trends. Lower volume<br />
sales, declining raw material costs, shorttime<br />
working, a reduction in maintenance<br />
expenses and successful cost-savings reduced<br />
the cost of goods sold by 20 percent. The<br />
gross profit on sales was therefore €3,214 million,<br />
only 8 percent lower than in the previous<br />
year. The cost-cutting measures had a<br />
perceptible impact on selling and administrative<br />
expenses, both of which declined<br />
by 14 percent. We deliberately maintained<br />
research and development spending at a high<br />
level of €300 million, only slightly below<br />
the prior year’s spending of €311 million.<br />
The other operating income of €869 million<br />
Income statement for the <strong>Evonik</strong> Group<br />
includes income from the valuation of derivatives<br />
(€398 million), the reversal of provisions<br />
(€135 million) and currency translation<br />
of monetary items (€115 million). The operating<br />
income of €1,246 million recorded in<br />
2008 included higher income from currency<br />
translation and, above all, proceeds from the<br />
divestment of non-core business activities.<br />
The other operating expenses of €1,286 million<br />
included, among other things, expenses<br />
for the valuation of derivatives (€365 million),<br />
currency translation of monetary items<br />
(€178 million), allocations to provisions<br />
(€160 million) and impairment losses on<br />
assets. The year-back figure of €1,659 million<br />
contains far higher expenses relating to<br />
the valuation of derivatives and considerably<br />
higher impairment losses on assets.<br />
in € million <strong>2009</strong> 2008<br />
Sales 13,076 15,873<br />
Cost of sales −9,862 −12,384<br />
Gross profit on sales 3,214 3,489<br />
Selling expenses −1,044 −1,213<br />
Research and development expenses −300 −311<br />
General administrative expenses −638 −740<br />
Other operating income 869 1,246<br />
Other operating expenses −1,286 −1,659<br />
Income before the financial result and income taxes, continuing operations 815 812<br />
Financial result −403 −450<br />
Income before income taxes, continuing operations 412 362<br />
Income taxes −94 −128<br />
Income after taxes, continuing operations 318 234<br />
Income after taxes, discontinued operations −6 117<br />
Income after taxes<br />
of which attributable to<br />
312 351<br />
Non-controlling interests 72 70<br />
Shareholders of <strong>Evonik</strong> <strong>Industries</strong> <strong>AG</strong> (net income) 240 281<br />
Prior-year figures restated.
Start Management report Consolidated financial statements Supplementary information<br />
Earnings position<br />
Financial condition<br />
Increase in income from continuing<br />
operations<br />
Income from the continuing operations<br />
before income taxes and the financial result<br />
increased slightly year-on-year to €815 million.<br />
The financial result improved by<br />
€47 million to minus €403 million, mainly due<br />
to lower interest expense for financing.<br />
The income before income taxes from the<br />
continuing operations therefore rose 14 percent<br />
to €412 million. Income tax expense<br />
was €94 million, giving a tax rate of 24 percent.<br />
That is below the Group’s tax rate of<br />
30 percent, mainly as a result of income from<br />
write-backs of deferred tax assets. In 2008,<br />
this item contained one-off tax effects of<br />
€20 million relating principally to exchange<br />
rates and non-period taxes. Overall, income<br />
after taxes from the continuing operations<br />
increased 36 percent to €318 million.<br />
The loss of €6 million from the discontinued<br />
operations principally comprises postdivestment<br />
expenses relating to non-core<br />
activities sold in previous years. The prioryear<br />
figure mainly reflected the proceeds<br />
from the divestment of the tar refining and<br />
initiators activities. Net income was therefore<br />
€240 million, down 15 percent compared<br />
with the figure for 2008, which contained<br />
the proceeds from these divestments.<br />
Maturity structure of the <strong>Evonik</strong> Group’s financial debt<br />
in € million<br />
2010<br />
2011<br />
2012<br />
2013<br />
2014<br />
2015<br />
2016<br />
2017<br />
2018<br />
2019 ff.<br />
As of December 31, <strong>2009</strong>.<br />
Financial condition<br />
Effective financial management<br />
The central objectives of financial management<br />
are to safeguard the financial independence<br />
of the <strong>Evonik</strong> Group and limit refinancing<br />
risks. Funding for Group companies,<br />
including guarantees and sureties, is therefore<br />
managed centrally by <strong>Evonik</strong> <strong>Industries</strong> <strong>AG</strong>.<br />
To reduce external borrowing, surplus<br />
liquidity is placed in a cash pool at Group<br />
level to cover financing requirements in other<br />
Group companies. <strong>Evonik</strong> has a flexible<br />
range of corporate financing instruments to<br />
meet capital requirements for day-to-day<br />
business, investments and the repayment of<br />
financial debt.<br />
Successful debut bond issue<br />
In October <strong>2009</strong> <strong>Evonik</strong> <strong>Industries</strong> <strong>AG</strong> successfully<br />
placed its first bond on the capital<br />
markets, thus putting the Group’s long-term<br />
financing on an even sounder basis. The bond<br />
proved very popular with both German and<br />
European investors and was seven times<br />
oversubscribed. The €750 million bond has<br />
a maturity of five years and a coupon of<br />
7.000 percent. It was issued on October 14,<br />
<strong>2009</strong> at a price of 99.489 percent, giving<br />
a yield of 7.125 percent p.a. In July <strong>2009</strong><br />
we had issued a €183.5 million note with<br />
a maturity of 3.5 years. The proceeds from<br />
0 200 400 600 800 1,000 1,200 1,400 1,600<br />
<strong>Annual</strong> <strong>Report</strong> <strong>2009</strong> <strong>Evonik</strong> <strong>Industries</strong> 41
42<br />
<strong>Annual</strong> <strong>Report</strong> <strong>2009</strong> <strong>Evonik</strong> <strong>Industries</strong><br />
these two issues enabled us to repay existing<br />
credits well before their maturity and<br />
lengthen the maturity profile of our financial<br />
debt. To further improve our access to<br />
the capital markets, we aim to obtain an<br />
external rating in 2010.<br />
Another element in our long-term financing<br />
is a corporate bond issued by <strong>Evonik</strong><br />
Degussa GmbH in 2003 , which has a nominal<br />
value of €1.25 billion and matures in<br />
December 2013. Other pillars of the Group’s<br />
long-term financing are bilateral credit<br />
agreements for real estate1) totaling some<br />
€0.5 billion and drawings of around €1.2 billion<br />
on long-term project-financing in the<br />
Energy Business Area. Included in the amount<br />
drawn as of December 31, <strong>2009</strong> is €555 million<br />
of the €615 million project financing<br />
arranged by <strong>Evonik</strong>-EVN Walsum 10 Kraftwerksgesellschaft<br />
mbH in 2006 to fund the<br />
“Walsum 10” power plant project. Utilization<br />
Net financial debt<br />
Comfortable liquidity cushion<br />
As its central liquidity source, as of December<br />
31, <strong>2009</strong> the Group had a €2,250 million<br />
revolving credit facility (RCF) from a syndicate<br />
of around 60 national and international<br />
banks. This credit facility runs until March<br />
2011 and interest on amounts drawn is calculated<br />
at the EURIBOR rate plus a margin.<br />
None of this facility was drawn at year end<br />
<strong>2009</strong>.<br />
Under the covenants for this RCF <strong>Evonik</strong><br />
has given an undertaking that it will meet<br />
specific financial ratios. The most important<br />
of these relates to leverage, in other words,<br />
of this financing facility will increase as the<br />
project proceeds.<br />
There are also agreed bilateral credit<br />
facilities (especially money market lines)<br />
amounting to €224 million to cover shortterm<br />
funding requirements, and €365 million<br />
for guarantees and sureties. Drawings<br />
at the end of <strong>2009</strong> were €67 million and<br />
€265 million respectively.<br />
Significant reduction in net financial debt<br />
Financial debt was €4,495 million at year<br />
end, a reduction of €907 million from year<br />
end 2008 thanks to successful action to<br />
secure earnings and liquidity. The chief factor<br />
here, alongside a perceptible reduction<br />
in net working capital and adjustment of<br />
investment spending, was the significant cut<br />
in costs. Net financial debt actually declined<br />
by €1,152 million to €3,431 million thanks to<br />
an increase in financial assets.<br />
in € million Dec. 31, <strong>2009</strong> Dec. 31, 2008<br />
Non-current financial liabilities 4,040 4,394<br />
Current financial liabilities 455 1,008<br />
Financial debt 4,495 5,402<br />
– Cash and cash equivalents –885 –536<br />
– Short-term securities –23 –7<br />
– Receivables from derivatives –128 –218<br />
– Other financial assets –28 –58<br />
Net financial debt 3,431 4,583<br />
1) See Note (7.11) to the consolidated financial statements.<br />
the ratio of net debt to EBITDA. The other<br />
covenants are interest cover (EBITDA relative<br />
to the net interest position) and the loan-tovalue<br />
ratio, an asset-based indicator that looks<br />
at the net financial debt of the Real Estate<br />
Business Area relative to the market value<br />
of its property. Timely monitoring of these<br />
ratios and forecasting of their development<br />
is ensured. We report quarterly to the banks<br />
in the syndicate on compliance with these<br />
covenants. In <strong>2009</strong> <strong>Evonik</strong> was able to demonstrate<br />
that it had met all contractually<br />
agreed minimum requirements by a wide<br />
margin on all reporting dates.
Start Management report Consolidated financial statements Supplementary information<br />
Financial condition<br />
Capital expenditures focused on key<br />
growth projects<br />
<strong>Evonik</strong> uses selective investment projects to<br />
build on its strong competitive position and<br />
expand into business activities and markets<br />
where we see potential for profitable longterm<br />
growth and an opportunity to generate<br />
high returns. Every project is subject to a<br />
detailed strategic and economic analysis,<br />
including sensitivity analyses and scenarios<br />
that simulate the main risks, and has to meet<br />
business-specific and risk-adjusted minimum<br />
return criteria which include covering the<br />
cost of central functions.<br />
In <strong>2009</strong> we reduced investment in property,<br />
plant and equipment and intangible<br />
assets by 27 percent to €849 million (2008:<br />
€1,160 million). Scaling back investment<br />
was a key element in <strong>Evonik</strong>’s successful<br />
action to counter the consequences of the<br />
global economic crisis. Savings were also<br />
achieved by systematically reducing investment<br />
in the replacement and maintenance<br />
of facilities through process improvements,<br />
and by keeping such expenditures to the<br />
Major projects completed or virtually completed in <strong>2009</strong><br />
Business Area Location Project<br />
Strong improvement in cash flow<br />
Timely action to secure liquidity at the start<br />
of the year had a positive effect: The cash<br />
flow from operating activities increased by<br />
€1,704 million to €2,092 million. The main<br />
driver was a reduction of just over €900 mil-<br />
necessary minimum. Strategic growth projects<br />
and other major projects which had<br />
already started were continued as planned.<br />
As in 2008, the largest single project was<br />
the erection of a 790 MW coal-fired power<br />
plant in Duisburg-Walsum (Germany). This<br />
is scheduled to come into service in 2010. In<br />
Shanghai (China), we successfully started up<br />
a new integrated production complex at a<br />
total investment cost of around €250 million.<br />
This was <strong>Evonik</strong>’s largest project in China to<br />
date and the second-largest single investment<br />
ever undertaken by the Chemicals Business<br />
Area.<br />
The Chemicals Business Area once again<br />
received the largest proportion of capital<br />
expenditures (59 percent), while 33 percent<br />
was invested in the Energy Business Area.<br />
The regional focus of capital expenditures<br />
was Germany, which accounted for 67 percent<br />
of the total, followed by Asia, which<br />
accounted for 18 percent.<br />
Additions to financial assets totaled<br />
€42 million, which was below the year-back<br />
figure of €149 million.<br />
Chemicals Marl (Germany) Capacity expansion at 2-propylheptanol plant<br />
Mobile (Al, USA) Construction of a new facility for alcoholates<br />
Dossenheim (Germany) New production facility for pharmaceutical active ingredients<br />
Shanghai (China) New production plant for binders for coatings<br />
Shanghai (China) New production facility for MMA, specialty monomers<br />
and PMMA molding compounds<br />
Energy Duisburg-Walsum (Germany) New hard-coal power plant<br />
Saarforst/Warndt (Germany) New biomass plant<br />
Real Estate Germany Mainly construction of new residential units and<br />
modernization to improve energy efficiency<br />
For information on current capital expenditure projects, please see the sections on the business areas and regions.<br />
lion in net working capital. Alongside the<br />
substantial drop in raw material prices, this<br />
was principally due to successful action to<br />
reduce inventories and receivables. By contrast,<br />
in 2008 net working capital increased<br />
by around €450 million. Further, in <strong>2009</strong><br />
<strong>Annual</strong> <strong>Report</strong> <strong>2009</strong> <strong>Evonik</strong> <strong>Industries</strong> 43
44<br />
<strong>Annual</strong> <strong>Report</strong> <strong>2009</strong> <strong>Evonik</strong> <strong>Industries</strong><br />
other assets decreased by around €200 million,<br />
partly due to lower receivables from<br />
finance leases and derivatives.<br />
The outflow of funds for investing activities<br />
increased slightly to €632 million. At the<br />
same time, cash inflows from the disposal of<br />
Cash flow statement for the <strong>Evonik</strong> Group (excerpt)<br />
assets were far lower. The sharp improvement<br />
in the cash flow from operating activities<br />
was sufficient to finance investments<br />
and significantly reduce financial debt. The<br />
cash outflow for financing activities was<br />
therefore €1,113 million.<br />
in € million <strong>2009</strong> 2008<br />
Cash flow from operating activities 2,092 388<br />
Cash flow from investing activities −632 −555<br />
Cash flow from financing activities −1,113 356<br />
Cash and cash equivalents as of December 31 885 536<br />
Asset structure<br />
Increase in equity<br />
Total assets decreased by €1.2 billion to<br />
€18.9 billion. Non-current assets shrank<br />
by €0.3 billion to €13.5 billion, mainly as a<br />
result of lower receivables from finance<br />
leases and derivatives. Current assets contracted<br />
by €0.9 billion to €5.4 billion, due<br />
to a reduction of €0.6 billion in inventories,<br />
a drop of €0.4 billion in trade accounts<br />
receivable, and divestment of operations<br />
totaling €0.2 billion. At the same time, cash<br />
and cash equivalents rose by €0.3 billion.<br />
The decline in inventories reflects lower raw<br />
<strong>Evonik</strong> Group: Balance sheet structure<br />
material prices and selective destocking.<br />
Non-current assets rose slightly to 71 percent<br />
of total assets and are financed by liabilities<br />
with the same maturity structure.<br />
Equity increased slightly to €5.2 billion.<br />
The equity ratio improved from 25.6 percent<br />
to 27.6 percent. Non-current liabilities<br />
decreased by €0.4 billion to €10.2 billion<br />
thanks to the reduction in non-current<br />
financial debt. The reduction in short-term<br />
financial debt and a decline in provisions<br />
reduced current liabilities by €0.9 billion<br />
to €3.5 billion.<br />
in € million <strong>2009</strong>1) 20081) <strong>2009</strong>1) 20081)<br />
Non-current<br />
assets<br />
Current<br />
assets<br />
1) As of December 31.<br />
13,469<br />
(71%)<br />
5,438<br />
(29%)<br />
13,746<br />
(68%)<br />
6,369<br />
(32%)<br />
Equity<br />
Non-current<br />
liabilities<br />
Current<br />
liabilities<br />
5,214<br />
(28%)<br />
10,192<br />
(54%)<br />
3,501<br />
(18%)<br />
5,155<br />
(26%)<br />
10,602<br />
(53%)<br />
4,358<br />
(21%)<br />
18,907 20,115 18,907 20,115
Start Management report Consolidated financial statements Supplementary information<br />
Asset structure<br />
Research and development<br />
Research and development<br />
R&D drives growth<br />
Our innovative capacity is our strength. The<br />
large number of first-time patent applications<br />
filed by <strong>Evonik</strong> places it at the forefront of<br />
the specialty chemicals sector. Products,<br />
processes and applications developed in the<br />
past five years account for around 20 percent<br />
of sales in our Chemicals Business Area.<br />
Moreover, the Energy Business Area is a<br />
leader in raising the efficiency of hard-coal<br />
power plants. Market-oriented research and<br />
development (R&D) is expanding our strong<br />
position in specialty chemicals and power<br />
plant technology. Despite the economic crisis,<br />
the <strong>Evonik</strong> Group’s R&D spending was<br />
€300 million in <strong>2009</strong> (2008: €311 million).<br />
This continued high level of expenditure<br />
underscores the especial significance that<br />
we attach to R&D as the basis for profitable<br />
future growth.<br />
In the specialty chemicals sector in particular,<br />
a constant stream of demanding new<br />
products and applications is indispensable<br />
to ensure lasting success against the global<br />
competition. The development of new<br />
products accounts for 41 percent of our<br />
R&D spending in the Chemicals Business<br />
Area, while 20 percent is allocated to the<br />
development of new technology platforms.<br />
The Chemicals Business Area’s global R&D<br />
network comprises more than 35 locations<br />
with around 2,300 employees. Our R&D<br />
center in Shanghai has proven particularly<br />
dynamic. In <strong>2009</strong>, five years after it was<br />
opened, it was extended for the second<br />
time. This reflects <strong>Evonik</strong>’s increased presence<br />
in the fast-growing Chinese specialty<br />
chemicals market, where innovation coupled<br />
with customer proximity is a key success<br />
factor. So far, we have invested more than<br />
€20 million in the R&D center in Shanghai.<br />
Chemicals Business Area: R&D spending<br />
Other<br />
1%<br />
Improved application for<br />
established products<br />
13%<br />
Improved<br />
production<br />
processes for<br />
established<br />
products<br />
25%<br />
Development of new products<br />
41%<br />
Basic research<br />
for new<br />
key technologies<br />
20%<br />
Efficiency of power plants is rising steadily<br />
Research in our Energy Business Area focuses<br />
on raising the efficiency of hard-coal power<br />
plants and the related reduction in CO2<br />
emissions, accompanied by improving the<br />
cost-efficiency of power plant processes.<br />
While our latest power plant, Walsum 10,<br />
which is scheduled to come into service<br />
shortly, will have outstanding efficiency of<br />
over 45 percent, our research is already concentrating<br />
on the next dimension: coal-fired<br />
power plants with efficiency of 50 percent.<br />
We are driving forward the development of<br />
the necessary materials through collaborative<br />
research projects. To supplement our role in<br />
projects concentrating on 700 °C technology,<br />
our Eco2 Science-to-Business Center (S2B<br />
Center) is working separately on the feasibility<br />
of a 700 °C power plant. Further process<br />
optimization is also a focal area of our R&D.<br />
<strong>Annual</strong> <strong>Report</strong> <strong>2009</strong> <strong>Evonik</strong> <strong>Industries</strong> 45
46<br />
<strong>Annual</strong> <strong>Report</strong> <strong>2009</strong> <strong>Evonik</strong> <strong>Industries</strong><br />
At a glance<br />
Science-to-Business Centers<br />
Focus:<br />
High-risk R&D projects<br />
Areas that are completely new for <strong>Evonik</strong><br />
Duration: Five years<br />
Current: Eco2, Nano tronics and Bio<br />
Project Houses<br />
Focus: Topics of especial strategic<br />
interest<br />
Interdisciplinary research<br />
Duration: Three years<br />
Current: Functional Films & Surfaces,<br />
Systems Integration<br />
Completed: Six Project Houses in<br />
2000–2007<br />
Start-ups und spin-offs<br />
Commercialization of the results of<br />
strategic R&D<br />
Increasing power generation from renewable<br />
resources such as wind, where availability<br />
cannot be planned, requires rapidly<br />
available reserve capacity. More flexible use<br />
of generators can be assured with the aid of<br />
advanced control concepts that utilize the<br />
potential of process technology and process<br />
control systems. Lithium-ion batteries to<br />
store power represent another promising<br />
possibility in this field. Consequently our<br />
Energy and Chemicals Business Areas are<br />
working with our Eco2 S2B Center and scientific<br />
and industrial partners on the Lithium<br />
Electricity Storage System (LESSY),<br />
a project established as part of the Lithium-<br />
Ion Battery (LIB) 2015 innovation alliance,<br />
which receives support from Germany’s<br />
Federal Ministry for Education and Research<br />
(BMBF). Thermal utilization of biomass<br />
has long played a very important role in the<br />
Energy Business Area. In this field we are<br />
investigating alternative generating processes<br />
based on biomass and biogas and driving<br />
forward the processing of biogas for use in<br />
mine gas and natural gas networks.<br />
Electric vehicles are a focus of research<br />
One special success story in our Chemicals<br />
Business Area is the development of proprietary<br />
technology for serial production of<br />
cells for large-scale lithium-ion batteries.<br />
In recent years, we have invested around<br />
€100 million in R&D in this field. This<br />
storage technology, which uses high-<br />
performance SEPARION� separator membranes,<br />
is protected by extensive patents<br />
and was bundled under the brand name<br />
CERIO� in <strong>2009</strong>. <strong>Evonik</strong> aims to be Europe’s<br />
no. 1 manufacturer of large-scale lithium-ion<br />
battery cells and components.<br />
<strong>Evonik</strong> is also continuing to drive forward<br />
lithium-ion technology in collaboration with<br />
partners from science and industry. For<br />
example, we sponsor a chair at Westfälische<br />
Wilhelms-University in Münster (Germany)<br />
which is dedicated to researching the use of<br />
large-scale lithium-ion batteries to store<br />
energy. And together with BASF, Bosch<br />
and Volks wagen, we are a member of the<br />
LIB 2015 innovation alliance. To develop the<br />
technology required for mass production of<br />
large-scale lithium-ion batteries for automotive<br />
applications, in summer <strong>2009</strong> we<br />
embarked on the ProLiEMo project with<br />
our strategic partner Daimler <strong>AG</strong>. Funding<br />
for this project has been made available out<br />
of the German government’s second economic<br />
stimulus package (electromobility<br />
section). We are also involved in ELAN<br />
2020, a cross-sector initiative to promote<br />
electric mobility, which has commissioned<br />
scientific research into the requirements for<br />
a safe, economical and widespread infrastructure<br />
for electric vehicles.
Start Management report Consolidated financial statements Supplementary information<br />
Research and development<br />
Modern innovation structures and<br />
processes are a hallmark of <strong>Evonik</strong><br />
Key success factors for the Chemicals Business<br />
Area are its excellent market insight,<br />
close relationships with customers and efficient<br />
R&D. For every €1 invested in R&D<br />
we generate sales of around €1.50 p.a. This<br />
is based on our modern innovation structures<br />
and processes, which are designed to turn<br />
ideas into profit by translating them into<br />
marketable products as quickly as possible.<br />
Strategic research geared to building new<br />
high-tech activities outside <strong>Evonik</strong>’s present<br />
business portfolio is bundled at Creavis<br />
Technology & Innovation and receives<br />
15 percent of the R&D budget allocated to<br />
the Chemicals Business Area. The Project<br />
Houses, S2B Centers and internal start-ups<br />
operated by Creavis are optimally aligned<br />
complementary approaches. <strong>Evonik</strong>’s current<br />
S2B Centers are Nanotronics (development<br />
of system solutions based on nanomaterials<br />
for the electronics industry), Bio<br />
(development of new biotechnology products<br />
and processes based on renewable raw<br />
materials) and Eco2, which runs projects<br />
that bring together all three business areas—<br />
Chemicals, Energy and Real Estate—for the<br />
first time. The research scientists at the Eco2<br />
S2B Center are working on solutions to<br />
raise energy efficiency for customers and<br />
for <strong>Evonik</strong>’s own processes. Other projects<br />
comprise carbon capture, and power generation<br />
and storage. We expect the activities<br />
bundled at Creavis to generate additional<br />
sales of around €600 million p.a. from 2015.<br />
That does not include the lithium-ion battery<br />
cells business, which was developed<br />
at Creavis and has since been spun off into<br />
separate legal entities.<br />
To leverage further growth potential<br />
through our innovative developments, the<br />
Chemicals Business Area has defined six<br />
“Areas of Competence”: Inorganic Particle<br />
Design, Coating & Bonding Technologies,<br />
Interfacial Technologies, Designing with<br />
Polymers, Biotechnology, and Catalytic<br />
Processes. These cover more than 80 percent<br />
of the markets in which we operate<br />
and pool our knowledge of future-oriented<br />
technologies.<br />
True to the motto “Open Innovation”, <strong>Evonik</strong><br />
has around 250 alliances with universities<br />
and scientific institutes. In <strong>2009</strong> we invested<br />
€10 million in joint research with universities,<br />
scientific and technical institutes and other<br />
companies. The aim is to ensure rapid transfer<br />
of the results of top-level research in<br />
the fields of chemistry, biology and physics<br />
to the company. Today, attractive areas of<br />
innovation are mainly found at the interfaces<br />
between traditional disciplines such as<br />
chemistry and biology or chemistry and<br />
engineering.<br />
<strong>Evonik</strong>’s innovative strength is not simply<br />
due to the right strategies, structures and<br />
priorities. Our highly qualified, creative and<br />
motivated R&D employees are a key factor<br />
in this success. To provide an incentive for<br />
excellent research work, we present the<br />
annual <strong>Evonik</strong> Innovation Award. The latest<br />
awards in all three categories were made in<br />
December <strong>2009</strong>.<br />
At a glance<br />
”New Products“ category<br />
Project: New functional silanes for the<br />
construction and fillers industries<br />
Business unit: Inorganic Materials<br />
”New Processes“ category<br />
Project: A world first: Organic solvent<br />
nanofiltration used on a commercial scale<br />
in a homogeneously catalyzed process<br />
Business/Service unit: Industrial<br />
Chemicals, Process Technology &<br />
Engineering<br />
”New System Solutions“ category<br />
Project: CoverForm�—Scratch-resistant<br />
PMMA<br />
Business unit: Performance Polymers<br />
creavis.com<br />
<strong>Annual</strong> <strong>Report</strong> <strong>2009</strong> <strong>Evonik</strong> <strong>Industries</strong> 47
48<br />
<strong>Annual</strong> <strong>Report</strong> <strong>2009</strong> <strong>Evonik</strong> <strong>Industries</strong><br />
Market-oriented research by the<br />
Chemicals Business Area<br />
85 percent of our chemicals research comprises<br />
projects undertaken by the business<br />
units, which are geared specifically to their<br />
core markets and technologies. In <strong>2009</strong>, this<br />
further strengthened our technological edge<br />
and market leadership.<br />
Examples are the integrated C4 facilities,<br />
whose efficiency has been increased considerably<br />
by an interdisciplinary research team<br />
from the Industrial Chemicals Business Unit<br />
and Process Technology & Engineering. Their<br />
achievements include the world’s first technical<br />
application for nanofiltration for recovery<br />
of a homogeneous catalyst, for which<br />
they received the <strong>Evonik</strong> Innovation Award<br />
<strong>2009</strong> in the category “New Processes”.<br />
Industrial Chemicals has continued to<br />
develop SiYPro (Simplify Your Process), a<br />
new product that avoids spontaneous polymerization<br />
in plants used to produce ethylene,<br />
butadiene, styrene, acrylonitrile, etc.,<br />
and thus extends the intervals between<br />
cleaning. The green retarder SiYPro Super 100<br />
prevents unwanted polymerization in styrene<br />
plants. <strong>Evonik</strong>’s innovation offers customers<br />
a more environment-friendly alternative to<br />
dinitrobutyl phenol (DNBP) which has previously<br />
been used for this.<br />
The Inorganic Materials Business Unit<br />
has developed two new products for the<br />
fast-growing thermoplastic elastomers market.<br />
AEROBATCH� PP and AEROBATCH� U<br />
bring a significant improvement in the<br />
mechanical properties of thermoplastic<br />
elastomers, such as resistance to aging, and<br />
greatly increase the viability of the production<br />
process.<br />
Functional silanes repel water and provide<br />
protection against graffiti and corrosion,<br />
two properties that are highly sought after<br />
in the construction industry. However, the<br />
alkoxy groups in the silanes meant that in the<br />
past these benefits could only be harnessed<br />
at the expense of a high proportion of volatile<br />
organic compounds (VOCs). A new<br />
oligomeric alkylsiloxane from the Inorganic<br />
Materials Business Unit’s PROTECTOSIL�<br />
product family reduces emissions of VOCs<br />
by up to 85 percent. At the same time, it<br />
provides excellent corrosion protection for<br />
concrete and thus permits thinner concrete<br />
layers on the steel rebars. That in turn reduces<br />
the required amount of concrete, which is a<br />
very energy-intensive building material. This<br />
innovation won the <strong>Evonik</strong> Innovation Award<br />
<strong>2009</strong> in the category “New Products”.<br />
The Consumer Specialties Business Unit<br />
once again launched a broad array of innovative<br />
products in <strong>2009</strong>. ABIL� T Quat 60, a<br />
novel siloxane-based cosmetic raw material<br />
that sets new standards in hair care, attracted<br />
especial attention. This product protects<br />
hair from damage caused by blow-drying,<br />
coloration and washing.<br />
Another promising invention is<br />
ORTEGOL� 76, a new polyurethane foam<br />
additive from Consumer Specialties for<br />
viscoelastic foam systems. Applications<br />
include modern high-performance mattresses<br />
which mold themselves optimally<br />
to the body, and carpet backcoatings, which<br />
can now be produced without solvents,<br />
making production far more environmentfriendly.<br />
<strong>Evonik</strong>’s Health & Nutrition Business<br />
Unit is one of the world’s largest producers<br />
of synthetic amino acids for animal nutrition.<br />
R&D in this business unit currently includes<br />
innovative process modifications for DLmethionine<br />
which should be ready for use<br />
in 2010. A new process has been developed<br />
for L-tryptophan, and improved production<br />
strains with better yields and higher productivity<br />
are available for L-threonine and<br />
L-lysine. In collaboration with AlzChem<br />
Trostberg, the Health & Nutrition Business<br />
Unit has developed CreAmino, a feed<br />
additive for fattening poultry and pork, to<br />
market maturity. The business unit also<br />
expanded fermentative production routes<br />
for amino acids for pharmaceuticals.
Start Management report Consolidated financial statements Supplementary information<br />
Research and development<br />
The Coatings & Additives Business Unit<br />
has selectively expanded its portfolio of<br />
products and processes focused on sustainability,<br />
energy efficiency and environmental<br />
friendliness. Start-up of a production facility<br />
in Shanghai (China) that produces binders<br />
for coatings using a new, environmentfriendly<br />
process, was the high-point of a<br />
development process that has taken several<br />
years. The innovative polymerization technology<br />
used in this plant, which forms part<br />
of the large integrated methacrylates complex,<br />
permits production of a new generation<br />
of binders that do not require additives<br />
such as emulsifiers and thus improve the<br />
quality of coatings.<br />
Another highlight is a completely new<br />
class of oil additives produced with previously<br />
unattained energy efficiency. Coatings<br />
& Additives is collaborating with well-known<br />
OEMs to establish this technology on the<br />
market quickly.<br />
R&D in the Chemicals Business Area<br />
The Performance Polymers Business Unit<br />
and KraussMaffei have set new standards of<br />
plastics processing with CoverForm�, a joint<br />
development which received the <strong>Evonik</strong><br />
Innovation Award <strong>2009</strong> in the category<br />
“New System Solutions”. This innovation<br />
allows injection molded plastic components<br />
with a functional surface to be manufactured<br />
in a one-step process. That greatly<br />
reduces production costs for scratch-free,<br />
chemical-resistant plastics parts.<br />
Performance Polymers has also developed<br />
new polyetherether ketone polymers marketed<br />
as VESTAKEEP� for medical products<br />
that remain in the body for more than 30 days.<br />
Extensive documentation submitted to the<br />
US Food and Drug Administration simplifies<br />
customers’ filings for marketing approval<br />
for implants made of this high-performance<br />
material.<br />
R&D employees approx. 2,300<br />
Locations more than 35<br />
Total R&D projects approx. 500<br />
R&D projects focusing on resource efficiency approx. 100<br />
Cooperation with universities and scientific institutes approx. 250<br />
Number of new patent applications approx. 300<br />
Patents (granted and pending) more than 24,000<br />
Registered trademarks (granted and pending) more than 7,500<br />
<strong>Annual</strong> <strong>Report</strong> <strong>2009</strong> <strong>Evonik</strong> <strong>Industries</strong> 49
50<br />
<strong>Annual</strong> <strong>Report</strong> <strong>2009</strong> <strong>Evonik</strong> <strong>Industries</strong>
Start Management report Consolidated financial statements Supplementary information<br />
Chemicals Business Area<br />
Performance of the business areas<br />
Chemicals Business Area<br />
The Chemicals Business Area bundles<br />
<strong>Evonik</strong>’s global specialty chemicals activities.<br />
We are one of the world’s largest and<br />
most significant players in this sector. More<br />
than 80 percent of sales are generated by<br />
products where we rank among the market<br />
leaders and we are constantly working<br />
to raise that proportion and improve the<br />
quality of our portfolio. The spectrum of<br />
Chemicals Business Area: Key data1)<br />
future-oriented activities and regional<br />
growth markets is very balanced: None of<br />
the end-markets for our products accounts<br />
for more than 20 percent of sales. Another<br />
of <strong>Evonik</strong>’s strengths is close collaboration<br />
with customers, to whom we supply optimal<br />
products and system solutions, often<br />
tailored to their specific needs.<br />
in € million <strong>2009</strong> 20082) Change in %<br />
External sales 9,978 11,762 −15<br />
EBITDA 1,602 1,626 −1<br />
EBIT 932 941 −1<br />
Capital expenditures3) 502 727 −31<br />
Depreciation and amortization3) 639 674 −5<br />
Capital employed (annual average) 9,071 9,477 −4<br />
ROCE in % 10.3 9.9<br />
EBITDA margin in % 16.1 13.8<br />
Employees 29,723 31,728 −6<br />
1) In addition to the operational business units, the key data include strategic research, cross-unit site services and<br />
management expenses.<br />
2) Prior-year figures restated to reflect reversal of transfer of 50 percent stake in Infracor. See Note (9.1) to the<br />
consolidated financial statements.<br />
3) For intangible assets, property, plant and equipment and investment property.<br />
<strong>Annual</strong> <strong>Report</strong> <strong>2009</strong> <strong>Evonik</strong> <strong>Industries</strong> 51
52<br />
Chemicals Business Area: Change in sales<br />
in %<br />
<strong>Annual</strong> <strong>Report</strong> <strong>2009</strong> <strong>Evonik</strong> <strong>Industries</strong><br />
Far lower demand<br />
The global economic crisis led to a massive<br />
drop in volumes in almost all business units,<br />
especially in the early months of <strong>2009</strong>. This<br />
was caused by a combination of far lower<br />
demand and systematic destocking by customers.<br />
From about June, demand in some<br />
regions and industries started to pick up<br />
gradually from the low level seen at the<br />
start of the year, and this trend continued<br />
in the second half. The main impetus came<br />
from Asia and Europe, while business in<br />
North America generally remained low. The<br />
22 percent drop in volumes registered in the<br />
first six months was reduced to 10 percent<br />
over the year as a whole. The 6 percent<br />
reduction in prices principally reflects the<br />
fact that lower raw material costs were<br />
passed on to customers. The change in the<br />
scope of consolidation mainly comprised<br />
the divestment of the AlzChem Group.<br />
Overall, sales in the Chemicals Business<br />
Area shrank 15 percent to €9,978 million.<br />
Volumes −10<br />
Prices −6<br />
Changes in scope of consolidation −1<br />
Exchange rates 2<br />
Total −15<br />
Cost savings dampened earnings downturn<br />
Plummeting volumes and the resultant sharp<br />
drop in capacity utilization put considerable<br />
downside pressure on earnings. Moreover,<br />
the significant downturn in raw material<br />
prices, especially at the start of the year, led<br />
to impairment write-downs on inventories<br />
and thus reduced EBITDA. By contrast, rapid<br />
and highly disciplined action to safeguard<br />
earnings and liquidity alleviated the situation<br />
considerably. This principally involved<br />
stringent management of net working capital,<br />
postponing investment plans and substantial<br />
cost savings. Key measures included<br />
cutting staff bonuses, outsourcing and travel<br />
expenses, and introducing short-time working<br />
in response to the sharp cut-back in production.<br />
At the peak, up to 3,500 employees<br />
were affected by short-time working, but this<br />
was eliminated almost completely by year<br />
end thanks to the renewed rise in capacity<br />
utilization. Since demand started to pick up<br />
slightly in the summer and cost savings had<br />
an increasing effect, we were able to offset<br />
almost all of the 33 percent drop in EBITDA<br />
reported at the end of the first six months.<br />
At year end EBITDA was €1,602 million,<br />
down 1 percent year-on-year.<br />
Improved profitability<br />
The EBITDA margin advanced significantly<br />
to 16.1 percent. Cost-saving measures included<br />
the curtailment or postponement of capital<br />
expenditures. Investment in property, plant<br />
and equipment therefore dropped 31 percent<br />
to €502 million. That was well below depreciation,<br />
which amounted to €639 million.<br />
The average capital employed decreased<br />
by €406 million to €9,071 million thanks to<br />
the reduction in net working capital. ROCE<br />
therefore improved from 9.9 percent to<br />
10.3 percent.
Start Management report Consolidated financial statements Supplementary information<br />
Chemicals Business Area<br />
Our scientists are working on integrating renewable raw materials and<br />
biotechnological processes into industrial applications<br />
<strong>Evonik</strong> is examining carving out the<br />
carbon blacks business<br />
In January 2010 <strong>Evonik</strong>’s Executive Board<br />
agreed to explore the possibility of carving<br />
out of the carbon blacks business. Accordingly,<br />
various strategic options for the future<br />
development of these activities are currently<br />
being examined. The possible outcome is<br />
open and ranges from establishing the business<br />
on the market as an independent unit<br />
to finding a partner or divestment.<br />
At a glance<br />
Chemicals Business Area<br />
Global specialty chemicals operations<br />
Expertise<br />
<strong>Evonik</strong> supplies custom-tailored<br />
products and solutions<br />
Balanced structures<br />
None of our end-markets accounts for<br />
more than 20 percent of sales<br />
Profitable<br />
EBITDA margin increased to over<br />
16 percent<br />
Innovative<br />
Products, processes and applications<br />
developed in the past five years account<br />
for about 20 percent of sales<br />
<strong>Annual</strong> <strong>Report</strong> <strong>2009</strong> <strong>Evonik</strong> <strong>Industries</strong> 53
<strong>Evonik</strong> supplies the<br />
catalysts needed to<br />
produce biodiesel<br />
evonik.com/<br />
industrial-chemicals<br />
54<br />
Industrial Chemicals Business Unit<br />
<strong>Annual</strong> <strong>Report</strong> <strong>2009</strong> <strong>Evonik</strong> <strong>Industries</strong><br />
Industrial Chemicals<br />
The Industrial Chemicals Business Unit<br />
supplies products that customers in the<br />
agrochemicals, chemicals, plastics and paper<br />
industries use for high-quality end-use<br />
applications. The olefins, alcohols and ether<br />
produced in our unique integrated C4 production<br />
complexes are mainly used by the<br />
plastics industry and as fuel additives. <strong>Evonik</strong><br />
is the technology leader in the production of<br />
hydrogen peroxide and has a global network<br />
of production facilities to ensure optimum<br />
supply of this environment-friendly bleaching<br />
agent to its customers. This business<br />
unit is also the global market leader in catalysts<br />
for the production of biodiesel. The<br />
product spectrum is rounded out by substances<br />
for the agrochemicals, colorants and<br />
plastics industries.<br />
in € million <strong>2009</strong> 2008 Change in %<br />
External sales 1,956 2,737 −29<br />
EBITDA 242 363 −33<br />
EBIT 176 291 −40<br />
Sales and earnings down significantly<br />
year-on-year<br />
Following a very weak first half due to the<br />
global economic crisis, the second half<br />
brought a significant upturn in demand,<br />
especially for plasticizer alcohols, hydrogen<br />
peroxide, sodium methylates for the production<br />
of biodiesel, agrochemicals, and<br />
plastics additives. Overall, sales were<br />
€1,956 million, down 29 percent year-onyear.<br />
That was due in equal measure to lower<br />
volumes and declining prices. EBITDA<br />
dropped 33 percent to €242 million. The<br />
volume and price-driven drop in earnings<br />
was partially offset by effective cost-savings.<br />
In view of the sustained decline in demand,<br />
production was shut down at the sites in<br />
Münchsmünster (Germany) and Bussi (Italy).<br />
Investment in growth areas<br />
The Industrial Chemicals Business Unit<br />
increased its competence in process technology<br />
and catalysis and embarked on the<br />
commercial application of several important<br />
projects. In Marl (Germany), a 2-propylheptanol<br />
plant was successfully brought into<br />
service after a very short development and<br />
construction phase. As a result, <strong>Evonik</strong> is<br />
now Europe’s largest producer of highmolecular<br />
plasticizer alcohols. Despite the<br />
difficult economic situation, capacity at this<br />
facility was fully utilized from the start.<br />
The sodium methylate facility in Mobile<br />
(Alabama, USA), which came on stream in<br />
<strong>2009</strong> to accompany growth in the US bio fuels<br />
market, is also based on new technology.
Start Management report Consolidated financial statements Supplementary information<br />
Chemicals Business Area<br />
Inorganic Materials<br />
Core competencies in designing inorganic<br />
particles and their surface properties are<br />
the hallmarks of the Inorganic Materials<br />
Business Unit. It also operates integrated<br />
silicon-based facilities for the production<br />
of a unique range of chlorosilanes and<br />
organo-silanes. Its filler systems based on<br />
carbon blacks, precipitated silica and rubber<br />
silanes are mainly sold to customers in the<br />
rubber and tire industry. Pigments are supplied<br />
to the coatings, colorants and printing<br />
industries. Ultra-fine-particle fumed silica is<br />
used as an additive to improve the surface<br />
and properties of a wide range of materials.<br />
<strong>Evonik</strong>’s high-purity chlorosilanes are key<br />
components in the manufacture of optical<br />
fibers and polycrystalline silicon, which is in<br />
high demand for applications in the electronics<br />
and photovoltaics sectors.<br />
Considerable reduction in demand<br />
Sales shrank 18 percent to €1,803 million in<br />
<strong>2009</strong>, mainly due to lower volume sales. In<br />
the first half of the year, business suffered<br />
considerably from the crisis-related sharp<br />
drop in demand from the automotive and<br />
construction sectors (tires, silicones, adhesives<br />
and sealants, polyester, colorants and<br />
coatings), and the electronics sector. A perceptible<br />
recovery was registered during the<br />
second half of the year. This was supported<br />
by extensive global economic stimulus programs.<br />
By contrast, business with products<br />
for the growing photovoltaics market and<br />
the environmental sector was pleasing. The<br />
substantial overall drop in demand and the<br />
associated reduction in capacity utilization<br />
had a considerable impact on earnings.<br />
Thanks to successful action to reduce costs,<br />
EBITDA only declined by 29 percent to<br />
€222 million.<br />
Targeting tomorrow’s solar energy and<br />
electronics markets<br />
In fall <strong>2009</strong> <strong>Evonik</strong> and its partner Taiyo<br />
Nippon Sanso Corporation (TNSC) held the<br />
groundbreaking ceremony for a project<br />
focused on environment-friendly utilization<br />
of solar energy in the future. Construction<br />
of a combined production plant for monosilane<br />
and AEROSIL� fumed silica at a total<br />
cost of €150 million has started at Yokkaichi<br />
(Japan). This plant is scheduled to come<br />
on stream in 2011. The Inorganic Materials<br />
Business Unit has concluded a long-term<br />
agreement to supply monosilane to TNSC,<br />
a global gas distributor that has been supplying<br />
customers in the Asian electronics<br />
industry for many years. The new monosilane<br />
facility will enable Inorganic Materials<br />
to participate in the market for thin-layer<br />
photovoltaics, flat-screen displays and semiconductors,<br />
which is growing particularly<br />
fast in Asia.<br />
A new chlorosilanes facility being constructed<br />
in Merano (Italy) is scheduled to<br />
come on stream in 2011. This facility is integrated<br />
into a site operated by MEMC Electronic<br />
Materials Inc., one of the leading<br />
suppliers of electronic and solar wafers,<br />
with which we have a long-term supply<br />
agreement.<br />
<strong>Evonik</strong> has set up a joint venture with<br />
Taiwanese company Cristal Material Corporation<br />
to produce high-quality glass lenses<br />
for the next generation of light-emitting<br />
diodes (LEDs). Production is based on<br />
SiVARA sol-gel technology developed by<br />
Inorganic Materials. In view of their advantages,<br />
LEDs are increasingly being used in a<br />
wide range of lighting applications. Market<br />
growth of over 20 percent p.a. is forecast.<br />
Inorganic Materials Business Unit<br />
High-purity silicon:<br />
vital for the production<br />
of wafers<br />
evonik.com/<br />
inorganic-materials<br />
in € million <strong>2009</strong> 2008 Change in %<br />
External sales 1,803 2,208 −18<br />
EBITDA 222 315 −29<br />
EBIT 98 190 −49<br />
<strong>Annual</strong> <strong>Report</strong> <strong>2009</strong> <strong>Evonik</strong> <strong>Industries</strong> 55
<strong>Evonik</strong> is an established<br />
partner for producers of<br />
personal care and cleaning<br />
products<br />
evonik.com/<br />
consumer-specialties<br />
56<br />
Consumer Specialties Business Unit<br />
<strong>Annual</strong> <strong>Report</strong> <strong>2009</strong> <strong>Evonik</strong> <strong>Industries</strong><br />
Consumer Specialties<br />
The Consumer Specialties Business Unit<br />
supplies a wide range of innovative products<br />
to the consumer goods industry for use<br />
in personal care and hygiene products and<br />
cleaning agents. Its technology platforms<br />
and extensive expertise in interfacial chemistry<br />
are also used for certain industrial<br />
applications such as the production of polyurethanes<br />
and scratch-free polyolefins. Even<br />
small amounts of its custom-tailored substances<br />
and system solutions—especially<br />
surfactants produced from renewable raw<br />
materials and organically modified silicones,<br />
and superabsorbents produced from polyacrylic<br />
acid—give customers’ products the<br />
additional benefits that often clinch a sale.<br />
Strategic success factors include high innovative<br />
capability and intensive collaboration<br />
with leading manufacturers of consumer<br />
goods and industrial customers.<br />
Significant improvement in earnings<br />
Sales declined by 11 percent to €1,502 million.<br />
The downtrend was due to lower volume<br />
sales and price reductions induced by lower<br />
raw material costs. The Polyurethane Additives<br />
and Industrial Specialties Business Lines,<br />
which mainly serve industrial customers, got<br />
off to a weak start as a result of the economic<br />
crisis but made up much of the lost ground<br />
in € million <strong>2009</strong> 2008 Change in %<br />
External sales 1,502 1,682 −11<br />
EBITDA 192 144 34<br />
EBIT 125 81 56<br />
during the year. Products for the consumer<br />
segment, for example, cosmetics, detergents<br />
and hygiene articles, were hardly affected<br />
by the economic crisis but the general trend<br />
to cheaper products led to a slight drop in<br />
volume sales of high-quality ingredients.<br />
The optimization programs introduced in<br />
the previous year were implemented successfully.<br />
Earnings were lifted by withdrawing<br />
from unprofitable products and additional<br />
cost savings. This included the shutdown of<br />
production in Bussi (Italy). All business lines<br />
contributed to the 34 percent improvement<br />
in EBITDA to €192 million.<br />
Higher capacity in Asia<br />
Start-up of a new production facility at the<br />
Xinzhuang site in Shanghai (China) has<br />
greatly increased Consumer Specialties’<br />
production capacity for polyurethane additives.<br />
This state-of-the-art facility also permits<br />
the performance of additional process<br />
steps based on innovative processes. Highquality<br />
additives can now be supplied to<br />
China and other Asian countries from<br />
Shanghai and an even faster and more flexible<br />
response to regional customer requirements<br />
is possible. China is the fastest growing<br />
market for polyurethane materials,<br />
especially for the insulation of buildings and<br />
refrigerated equipment, as cushioning for<br />
furniture and mattresses, and for automotive<br />
applications.
Start Management report Consolidated financial statements Supplementary information<br />
Chemicals Business Area<br />
Health & Nutrition<br />
The Health & Nutrition Business Unit manufactures<br />
and markets essential amino acids<br />
for animal nutrition, active ingredients for<br />
the pharmaceuticals industry and catalysts.<br />
These have to meet top quality standards<br />
and registration requirements. Success factors<br />
include <strong>Evonik</strong>’s long-standing experience<br />
of organic synthesis, catalysis and<br />
biotechnology. <strong>Evonik</strong> is the world’s only<br />
producer of all four essential amino acids<br />
for healthy and environment-friendly animal<br />
nutrition. High-purity amino acids are also<br />
produced for the food, cosmetics and pharmaceuticals<br />
industries. This business unit<br />
often develops organic active ingredients<br />
and catalysts on an exclusive basis to meet<br />
the requirements of specific customers and<br />
markets.<br />
Further substantial hike in earnings<br />
Volume growth and higher prices lifted sales<br />
6 percent to €1,602 million. The 34 percent<br />
improvement in EBITDA to €602 million was<br />
driven principally by a favorable product<br />
mix and cost savings. Business with amino<br />
acids for animal nutrition has little cyclical<br />
exposure. Nevertheless, volumes dropped<br />
substantially at the start of the year due to<br />
destocking by customers. However, demand<br />
picked up considerably from June and was<br />
recently above the pre-recession level. We<br />
were able to meet this higher demand without<br />
difficulty thanks to expansion of our<br />
production capacity. The old methionine<br />
facility in Antwerp (Belgium), which was<br />
mothballed when the new facility came into<br />
operation in summer 2006, has been operating<br />
at full capacity again since fall <strong>2009</strong>.<br />
The Exclusive Synthesis Business Line benefited<br />
from the stability of the pharmaceuticals<br />
market. Only its specialty products for<br />
fine chemicals suffered a cyclical drop in<br />
demand. The Chinese authorities have withdrawn<br />
the production permit for the site in<br />
Dalian (China) until further notice following<br />
an explosion in the wastewater treatment<br />
facilities. The catalysts business was relatively<br />
stable.<br />
Health & Nutrition Business Unit<br />
in € million <strong>2009</strong> 2008 Change in %<br />
External sales 1,602 1,505 6<br />
EBITDA 602 450 34<br />
EBIT 533 369 45<br />
Action to raise capacity<br />
Health & Nutrition will be raising global<br />
production capacity for methionine in the<br />
next few years in response to high demand.<br />
A phased concept entailing coordinated<br />
expansion of capacity for methionine and<br />
the necessary raw materials will be implemented<br />
at the sites in Antwerp (Belgium),<br />
Wesseling (Germany) and Mobile (Alabama,<br />
USA) to raise capacity stepwise between<br />
2011 and 2013 to a total of 430,000 metric<br />
tons p.a. <strong>Evonik</strong> is thus responding to forecast<br />
growth in the world population, which<br />
will increase demand, especially for poultry.<br />
In addition, Exclusive Synthesis, which<br />
has previously had production facilities in<br />
Germany and China, has been placed on<br />
a broader basis. In January 2010 Health &<br />
Nutrition acquired the Tippecanoe site<br />
in Lafayette (Indiana, USA) with nearly<br />
650 employees from Eli Lilly and Company.<br />
Simultaneously, a contract was signed on the<br />
supply of pharmaceutical active ingredients<br />
and intermediates to Eli Lilly for several years.<br />
Exclusive synthesis of custom-tailored active<br />
ingredients and intermediates for the pharmaceuticals<br />
industry is a relatively non-cyclical<br />
business in an exceptionally high-growth<br />
market.<br />
Custom-tailored active<br />
ingredients for the<br />
pharmaceuticals industry<br />
evonik.com/<br />
health-nutrition<br />
<strong>Annual</strong> <strong>Report</strong> <strong>2009</strong> <strong>Evonik</strong> <strong>Industries</strong> 57
Specialties for coatings,<br />
lubricants and adhesives<br />
evonik.com/<br />
coatings-additives<br />
58<br />
Coatings & Additives Business Unit<br />
<strong>Annual</strong> <strong>Report</strong> <strong>2009</strong> <strong>Evonik</strong> <strong>Industries</strong><br />
Coatings & Additives<br />
The Coatings & Additives Business Unit<br />
produces functional polymers and highquality<br />
monomer specialties for the paints<br />
and coatings, adhesives and sealants industries.<br />
Its products are based on integrated<br />
production structures for methylmethacrylate,<br />
isophorone and silicone and are used<br />
in crosslinkers, resins, binders and colorant<br />
systems. Functional polymers are also used<br />
as high-quality oil additives to improve the<br />
flow properties of lubricants over a wide<br />
temperature range, thus improving engine<br />
performance and reducing fuel consumption.<br />
Pharmaceutical polymers ensure that<br />
active ingredients are released in the body<br />
at the right time and in the right place.<br />
in € million <strong>2009</strong> 2008 Change in %<br />
External sales 1,333 1,549 −14<br />
EBITDA 255 250 2<br />
EBIT 182 194 −6<br />
Cost savings mitigate lower volumes<br />
Business was adversely affected by a sharp<br />
drop in demand from the automotive, construction<br />
and coatings sectors, especially<br />
in the early part of the year. Sales volumes<br />
began to recover slowly from the second<br />
quarter and by September they were above<br />
the year-back level. The main driving forces<br />
came from Europe and Asia—supported by<br />
national economic stimulus programs. In<br />
North America demand remained unsatisfactory.<br />
Overall, sales contracted by 14 percent<br />
to €1,333 million. Thanks to rapid action<br />
to cut costs, the lower cost of some raw<br />
materials and rising capacity utilization at<br />
the new oil additives plant in Singapore, the<br />
massive drop in earnings in the first quarter<br />
was more than offset in the remainder of<br />
the year and by year end EBITDA was<br />
€255 million, a rise of 2 percent from the<br />
previous year.<br />
China as a growth market<br />
The Coatings & Additives Business Unit<br />
started up a new production facility for<br />
thermoplastic methacrylates in Shanghai<br />
(China), based on an innovative, environment-friendly<br />
process. This is <strong>Evonik</strong>’s first<br />
methacrylate resins facility outside Germany<br />
and enables it to offer customers in Asia<br />
even shorter procurement times and more<br />
reliable supply. Moreover, China is one of<br />
the most dynamic growth regions in the<br />
coatings industry. The main customers for<br />
binders are coatings producers for the marine<br />
and container industry. As an integral part<br />
of the MATCH (Methacrylates to China)<br />
project in Shanghai Chemical Industry Park,<br />
the new polymers plant benefits from reliable<br />
supply of monomers from upstream<br />
plants.
Start Management report Consolidated financial statements Supplementary information<br />
Chemicals Business Area<br />
Performance Polymers<br />
The Performance Polymers Business Unit<br />
manufactures a wide range of advanced<br />
materials and its applications technology<br />
expertise is highly valued on the market.<br />
The heart of its business comprises methylmethacrylate<br />
chemistry and integrated<br />
production facilities for polyamide 12. This<br />
business unit also produces special highperformance<br />
materials based on transparent<br />
specialty polyamides, polyetherether ketone<br />
(PEEK) and polyimides (PI). Its polymers<br />
and semi-finished products are used in<br />
structural components, primarily for consumer<br />
durables and long-lasting capital<br />
goods. Focal areas of application are the<br />
automotive and construction sectors and<br />
a large number of high-end applications<br />
for aircraft construction, displays and lifestyle<br />
products. Standard and specialty<br />
monomers and molding compounds are<br />
marketed to the plastics, adhesives and<br />
colorants industries.<br />
Lower earnings<br />
The economic crisis had a major impact on<br />
this business unit’s performance. Demand<br />
from the automotive and construction<br />
industries nosedived, especially in the first<br />
half of the year. Business started to recover<br />
slightly from June, driven by high demand<br />
for polymethylmethacrylate (PMMA) molding<br />
compounds for flat-screen displays and<br />
specialty applications for high-performance<br />
polymers. Overall, sales slipped 20 percent<br />
to €1,116 million, especially in the wake of<br />
declining volumes and a slight reduction in<br />
prices. EBITDA slipped 46 percent year-onyear<br />
to €61 million. The substantial downturn<br />
caused by the sharp drop in volumes at<br />
the start of the year was partially offset by<br />
prompt cost-saving measures.<br />
Major investment successfully<br />
completed<br />
The production plant for methylmethacrylates<br />
(MMA), the heart of the MATCH<br />
complex, was successfully brought into service<br />
by Performance Polymers in Shanghai<br />
Chemical Industry Park only two years after<br />
construction started. <strong>Evonik</strong> now has a<br />
world-scale MMA plant with annual capacity<br />
of 100,000 metric tons in Asia, underscoring<br />
its position as the leading global supplier of<br />
MMA specialties. This is the first plant producing<br />
MMA using the C4 process, which<br />
increases flexibility in the use of raw materials<br />
and reduces production costs. Since mid-<br />
October <strong>2009</strong> this new MMA facility has<br />
supplied to the downstream facilities that<br />
came into operation some months previously,<br />
so the complete MATCH complex is now<br />
operating. Almost all products in the methacrylate<br />
production chain are produced here<br />
across business unit boundaries: basic monomers,<br />
specialty monomers and crosslinkers,<br />
PMMA molding compounds and thermoplastic<br />
methacrylate resins. Through this new<br />
integrated facility, <strong>Evonik</strong> is participating in<br />
the growth of the MMA market in Asia.<br />
Performance Polymers Business Unit<br />
<strong>Evonik</strong> supplies high-<br />
performance materials for<br />
automobiles, airplanes and<br />
displays<br />
evonik.com/<br />
performance-polymers<br />
in € million <strong>2009</strong> 2008 Change in %<br />
External sales 1,116 1,397 −20<br />
EBITDA 61 112 −46<br />
EBIT −19 43 −<br />
<strong>Annual</strong> <strong>Report</strong> <strong>2009</strong> <strong>Evonik</strong> <strong>Industries</strong> 59
60<br />
<strong>Annual</strong> <strong>Report</strong> <strong>2009</strong> <strong>Evonik</strong> <strong>Industries</strong>
Start Management report Consolidated financial statements Supplementary information<br />
Energy Business Area<br />
Energy Business Area<br />
<strong>Evonik</strong>’s power and heat generation business<br />
and services for power stations are grouped<br />
in the Energy Business Area. Its core competencies<br />
include planning, financing, building<br />
and operating highly efficient fossil-fuel<br />
power plants. As a grid-independent power<br />
generator, <strong>Evonik</strong> operates coal-fired power<br />
plants at eight sites in Germany, refinery<br />
power plants at two locations and a variety<br />
of facilities to generate energy from renewable<br />
resources. This business area’s international<br />
successes comprise coal-fired power<br />
plants in Colombia, Turkey and the Philippines.<br />
In each of these countries it works<br />
closely with local partners. Total installed<br />
Energy Business Area: Key data<br />
power is around 9,400 Megawatts (MW)<br />
worldwide, including around 7,700 MW in<br />
Germany. Long-term supply and offtake<br />
agreements with key customers ensure a<br />
sustained return on investment and essentially<br />
stable revenues. <strong>Evonik</strong> is well-positioned<br />
in the high-growth future market<br />
for renewable energies and is one of the<br />
German market leaders in the generation of<br />
electricity and heat from mine gas, biomass<br />
and geothermal energy. Its globally aligned<br />
engineering services also deepen its countryspecific<br />
insight into the energy market,<br />
enabling it to develop new business ideas<br />
for power plant projects.<br />
in € million <strong>2009</strong> 20081) Change in %<br />
External sales 2,558 3,399 −25<br />
EBITDA 418 517 −19<br />
EBIT 326 415 −21<br />
Capital expenditures2) 280 328 −15<br />
Depreciation and amortization2) 86 89 −3<br />
Capital employed (annual average) 3,355 3,152 6<br />
ROCE in % 9.7 13.2<br />
EBITDA margin in % 16.3 15.2<br />
Employees 4,820 4,702 3<br />
1) Prior-year figures restated to reflect reversal of transfer of 50 percent stake in Infracor.<br />
See Note (9.1) to the consolidated financial statements.<br />
2) For intangible assets, property, plant and equipment and investment property.<br />
evonik.com/energy<br />
<strong>Annual</strong> <strong>Report</strong> <strong>2009</strong> <strong>Evonik</strong> <strong>Industries</strong> 61
62<br />
External sales by business line<br />
<strong>Annual</strong> <strong>Report</strong> <strong>2009</strong> <strong>Evonik</strong> <strong>Industries</strong><br />
Earnings down year-on-year<br />
Sales declined 25 percent to €2,558 million.<br />
This was principally caused by a considerable<br />
reduction in the price of hard coal, which<br />
had rallied to a peak of around US$210 per<br />
metric ton in July 2008, before dropping<br />
back to around US$80 per metric ton by the<br />
end of 2008. In <strong>2009</strong>, the price fluctuated<br />
between US$62 and US$81 per metric ton.<br />
The fluctuations in the global price of coal<br />
in 2008 impacted the sales reported by the<br />
Energy Business Area with a time lag because<br />
of the contractually agreed coal price index.<br />
Sales were also clipped by lower trading<br />
volumes in the Coal Business Line (formerly<br />
Trading) and lower utilization of power plants<br />
in response to reduced demand from customers.<br />
EBITDA declined by 19 percent to<br />
€418 million, chiefly due to impairment losses<br />
in € million <strong>2009</strong> 2008 Change in %<br />
Power 1,312 1,671 −22<br />
Renewable Energies 215 246 −12<br />
Coal 748 1,205 −38<br />
Other 283 277 2<br />
Energy 2,558 3,399 −25<br />
Volume sales<br />
<strong>2009</strong> 2008 Change in %<br />
Power GWh 35,720 39,492 −10<br />
Renewable Energies (heat)<br />
GWhth 2,115 2,038 4<br />
Renewable Energies (power)<br />
GWhel 1,592 1,883 −15<br />
Coal million metric tons coal 27.2 35.7 −24<br />
Volume sales of energy comprise electric power and thermal energy. Thermal energy is<br />
converted into the equivalent amount of electric power.<br />
on inventories in the Coal Business Line.<br />
By contrast, systematic and successful costsaving<br />
measures boosted the EBITDA margin<br />
to 16.3 percent.<br />
Strengthening our power plant base<br />
Investment totaled €280 million, well above<br />
depreciation, which amounted to €86 million.<br />
Capital expenditures focused on construction<br />
of the Walsum 10 power plant.<br />
Average capital employed therefore increased<br />
to €3,355 million. ROCE slipped substantially<br />
to 9.7 percent due to the decline in earnings<br />
and simultaneous rise in average capital<br />
employed.<br />
Systematic cost management reduced<br />
earnings decline<br />
In the Power Business Line sales dropped<br />
22 percent year-on-year to €1,312 million as a<br />
result of considerably lower coal prices and<br />
a sharp drop in volume sales of energy.<br />
This effect also reduced marginal income<br />
at power plants in Germany and abroad.<br />
This was counteracted to some extent by<br />
cost savings. In all, EBITDA was considerably<br />
lower.<br />
Sales contracted 12 percent to €215 million<br />
in the Renewable Energies Business Line,<br />
while EBITDA was unchanged year-on-year.<br />
Lower earnings from declining volumes of<br />
mine gas were offset by disciplined costsavings.<br />
Energy generation from renewable<br />
resources contributes to the energy mix and<br />
reduces climate impact. In view of the very<br />
good perspectives for the development of<br />
the Renewable Energies Business Line, further<br />
national and international options to<br />
strengthen it are currently being examined.
Start Management report Consolidated financial statements Supplementary information<br />
Energy Business Area<br />
The Coal Business Line mainly markets coal<br />
for power stations, thus securing the supply<br />
of German and imported coal for power<br />
stations operated by the company and<br />
third parties. Sales plunged 38 percent to<br />
€748 million owing to far lower coal prices<br />
and declining trading volumes. The massive<br />
drop in the price of coal accompanied by a<br />
substantial short-term reduction in demand<br />
from major customers in the first half of<br />
<strong>2009</strong> led to considerable impairment writedowns<br />
on coal inventories in the first half of<br />
<strong>2009</strong>. EBITDA slipped to minus €38 million,<br />
having been around break-even point in the<br />
previous year.<br />
Power for the future<br />
Erection of the innovative 790 MW coalfired<br />
power plant in Duisburg-Walsum<br />
(Germany), involving total investment of<br />
€820 million, is nearing completion. As a<br />
facility to provide Clean Competitive Electricity<br />
from Coal (CCEC), Walsum 10 integrates<br />
many site-specific features and innovations.<br />
Its higher efficiency means that at<br />
full load it requires around 20 percent less<br />
hard coal and emits around 20 percent less<br />
CO2 than comparable hard-coal power plants.<br />
Net efficiency of the new power plant is<br />
more than 45 percent, five percentage points<br />
above other modern hard-coal power plants<br />
in Germany and more than 15 percent higher<br />
than the average for German hard-coal<br />
power plants. This is achieved through<br />
modern engineering materials, which allow<br />
higher temperatures and pressure in the<br />
boiler. In addition, energy consumption by<br />
the plant itself is reduced by a large number<br />
of individual measures. The most complex<br />
individual component in the plant is the<br />
roughly 106 meter high steam boiler. During<br />
the pressure test in summer <strong>2009</strong>, the TÜV<br />
Nord permitting authority officially certified<br />
that the boiler withstands exposure to high<br />
pressure.<br />
The first phase of the new AYAS power plant<br />
project in Iskenderun (Turkey) was initiated<br />
in <strong>2009</strong>: Having obtained a power generating<br />
license and environmental permit, construction<br />
work began in early 2010. The planned<br />
new 625 MW hard-coal power plant will be<br />
built by Ayas Enerji Üretim ve Ticaret A.S.,<br />
a project company in which <strong>Evonik</strong> Steag<br />
GmbH has a 51 percent stake and the Turkish<br />
pension fund Ordu Yardimlasma Kurumu<br />
(OYAK) holds 49 percent. <strong>Evonik</strong> already<br />
operates a 1,320 MW hard-coal power plant<br />
close to AYAS through its project company<br />
ISKEN, in which OYAK also has a 49 percent<br />
stake.<br />
At a glance<br />
Energy Business Area<br />
Power and heat generation and related<br />
services<br />
International successes<br />
Coal-fired power plants in Colombia,<br />
Turkey and the Philippines<br />
Technological edge<br />
Walsum 10, Europe’s most advanced<br />
power plant, will come into service<br />
in 2010<br />
Well-positioned<br />
German market leader in heat and<br />
power generation from mine gas,<br />
biomass and geothermal energy<br />
Powerful<br />
Total installed capacity worldwide is<br />
around 9,400 MW<br />
Energy for the future:<br />
generating power from<br />
renewable resources<br />
<strong>Annual</strong> <strong>Report</strong> <strong>2009</strong> <strong>Evonik</strong> <strong>Industries</strong> 63
64<br />
<strong>Annual</strong> <strong>Report</strong> <strong>2009</strong> <strong>Evonik</strong> <strong>Industries</strong>
Start Management report Consolidated financial statements Supplementary information<br />
Real Estate Business Area<br />
Real Estate Business Area<br />
The Real Estate Business Area manages a<br />
portfolio of around 60,000 company-owned<br />
residential units concentrated in the federal<br />
state of North Rhine-Westphalia (NRW) in<br />
Germany. It also has a 50 percent stake in<br />
THS, which owns more than 70,000 residential<br />
units. These are also located predominantly<br />
in the federal state of NRW. <strong>Evonik</strong><br />
is thus one of Germany’s leading privately<br />
owned residential real estate companies.<br />
Business focuses on letting homes to private<br />
households, which essentially generates<br />
regular and stable cash flows.<br />
In addition, active portfolio management<br />
involving the selective sale and purchase of<br />
residential units is used. The business model<br />
is rounded out by property development<br />
activities on company-owned land to upgrade<br />
the portfolio.<br />
This business area’s regional focus is the<br />
key to outstanding market insight and brings<br />
considerable advantages in the management<br />
of the housing stock.<br />
Real Estate Business Area: Key data<br />
Another good result<br />
Sales were unchanged year-on-year at<br />
€378 million. EBITDA slipped to €183 million,<br />
a drop of 16 percent from the yearback<br />
figure, which was boosted by one-off<br />
income from the divestment of commercial<br />
real estate. As a result of the drop in earnings,<br />
the EBITDA margin declined to 48.4 percent.<br />
Capital expenditures amounted to €57 million,<br />
below the year-back figure of €87 million.<br />
Investment focused on modernizing<br />
energy supply to residential units and further<br />
portfolio improvements through new<br />
construction. Average capital employed<br />
increased to €1,843 million, mainly because<br />
of capital expenditures and higher deferred<br />
tax assets. ROCE dropped to 7.3 percent.<br />
in € million <strong>2009</strong> 2008 Change in %<br />
External sales 378 375 1<br />
EBITDA 183 217 −16<br />
EBIT 135 162 −17<br />
Capital expenditures1) 57 87 −34<br />
Depreciation and amortization1) 45 44 2<br />
Capital employed (annual average) 1,843 1,762 5<br />
ROCE in % 7.3 9.2<br />
EBITDA margin in % 48.4 57.9<br />
Employees 479 443 8<br />
1) For intangible assets, property, plant and equipment and investment property.<br />
evonik.com/<br />
real-estate<br />
<strong>Annual</strong> <strong>Report</strong> <strong>2009</strong> <strong>Evonik</strong> <strong>Industries</strong> 65
Modern lifestyles: familyfriendly<br />
residential areas that<br />
utilize energy efficiently<br />
66<br />
<strong>Annual</strong> <strong>Report</strong> <strong>2009</strong> <strong>Evonik</strong> <strong>Industries</strong><br />
Focus on a sustained improvement in value<br />
Management of the property portfolio is<br />
based on sustainable criteria, giving high<br />
priority to continual maintenance and measures<br />
to raise value by optimizing energy<br />
efficiency. Earnings fell short of the previous<br />
year’s level as a result of rental income<br />
lost due to divestment of commercial property<br />
and a slight rise in net maintenance<br />
expense (€11.79 per square meter in <strong>2009</strong><br />
compared with €11.54 in 2008). The average<br />
net rent excluding utility charges increased<br />
significantly from €4.34 per square meter<br />
in the previous year to €4.47 per square<br />
meter. With a demand-driven vacancy rate<br />
of 2.4 percent, the rental situation is good<br />
by sector standards.<br />
Careful analysis of the entire housing<br />
stock is regularly undertaken for portfolio<br />
management purposes. Key criteria are the<br />
attractiveness of locations, the quality of<br />
the residential units and suitability for costefficient<br />
operation. The objective is to<br />
expand the portfolio in areas with good<br />
economic prospects. At the same time, the<br />
aim is to identify and sell off properties in<br />
unattractive locations and those requiring<br />
extensive modernization. In <strong>2009</strong>, the focus<br />
of sales activities was switched from portfolio<br />
to individual sales. Portfolio management<br />
earnings were therefore below the high<br />
level reported in 2008, which was boosted<br />
by one-off income from the divestment of<br />
commercial property.<br />
The property development activities,<br />
which are run as a complement to the property<br />
management business, focus on construction<br />
projects on company-owned sites.<br />
123 new residential units were handed over<br />
and earnings were on a par with the previous<br />
year.<br />
The result for THS, which is recognized<br />
at equity, increased to €36 million.<br />
Successful multi-generational project<br />
The multi-generational reference project<br />
initiated by <strong>Evonik</strong> as the basis for a new<br />
community-based lifestyle is proving very<br />
successful. The first construction phase<br />
comprising 37 accessible rented apartments,<br />
principally for senior citizens, was completed<br />
in <strong>2009</strong> and let within a very short<br />
time. The next two construction phases<br />
comprise further high-comfort apartments<br />
and houses, providing a differentiated offering<br />
for families, young couples and singles.<br />
The multi-generational complex will comprise<br />
a total of 90 rented apartments and<br />
eleven owner-occupied houses. The project<br />
gives tenants a home for all phases of their<br />
lives and ensures that <strong>Evonik</strong>’s property will<br />
be lettable for a long time in the future.<br />
At a glance<br />
Real Estate Business Area<br />
Letting residential units, mainly to<br />
private households<br />
Focused<br />
Around 60,000 residential units, mainly<br />
in North Rhine-Westphalia<br />
A sound investment<br />
50 percent stake in THS, which has<br />
more than 70,000 residential units,<br />
mainly in North Rhine-Westphalia<br />
Advantage<br />
Excellent market insight brings advantages<br />
in the management of <strong>Evonik</strong>’s<br />
housing portfolio<br />
Market leadership<br />
One of Germany’s leading privately<br />
owned residential real estate companies
Start Management report Consolidated financial statements Supplementary information<br />
Regional development<br />
Regional development<br />
Sales by region¹⁾<br />
Other<br />
2%<br />
Asia<br />
19%<br />
Central and<br />
South America<br />
4%<br />
North America<br />
14%<br />
¹⁾ By point of sale.<br />
Germany<br />
37%<br />
Other European<br />
countries<br />
24%<br />
A global presence<br />
In <strong>2009</strong>, as in the past, more than 60 percent<br />
of sales were generated outside Germany.<br />
Sales in Germany shrank 24 percent to<br />
€4,806 million, mainly due to the cyclical<br />
drop in demand and a sharp decline in coal<br />
prices. Capital expenditures were €568 million.<br />
Construction of our 790 MW hard-coal<br />
power plant in Duisburg-Walsum (Germany)<br />
is nearing completion. Start-up of a new<br />
60,000 metric ton production facility for the<br />
plasticizer alcohol 2-propylheptanol (2-PH)<br />
in Marl (Germany) has broadened our range<br />
of high-molecular plasticizer alcohols and<br />
our leading market position and technological<br />
edge in C4 chemicals. Together with our<br />
strategic partner Daimler <strong>AG</strong>, we are preparing<br />
to start serial production of lithiumion<br />
battery cells for automotive applications<br />
based on our CERIO� technology in Kamenz<br />
(Dresden, Germany) from 2011.<br />
Sales in the other European countries<br />
declined 16 percent to €3,150 million but<br />
this region’s share of total sales increased<br />
by 1 percentage point to 24 percent. Capital<br />
expenditures in this region amounted to<br />
€80 million. In Merano (Italy) we are building<br />
a new over-the-fence facility to supply<br />
chlorosilanes for the production of electronic<br />
and solar wafers for the US company<br />
MEMC Electronic Materials. Integrating the<br />
oil additives business acquired from methacrylates<br />
producer DOS at the start of <strong>2009</strong><br />
has been completed and has strengthened<br />
our position in Russia. Together with the<br />
Russian company Sibur, we are examining<br />
the possibility of building a propylene oxide<br />
facility in conjunction with a hydrogen peroxide<br />
plant for the Russian Federation.<br />
Expansion of business in North America<br />
Sales in North America fell 18 percent to<br />
€1,897 million, mainly due to the cyclical<br />
downturn. This region’s share of total sales<br />
remained unchanged at 14 percent and capital<br />
expenditures were €41 million. <strong>Evonik</strong><br />
has further increased its presence on the<br />
attractive North American market. At our<br />
site in Mobile (Alabama, USA), we started<br />
up a 60,000 metric ton facility to produce<br />
sodium methylate for biodiesel. We also<br />
embarked on the next step in expansion<br />
of exclusive synthesis of custom-tailored<br />
active ingredients and intermediates for the<br />
pharmaceuticals industry by acquiring the<br />
Tippecanoe site in Lafayette (Indiana, USA)<br />
from the US pharmaceuticals company Eli Lilly<br />
and Company in January 2010. In parallel with<br />
this a contract was concluded on the supply<br />
of pharmaceutical active ingredients and<br />
intermediates to Eli Lilly for several years.<br />
In Central and South America <strong>Evonik</strong>’s<br />
sales totaled €535 million, which was<br />
9 percent lower than in 2008. This region<br />
accounted for an unchanged 4 percent of<br />
total sales. Capital expenditures were €3 million<br />
and we are planning to build production<br />
capacity for sodium methylate for biodiesel<br />
for the South American market.<br />
<strong>Annual</strong> <strong>Report</strong> <strong>2009</strong> <strong>Evonik</strong> <strong>Industries</strong> 67
68<br />
<strong>Annual</strong> <strong>Report</strong> <strong>2009</strong> <strong>Evonik</strong> <strong>Industries</strong><br />
Strong commitment to the high-growth<br />
Asian region<br />
Sales in Asia contracted by 8 percent to<br />
€2,452 million. This region’s share of total<br />
sales increased by 2 percentage points to<br />
19 percent. Capital expenditures were<br />
€151 million. In the past three years we<br />
have invested almost half a billion euros in<br />
Asia. That reflects the special strategic significance<br />
that we attach to this high-growth<br />
region. Our large integrated production<br />
complex for specialty polymers, preproducts<br />
for plastics and coating systems (MATCH)<br />
came on stream in Shanghai (China) in <strong>2009</strong>.<br />
<strong>Evonik</strong> set up a joint venture with Taiwanese<br />
company Cristal Material Corporation to<br />
<strong>Evonik</strong> <strong>Industries</strong> <strong>AG</strong>, Essen (Germany) is<br />
the parent company of the <strong>Evonik</strong> Group.<br />
It holds direct and indirect stakes in all<br />
subsidiaries in the Group. R<strong>AG</strong>-Stiftung<br />
holds 74.99 percent of the shares in <strong>Evonik</strong><br />
<strong>Industries</strong> <strong>AG</strong>.<br />
produce high-quality glass lenses for the<br />
next generation of light-emitting diodes.<br />
Investment of €150 million at Yokkaichi<br />
(Japan) is focused on tomorrow’s markets<br />
for solar energy and electronics. Construction<br />
of a combined production facility for<br />
monosilane and AEROSIL� fumed silica has<br />
started at this site and is scheduled to come<br />
into service in 2011.<br />
We plan to extend our successful activities<br />
in the international energy sector. Alongside<br />
the Iskenderun power plant in Turkey,<br />
we operate power plants in Paipa (Colombia)<br />
and Mindanao (Philippines) and intend to<br />
build another 625 MW hard-coal power<br />
plant in Iskenderun.<br />
Performance of <strong>Evonik</strong> <strong>Industries</strong> <strong>AG</strong><br />
Income statement for <strong>Evonik</strong> <strong>Industries</strong> <strong>AG</strong><br />
The annual financial statements for <strong>Evonik</strong><br />
<strong>Industries</strong> <strong>AG</strong> have been prepared in accordance<br />
with the accounting standards set out<br />
in the German Commercial Code (HGB) and<br />
the German Stock Corporation Act (AktG).<br />
in € million <strong>2009</strong> 2008<br />
Sales 220 220<br />
Other operating income 774 1,267<br />
Personnel expense −47 −101<br />
Depreciation of property, plant and equipment, amortization of intangible assets −2 −2<br />
Depreciation of current assets −11 0<br />
Other operating expenses −749 −1,163<br />
Operating result 185 221<br />
Net interest expense −59 −205<br />
Dividends and similar income 620 308<br />
Income before taxes 746 324<br />
Income taxes −42 −16<br />
Net income 704 308<br />
Allocation to revenue reserves 0 −28<br />
Net profit 704 280
Start Management report Consolidated financial statements Supplementary information<br />
Performance of <strong>Evonik</strong> <strong>Industries</strong> <strong>AG</strong><br />
Since January 1, 2008 <strong>Evonik</strong> <strong>Industries</strong> <strong>AG</strong><br />
has charged its subsidiaries for services rendered.<br />
These expenses amounted to €220<br />
million in <strong>2009</strong> and are reflected in sales.<br />
The other operating income of €774 million<br />
includes costs of €259 million passed through<br />
to other companies in the Group. €222 million<br />
of this comprised general allocations of<br />
Group costs while €36 million comprised<br />
project expenses, rental costs and the cost<br />
of IT licenses. In the gross view, currency<br />
translation gains (€460 million) are included<br />
in other operating income and the corresponding<br />
expenses (€484 million) are<br />
included in other operating expenses. The<br />
net effect is an expense of €24 million. Personnel<br />
expense was €47 million, well below<br />
the year-back figure of €101 million, which<br />
included payments to members of the Executive<br />
Board under severance agreements,<br />
provisions for personnel expenses relating<br />
to the restructuring of the Group and performance-based<br />
payments in connection<br />
Balance sheet for <strong>Evonik</strong> <strong>Industries</strong> <strong>AG</strong><br />
with strategic corporate projects. Personnel<br />
expense for <strong>2009</strong> was also reduced by the<br />
agreement to cut variable pay.<br />
The net interest expense of €59 million<br />
resulted principally from borrowing for the<br />
company’s financing activities for the Group.<br />
This item also contains interest income and<br />
expense from the Group-wide cash pool,<br />
which is concentrated at <strong>Evonik</strong> <strong>Industries</strong><br />
<strong>AG</strong>. Income from subsidiaries increased<br />
from €308 million in 2008 to €620 million<br />
in <strong>2009</strong>, principally due to a one-off payment<br />
by <strong>Evonik</strong> Immobilien GmbH and an<br />
increase in the profit transferred by <strong>Evonik</strong><br />
Degussa GmbH. Income before taxes therefore<br />
improved 130 percent to €746 million.<br />
After deducting income taxes, net income<br />
was €704 million. The Executive Board will<br />
propose to the <strong>Annual</strong> Shareholders’ Meeting<br />
that the net profit of €320 million should<br />
be used to pay a dividend to the company’s<br />
shareholders.<br />
in € million Dec. 31, <strong>2009</strong> Dec. 31, 2008<br />
Assets<br />
Intangible assets, property, plant and equipment 7 7<br />
Financial assets 9,274 9,140<br />
Non-current assets 9,281 9,147<br />
Receivables and other assets 2,497 3,096<br />
Securities 6 0<br />
Cash and cash equivalents 444 199<br />
Current assets 2,947 3,295<br />
Prepaid expenses and deferred charges 3 3<br />
Total assets 12,231 12,445<br />
Equity and liabilities<br />
Issued capital 466 466<br />
Capital reserve 720 720<br />
Revenue reserves 3,371 3,371<br />
Net profit 704 280<br />
Equity 5,261 4,837<br />
Provisions 240 209<br />
Liabilities 6,730 7,399<br />
Total equity and liabilities 12,231 12,445<br />
<strong>Annual</strong> <strong>Report</strong> <strong>2009</strong> <strong>Evonik</strong> <strong>Industries</strong> 69
70<br />
<strong>Annual</strong> <strong>Report</strong> <strong>2009</strong> <strong>Evonik</strong> <strong>Industries</strong><br />
<strong>Evonik</strong> <strong>Industries</strong> <strong>AG</strong>’s total assets decreased<br />
slightly to €12.2 billion. Financial assets mainly<br />
comprise shares in the parent companies of<br />
the three business areas. The receivables and<br />
liabilities reflect the financing activities of<br />
<strong>Evonik</strong> <strong>Industries</strong> <strong>AG</strong> in its role as the holding<br />
company for the Group. Equity increased<br />
by €0.4 billion to €5.3 billion as net profit<br />
was far higher. The equity ratio improved<br />
from 38.9 percent to 42.9 percent. Payables<br />
include financial liabilities of €6.7 billion,<br />
including €5.7 billion due to affiliated companies,<br />
mainly in connection with cash pooling<br />
activities. A further €750 million relates to<br />
the corporate bond issued in October <strong>2009</strong>.<br />
Corporate responsibility<br />
We define corporate responsibility (CR) as<br />
how we conduct our business and how we<br />
live up to our values. That is detailed by the<br />
three dimensions of our CR Strategy: the<br />
business, employees and processes. In <strong>2009</strong><br />
we continued to respond to the growing<br />
significance of CR for the Group. The Global<br />
Social Policy adopted in the summer sets<br />
out binding global working and social standards<br />
for the <strong>Evonik</strong> Group and requires<br />
employees to treat one another with respect.<br />
Concurrently with this, we joined the UN<br />
Global Compact, underscoring our commitment<br />
to responsible conduct.<br />
<strong>Evonik</strong>’s Executive Board bears overall<br />
responsibility for CR. A CR management<br />
policy defines the structures and workflows<br />
The counter-item comprises financial receivables<br />
of €2.4 billion due from affiliated<br />
companies.<br />
A report on relations with affiliated companies<br />
has been prepared in accordance with<br />
Section 312 of the German Stock Corporation<br />
Act (AktG). It concludes with the following<br />
declaration: “Our company received<br />
adequate remuneration or compensation<br />
for each of the transactions set out in this<br />
report on relations with affiliated companies<br />
under the circumstances known to us at the<br />
time when the transactions were undertaken.<br />
No actions were performed or omitted at<br />
the instigation of such companies.”<br />
for CR work throughout the Group. In 2010<br />
work will initially focus on drawing up a<br />
target-based performance-management<br />
process for CR in consultation with the business<br />
units. The next step will be to increase<br />
dialogue with key stakeholders. Another<br />
central focus will be drafting a climate strategy<br />
for the <strong>Evonik</strong> Group, including evaluating<br />
climate-related aspects and integrating<br />
them into corporate decision-making processes.<br />
A project to incorporate CR into<br />
vocational training is currently at the development<br />
and test phase and should be completed<br />
by fall 2010. During the year, we will<br />
be setting up a special platform in the<br />
intranet to raise CR awareness and motivation<br />
among the workforce.
Start Management report Consolidated financial statements Supplementary information<br />
Employees<br />
Corporate responsibility<br />
Combined strength—Joining forces to pull<br />
through the crisis<br />
Given the impact of the financial and economic<br />
crisis, human resources work in <strong>2009</strong><br />
was particularly challenging. Rapid action<br />
was required to reduce personnel expense<br />
while continuing human resources activities<br />
geared to securing the future of the company.<br />
The areas of personnel work outlined<br />
below show how we managed to achieve a<br />
balance between these aspects.<br />
Reducing personnel expense in a time<br />
of crisis—A shared responsibility<br />
As part of the program introduced in early<br />
<strong>2009</strong> to safeguard earnings, in March <strong>2009</strong><br />
the Executive Board, Combined Works<br />
Council, Senior Staff Committee, and the<br />
German trade union IG BCE agreed on<br />
measures to reduce personnel expense at<br />
all consolidated companies in Germany.<br />
The action agreed for <strong>2009</strong> included a pay<br />
freeze for Group executives and a 50 percent<br />
cut in bonuses and similar payments<br />
for all company employees, including the<br />
members of the Executive Board. In return,<br />
<strong>Evonik</strong> gave an undertaking to avoid redundancies<br />
in the period to June 30, 2010.<br />
Together with various other measures that<br />
had already been introduced (for example,<br />
short-time working and reducing work-time<br />
credit balances and vacation accounts), these<br />
agreements provided an important basis for<br />
reducing personnel costs by around €100 million<br />
in <strong>2009</strong> in order to protect employment<br />
in the longer term. At the same time, action<br />
was taken to ensure that foreign companies<br />
also made a contribution. Thanks to the<br />
improved earnings situation in the second<br />
half of <strong>2009</strong>, the cut in bonus payments was<br />
reduced from 50 percent to 25 percent. At the<br />
same time, the possibility of reducing bonus<br />
payments by 25 percent in 2010 was agreed.<br />
Economic crisis—Activities to stabilize<br />
the situation<br />
Personnel levels had to be adjusted in <strong>2009</strong><br />
in response to low capacity utilization at<br />
production sites operated by the Chemicals<br />
Business Area. Short-time working was<br />
introduced at many German sites in January<br />
<strong>2009</strong>. At the peak of the crisis, up to 3,500<br />
employees were affected, but this had<br />
been reduced to around 300 by the end of<br />
December <strong>2009</strong> thanks to a slight economic<br />
recovery. At some sites, the time in which<br />
employees were not working was actively<br />
used to upgrade skills under the <strong>Evonik</strong><br />
training drive, which supports self-learning<br />
by employees throughout their working<br />
lives.<br />
Demographic analysis—Planning for<br />
the future<br />
<strong>Evonik</strong> is developing and applying effective<br />
concepts to deal with demographic change.<br />
Anchoring this in all relevant human resources<br />
processes and topics is a key element of our<br />
human resources strategy. For more than<br />
two years, <strong>Evonik</strong> has been using scenariobased<br />
models for strategic human resources<br />
At a glance<br />
Lower personnel expenses<br />
Concerted action by management and<br />
employee representatives<br />
Short-time working<br />
Up to 3,500 employees affected in<br />
Germany in <strong>2009</strong><br />
Looking ahead<br />
Strategic HR planning analyzes longterm<br />
age structures, capacity risks and<br />
training requirements<br />
Family-friendly<br />
Hertie Foundation endorses <strong>Evonik</strong>’s<br />
family-oriented policies<br />
Responsibility<br />
Trainees account for 9 percent of the<br />
German workforce<br />
Tomorrow’s managers<br />
Talent and succession management<br />
optimize advancement to key positions<br />
<strong>Annual</strong> <strong>Report</strong> <strong>2009</strong> <strong>Evonik</strong> <strong>Industries</strong> 71
evonik.com/career<br />
72<br />
<strong>Annual</strong> <strong>Report</strong> <strong>2009</strong> <strong>Evonik</strong> <strong>Industries</strong><br />
planning. This highlights long-term trends<br />
and enables us to develop options and analyze<br />
their potential efficacy as a basis for<br />
decisions. In the face of changing global<br />
business conditions, these analyses make a<br />
major contribution to securing our competitiveness<br />
and thus protecting jobs at <strong>Evonik</strong>.<br />
Using this tool, in <strong>2009</strong> we produced<br />
extensive age structure analyses for all Group<br />
companies, and various sites and organizational<br />
units in Germany. The analyses cover<br />
the base situation for human resources policy,<br />
starting from the present function structure,<br />
and the projected development of the<br />
age structure in the coming decade. They<br />
are based on uniform job families and look<br />
at employees by status and stage of development.<br />
This helps identify the human resources<br />
activities needed to counter demographic<br />
change, for example, activities to support<br />
the employability of older workers. The age<br />
structure analyses fulfill one of the major<br />
elements of the industry-wide agreement<br />
on lifetime working and demographic change<br />
concluded by representatives of management<br />
and employees in the German chemicals<br />
sector in 2008. In <strong>2009</strong> this was supplemented<br />
by in-house and collective agreements<br />
applicable to all Group companies in<br />
Germany. We use scenario-based human<br />
resources planning techniques in the USA<br />
and China as well as Germany, based on the<br />
uniform Group-wide job families introduced<br />
in <strong>2009</strong>.<br />
A family-friendly employer—<br />
Endorsement for a success factor<br />
<strong>Evonik</strong> is family-friendly. Following a stringent<br />
audit, in <strong>2009</strong> the non-profit organization<br />
Hertie Foundation awarded <strong>Evonik</strong> its<br />
“berufundfamilie” certificate for its commitment<br />
to helping staff in Germany combine<br />
work and family life. An agreement with<br />
employee representatives forms the basis<br />
for a range of activities that promote various<br />
ways of combining work with family commitments.<br />
Examples are special concepts to<br />
maintain contact with employees who are<br />
on parental leave and a guaranteed right for<br />
such employees to return to their previous<br />
job within a year. Employees remain integrated<br />
into the company and having children<br />
and taking time off to care for them no<br />
longer means a complete break from their<br />
workplace. Other aspects of <strong>Evonik</strong>’s familyfriendly<br />
human resources policy include<br />
special health promotion days, flexible<br />
working hours, an international exchange<br />
program for school students, scholarships,<br />
childcare facilities and extended leave for<br />
staff caring for sick or elderly relatives.<br />
That also helps position us as a preferred<br />
employer in the competition for the most<br />
able specialists and managers.<br />
Employer branding —Most striking<br />
image transformation<br />
Every year, trendence, the leading European<br />
institute for personnel marketing, presents<br />
the Employer Branding Award to the most<br />
successful employer. In <strong>2009</strong> <strong>Evonik</strong> was<br />
honored with first place in the category “most<br />
striking image transformation” in recognition<br />
of its coherent and authentic employer branding<br />
and striking recruitment campaign.<br />
Vocational training—Tomorrow’s<br />
employees<br />
We acknowledge our responsibility to give<br />
young people a start in the world of work.<br />
At the same time, our sustainable vocational<br />
training policy secures <strong>Evonik</strong>’s future. <strong>Evonik</strong><br />
took on 620 new trainees in <strong>2009</strong> and thus<br />
maintained its high commitment to vocational<br />
training. Overall, our German companies<br />
are training around 2,330 young people<br />
on around 40 recognized courses. As in<br />
2008, trainees accounted for around 9 percent<br />
of our German workforce, which is well<br />
above the average for German industry. High<br />
priority is attached to vocational training.<br />
Every year we invest around €57 million in<br />
training young people, which is also above<br />
the average. Despite the global financial<br />
and economic crisis, <strong>Evonik</strong> hired 510 highperforming<br />
and motivated young people at<br />
the end of their training for a period of at least<br />
six months or—for those who performed<br />
particularly well—on permanent contracts.<br />
We will be continuing this policy of sustainable<br />
personnel planning and recruitment<br />
from our pool of trainees in 2010.
Start Management report Consolidated financial statements Supplementary information<br />
Corporate responsibility<br />
Focused on the future—Talent and<br />
succession management<br />
The role of talent and succession management<br />
at <strong>Evonik</strong> is to retain talented staff<br />
and develop good employees into excellent<br />
managers. A Group-wide review process<br />
allows early identification of talents. Depending<br />
on their experience and stage of development,<br />
they are classified as emerging,<br />
developing or advanced leaders. Talent<br />
review meetings were held in all business<br />
areas for the first time in <strong>2009</strong>. In addition, a<br />
new interview process has been developed<br />
to place the initial assessment of emerging<br />
leaders on an objective basis and more<br />
effectively identify their strengths and areas<br />
where development is required. The first<br />
candidates were interviewed in <strong>2009</strong> and<br />
preparations are under way for the international<br />
rollout of this system to China and<br />
the USA.<br />
In tough business conditions, it is particularly<br />
important to give talents opportunities<br />
for networking within the Group and to tap<br />
into their vision of the future. Our employees’<br />
competencies remain the foundation on<br />
which <strong>Evonik</strong>’s innovative strength is built.<br />
To supplement our mentoring and leadership<br />
programs, we therefore invited 70 of<br />
our top talents to TalentDays in <strong>2009</strong> to<br />
give them an opportunity to discuss future<br />
opportunities and trends outside their normal<br />
working environment and thus look<br />
beyond the crisis.<br />
Employee participation plan<br />
In spite of the difficult business conditions,<br />
our employees showed their confidence in<br />
<strong>Evonik</strong>’s future: The number of staff taking<br />
part in the employee participation plan was<br />
far higher than in the previous year. This<br />
program enables staff to benefit directly<br />
from the success of the <strong>Evonik</strong> Group.<br />
The participation rights purchased under<br />
this program yield a return based on the<br />
Group’s return on capital employed (ROCE),<br />
which was 6.5 percent in 2008. In <strong>2009</strong><br />
around 4,100 employees purchased a total<br />
of 4.3 million participation rights. The total<br />
discount granted by <strong>Evonik</strong> was €0.5 million.<br />
Attractive remuneration system—<br />
Long-term incentive plan<br />
Our remuneration systems support the<br />
achievement of our strategic objectives and<br />
include long-term incentive components<br />
based on those objectives. The Long-Term<br />
Incentive Plan is an attractive remuneration<br />
component for executives worldwide. The<br />
aim is to highlight the increase in <strong>Evonik</strong>’s<br />
equity value as a central success factor, in<br />
addition to the bonus system which is based<br />
on the attainment of annual targets. Payments<br />
will be made under the 2008 and<br />
<strong>2009</strong> tranches if the company’s equity value<br />
rises by a defined amount within a threeyear<br />
period.<br />
Acting on the findings—Following up<br />
on the 2008 employee survey<br />
The global employee survey “Contribute,<br />
Communicate, Create” in 2008 gave us an<br />
insight into the opinions and sentiment of<br />
our employees. Key findings: Employees<br />
would like a more direct dialogue with their<br />
managers, seek greater involvement in decisions<br />
and change processes, and expressed<br />
clear expectations that the improvements<br />
initiated would actually be implemented.<br />
Group-wide and departmental initiatives<br />
are acting on the findings. One Group-wide<br />
outcome is action to improve the frequency<br />
and quality of individual performance reviews.<br />
One-to-one reviews are designed to bring a<br />
sustained improvement in collaboration in<br />
the workplace. So far, this tool has mainly<br />
been used for managerial staff. As a first<br />
step, we aim to ensure that every employee<br />
in Germany has an individual development<br />
review before the end of 2010.<br />
<strong>Annual</strong> <strong>Report</strong> <strong>2009</strong> <strong>Evonik</strong> <strong>Industries</strong> 73
74<br />
<strong>Annual</strong> <strong>Report</strong> <strong>2009</strong> <strong>Evonik</strong> <strong>Industries</strong><br />
Headcount in <strong>2009</strong><br />
At year-end <strong>2009</strong> the <strong>Evonik</strong> Group had<br />
38,681 employees, around 21 percent of<br />
whom were female. The average age of the<br />
workforce was 41.5 years. 34 percent are<br />
employed outside Germany. The headcount<br />
was 2,086 lower than at year end 2008. Most<br />
of the decline (2,005 employees) was in the<br />
Chemicals Business Area and was mainly<br />
due to the divestment of the AlzChem Group<br />
(around 1,200 employees). The remainder<br />
of the decline was principally attributable to<br />
restructuring around the world in the face<br />
of the economic situation, and normal fluctuation.<br />
Employees by business area<br />
Employees by region<br />
Other<br />
1%<br />
Asia<br />
14%<br />
Central and<br />
South America<br />
1%<br />
North America<br />
9%<br />
Other European<br />
countries<br />
9%<br />
Germany<br />
66%<br />
<strong>2009</strong> 2008<br />
Chemicals 29,723 31,728<br />
Energy 4,820 4,702<br />
Real Estate 479 443<br />
Other operations 3,659 3,894<br />
<strong>Evonik</strong> 38,681 40,767<br />
Age structure of the <strong>Evonik</strong> Group<br />
in %<br />
Under 21 years 4<br />
21 – 25 years 7<br />
26 – 30 years 8<br />
31 – 35 years 10<br />
36 – 40 years 13<br />
41 – 45 years 17<br />
46 – 50 years 17<br />
51 – 55 years 15<br />
56 – 60 years 8<br />
Over 60 years 1<br />
0 2 4 6 8 10 12 14 16
Start Management report Consolidated financial statements Supplementary information<br />
Corporate responsibility<br />
Environment, safety and health<br />
Environment, safety and health (ESH) are<br />
key elements in corporate responsibility at<br />
<strong>Evonik</strong>. Our ESH responsibility is shaped by<br />
Group-wide regulations comprising overriding<br />
ESH values, policies and procedures. The<br />
legal conformance of the ESH organization<br />
based on this structure was confirmed by an<br />
external appraisal in <strong>2009</strong>.<br />
At a glance<br />
Validated<br />
Internal audits confirm implementation<br />
of ESH rules<br />
Certified<br />
More than 95 percent of chemicals<br />
production conforms to ISO 14001 and<br />
all power plants in the Rhine/Ruhr and<br />
Saar regions have been validated<br />
Improvement<br />
Further reduction in accident frequency<br />
On schedule<br />
Around 200 substances will be registered<br />
under REACH by year end 2010 and<br />
nearly 1,000 by 2018<br />
Focus on the future<br />
Energy efficiency and climate protection<br />
Successful ESH audits<br />
A large number of internal audits of the<br />
business units, regions and individual sites<br />
were conducted in <strong>2009</strong> to monitor implementation<br />
of the ESH regulations. In addition,<br />
more than 95 percent of production<br />
in the Chemicals Business Area is validated<br />
as compliant with ISO 14001 and external<br />
environmental auditors have confirmed the<br />
efficacy of our environmental management<br />
systems. In <strong>2009</strong>, the Energy Business Area<br />
continued its policy of having occupational<br />
health and safety validated externally by the<br />
responsible Employers’ Liability Insurance<br />
Associations. Validation under OHSAS 18001<br />
runs for three years. All power plants in the<br />
Rhine/Ruhr and Saar regions have been<br />
validated. The outcome of the ESH audits<br />
forms an important basis for the annual<br />
management review. Despite the good standards<br />
achieved so far, this revealed further<br />
scope for improvement, which we will be<br />
implementing systematically.<br />
Further improvement in occupational<br />
and plant safety<br />
Considerable progress was made in the field<br />
of occupational safety. In <strong>2009</strong>, the frequency<br />
of accidents (number of accidents per million<br />
hours worked) in the <strong>Evonik</strong> Group was 2.8,<br />
a renewed reduction compared with the<br />
previous year. There were no fatal accidents<br />
involving <strong>Evonik</strong> employees in the workplace.<br />
The accident frequency in the Chemicals<br />
Business Area was 1.2, an improvement of<br />
nearly 30 percent year-on-year. That is a very<br />
high level compared with the international<br />
chemical industry. Although external contractors<br />
are informed of site and plant-specific<br />
hazards and the necessary precautions in<br />
accordance with our ESH regulations, two<br />
employees working for contractors died in<br />
an accident at our site in Dalian (China).<br />
Accident frequency by business area<br />
<strong>2009</strong> 2008<br />
Chemicals 1.2 1.7<br />
Energy 6.6 7.7<br />
Real Estate 2.4 2.3<br />
<strong>Evonik</strong> 2.8 3.3<br />
Clearly structured analyses help us understand<br />
the causes of such accidents so we can<br />
take action to prevent a recurrence in the<br />
future. The same attention is paid to plant<br />
safety. In the Chemicals Business Area we<br />
have introduced an internal plant safety<br />
indicator to ensure early identification of<br />
weaknesses and take action to improve the<br />
situation. We are one of the first chemical<br />
companies in the world to introduce this<br />
indicator to measure the current status of<br />
plant safety. The next step comprises using<br />
it to introduce improvement processes that<br />
optimize workflows.<br />
<strong>Annual</strong> <strong>Report</strong> <strong>2009</strong> <strong>Evonik</strong> <strong>Industries</strong> 75
76<br />
<strong>Annual</strong> <strong>Report</strong> <strong>2009</strong> <strong>Evonik</strong> <strong>Industries</strong><br />
Lower emissions<br />
Many facilities operated by <strong>Evonik</strong>’s Energy<br />
and Chemicals Business Areas fall directly<br />
within the remit of the European regulations<br />
on trading in CO2 emissions allowances<br />
(EU-ETS). CO2 emissions from these facilities<br />
in <strong>2009</strong> totaled some 20.6 million metric<br />
tons (2008: 26.0 million metric tons). The<br />
Energy Business Area accounted for around<br />
16.7 million metric tons and the Chemicals<br />
Business Area for around 3.9 million metric<br />
tons.<br />
The public debate continues to focus on<br />
European allocation rules and the question<br />
as to which industries will be most affected<br />
by the financial implications of EU-ETS from<br />
2013. At the start of July <strong>2009</strong>, the European<br />
Commission issued a draft list of the sectors<br />
which would be most affected, which was<br />
confirmed by the Comitology Committee<br />
in September <strong>2009</strong>. Most segments of the<br />
chemicals industry will probably be allocated<br />
free allowances thanks to the application of<br />
special rules. The next step will be to define<br />
the allocation rules and the benchmarks<br />
to be used. This will be performed by the<br />
European Commission in 2010. In the power<br />
generating sector, all allowances will have<br />
to be obtained by auction from 2013.<br />
Selective investment in<br />
environmental protection<br />
Investment in efficient measures integrated<br />
into plants and processes is essential to<br />
improve environmental protection. The<br />
Chemicals Business Area invested €43 million<br />
in environmental protection in <strong>2009</strong><br />
(2008: €44 million). A high proportion of<br />
this was for MATCH, the new integrated<br />
production complex in Shanghai (China).<br />
Operating costs for environmental protection<br />
facilities in the Chemicals Business Area<br />
were unchanged at €259 million. A decline<br />
in operating costs for environmental protection<br />
resulting from the savings drive in <strong>2009</strong><br />
was offset by special projects such as implementation<br />
of the EU’s REACH Regulation<br />
(Registration, Evaluation, Authorisation and<br />
Restriction of Chemicals).<br />
In the Energy Business Area, environmental<br />
protection costs are incurred principally<br />
in the construction of new power plants and<br />
to improve the efficiency of existing power<br />
generating equipment. For example, environmentally<br />
relevant measures account for about<br />
30 percent of total investment of around<br />
€820 million in Europe’s most advanced<br />
hard-coal power plant in Duisburg-Walsum<br />
(Germany).<br />
Focus on energy efficiency and<br />
climate protection<br />
The debate about climate change and potential<br />
to reduce relevant emissions is gaining<br />
in intensity. COP 15, the United Nation’s<br />
Global Climate Conference in Copenhagen<br />
(Denmark), put climate protection back on<br />
the political agenda. We outlined our position<br />
ahead of this conference through a contribution<br />
to “Climate Action <strong>2009</strong>/2010” in<br />
which we called for an international agreement<br />
for the period following expiry of the<br />
Kyoto Protocol in 2012 and highlighted scope<br />
to use solutions already available from <strong>Evonik</strong><br />
to utilize energy more efficiently. As an<br />
energy-intensive company with power plants<br />
that generate heat and electricity, chemical<br />
processes that use significant amounts of<br />
energy and a portfolio of some 60,000 residential<br />
units, we consider that we have a<br />
special responsibility with regard to energy<br />
efficiency. Our response comprises:<br />
• continuously improving the efficiency<br />
of our production processes<br />
• innovative products that save energy for<br />
our customers. According to a report by<br />
the International Council of Chemical<br />
Associations (ICCA), every metric ton<br />
of CO2 emitted by chemical production<br />
processes saves more than two metric<br />
tons during utilization by customers.<br />
Products from <strong>Evonik</strong> were included in<br />
the ICCA report.
Start Management report Consolidated financial statements Supplementary information<br />
Corporate responsibility<br />
• contributing to more efficient use of primary<br />
energy sources, thus cutting CO2<br />
emissions, through technology transfer,<br />
modernization of power plants and utilization<br />
of renewable energy resources.<br />
• optimizing the energy profile of our<br />
housing stock and building new homes<br />
based on smart concepts.<br />
As part of our 2010 CR program, our experts<br />
are drafting a climate strategy for the Group.<br />
A key aspect is balancing the CO2 emissions<br />
from production processes against the benefits<br />
reaped by the customers in the use of<br />
our products (lower emissions).<br />
REACH activities on schedule<br />
We are making rapid progress with our<br />
work on registering substances under the<br />
REACH Regulation. The main focus is on<br />
preparing the registration dossiers and substance<br />
safety reports. Registration will take<br />
place on the basis of volume in three phases<br />
in 2010, 2013 and 2018. Overall, we have<br />
now filed 20 registration dossiers with the<br />
European Chemicals Agency (ECHA) and 17<br />
have already been accepted. These include<br />
the dossier for synthetic amorphous silica—<br />
in other words, precipitated silicas (including<br />
ULTRASIL� and SIPERNAT�) and fumed<br />
silicas (AEROSIL�)—submitted at the start<br />
of <strong>2009</strong>. <strong>Evonik</strong> was one of the first chemical<br />
companies to achieve a successful filing.<br />
Registration took the form of a joint submission<br />
by order of the relevant REACH<br />
consortia.<br />
Our REACH activities are currently fully<br />
on schedule. We aim to have registered<br />
around 200 substances under REACH by<br />
the end of 2010 and nearly 1,000 by 2018.<br />
<strong>Evonik</strong> supports the Global<br />
Product Strategy<br />
The International Council of Chemical<br />
Associations (ICCA) has set up the Global<br />
Product Strategy (GPS) initiative to encourage<br />
safe and appropriate global chemicals<br />
management. <strong>Evonik</strong> explicitly supports this<br />
initiative and is actively driving it forward, for<br />
example, at symposia in China and Eastern<br />
Europe.<br />
The aim of the GPS is to improve and<br />
harmonize standards of product stewardship,<br />
in other words, responsibility for the<br />
entire lifecycle of a product, throughout<br />
the global chemical industry. That includes<br />
making information on safe handling and<br />
use of chemical substances widely available<br />
to facilitate safe handling around the world.<br />
This means increasing transparency and<br />
improving communications along the product<br />
chain and requires a willingness to provide<br />
understandable information for the<br />
general public. We will be implementing<br />
GPS throughout the <strong>Evonik</strong> Group and have<br />
already published GPS Safety Summaries<br />
for around 100 chemicals on our website.<br />
In future, we will also be utilizing the data<br />
compiled in compliance with REACH to<br />
produce Safety Summaries and posting<br />
them on our website.<br />
<strong>Annual</strong> <strong>Report</strong> <strong>2009</strong> <strong>Evonik</strong> <strong>Industries</strong> 77
78<br />
<strong>Annual</strong> <strong>Report</strong> <strong>2009</strong> <strong>Evonik</strong> <strong>Industries</strong><br />
Corporate governance<br />
Good corporate governance, which <strong>Evonik</strong><br />
defines as responsible and targeted corporate<br />
management and oversight, forms an<br />
integral part of our business processes.<br />
<strong>Evonik</strong>’s Executive Board and Supervisory<br />
Board base their conduct on the German<br />
Corporate Governance Code. The rules for<br />
fair and responsible treatment of stakeholders<br />
are set out in our own Global Code of<br />
Conduct. This is binding for all employees<br />
worldwide, compliance is monitored and<br />
sanctions are imposed if it is violated. In <strong>2009</strong><br />
we added further training offers to familiarize<br />
our employees with the Code of Conduct.<br />
Our compliance activities also focus on preventing<br />
corruption. A corporate policy sets<br />
out the basic conditions for dealing with<br />
external personnel in the commercialization<br />
of <strong>Evonik</strong> products. Here too, we provide<br />
full training for our employees. Since we<br />
consider compliance to be extremely important,<br />
we have set up a global compliance<br />
organization headed by a Chief Compliance<br />
Officer, who reports directly to the Chairman<br />
of the Executive Board but acts autonomously<br />
in the field of compliance.<br />
Events after the end<br />
of the reporting period<br />
Effective January 1, 2010 we acquired a<br />
production site in Tippecanoe, Lafayette<br />
(Indiana, USA) from Eli Lilly and Company,<br />
Indianapolis (Indiana, USA). See also pages<br />
57 and 67.
Start Management report Consolidated financial statements Supplementary information<br />
Risk report<br />
Corporate governance<br />
Events after the end of the reporting period<br />
Risk report<br />
Risk strategy<br />
<strong>Evonik</strong> is exposed to a variety of risks in the<br />
course of its business activities. Risk management<br />
therefore forms a central element<br />
in the management of the company and<br />
is geared to targeted management of risk<br />
with a view to securing present and future<br />
potential for success and avoiding, preventing,<br />
countering and minimizing risk. We<br />
only enter into entrepreneurial risks if we<br />
are convinced that they can generate a sustained<br />
rise in the value of the company and<br />
that we are able to control any possible<br />
implications.<br />
Structure and organization of<br />
risk management<br />
<strong>Evonik</strong> has an internal monitoring system in<br />
place across the Group. Alongside organizational<br />
measures and internal control systems,<br />
this includes the Corporate Audit Department<br />
as a process-unrelated controlling and<br />
consulting body.<br />
Our risk management system is organized<br />
on a decentralized basis in line with <strong>Evonik</strong>’s<br />
organizational structure. The business units,<br />
Corporate Center and service units bear<br />
prime responsibility for the early identification<br />
of risks, estimating their implications,<br />
introducing suitable preventive and control<br />
measures and for the related internal communication.<br />
Risk Coordinators within these<br />
organizational units are responsible for<br />
coordinating the relevant risk management<br />
activities. A central Risk Officer is responsible<br />
for managing and coordinating the processes<br />
and systems for the Group. He is<br />
the contact for all risk coordinators and is<br />
responsible for documentation, coordination<br />
and information for the entire Group and<br />
for ongoing development of the risk management<br />
system.<br />
Risk management is a central element in<br />
<strong>Evonik</strong>’s controlling processes at all levels<br />
of the Group. These include strategic and<br />
operational planning, preparing investment<br />
decisions, monthly reporting and ad hoc<br />
reports. The organizational units also conduct<br />
an extensive annual risk inventory with<br />
the aid of uniform software tools. All risks<br />
are systematically identified and documented<br />
using detailed checklists and their probability<br />
of occurrence and the potential consequences<br />
are assessed. The organizational<br />
units are required to specify risk limitation<br />
measures for all risks identified in the risk<br />
inventory process and evaluate their efficacy<br />
and level of implementation. The annual<br />
risk inventory, which looks at risks over<br />
a period of at least three years, is supplemented<br />
by quarterly risk reports on changes<br />
in risk factors previously identified and newly<br />
identified risks. The <strong>Evonik</strong> Group has issued<br />
a binding policy on risk management.<br />
In fiscal <strong>2009</strong> Corporate Auditing<br />
inspected aspects of the risk management<br />
system as part of its audits of the organizational<br />
units and established that they comply<br />
with statutory and in-house requirements.<br />
In addition, the system used to identify<br />
emerging risks is included in the annual<br />
audit in the same way as for listed companies.<br />
This showed that <strong>Evonik</strong>’s risk<br />
detection system is suitable for timely identification<br />
of risks that could pose a threat to<br />
the company’s survival.<br />
<strong>Annual</strong> <strong>Report</strong> <strong>2009</strong> <strong>Evonik</strong> <strong>Industries</strong> 79
80<br />
<strong>Annual</strong> <strong>Report</strong> <strong>2009</strong> <strong>Evonik</strong> <strong>Industries</strong><br />
Internal control system for financial<br />
accounting<br />
The Group-wide internal control system<br />
includes the internal control system (ICS)<br />
for financial accounting. This is based on<br />
a global policy, which defines uniform<br />
accounting and valuation principles for all<br />
German and foreign companies included<br />
in the consolidated financial statements for<br />
the <strong>Evonik</strong> Group. The companies submit<br />
their financial statements via a web-based<br />
interface to the consolidation software. A<br />
range of technical validations are performed<br />
at this stage. The majority of companies have<br />
delegated the preparation of their financial<br />
statements to the Shared Service Center<br />
(SSC). Through systematic process orientation<br />
and standardization, and utilization of<br />
economies of scale this leverages sustained<br />
cost benefits and can improve the quality of<br />
accounting. The SSC is validated annually in<br />
conformance with German audit standard<br />
IDW 951. An external audit is conducted on<br />
the annual financial statements of 95 percent<br />
of companies.<br />
All data are consolidated centrally in the<br />
Corporate Center using recognized computer<br />
programs. Key oversight functions<br />
comprise computerized and manual process<br />
controls, such as the principle of checking<br />
by a second person. The preparation of the<br />
monthly consolidated income statement and<br />
three full quarterly reports allows us to gain<br />
experience with new accounting issues and<br />
provides a good basis for plausibilization of<br />
the year-end accounts. The Executive Board<br />
receives monthly reports and quarterly<br />
reports are submitted to the Audit Committee.<br />
The accounting process is included in<br />
the Group-wide risk management system.<br />
Financial risk management<br />
<strong>Evonik</strong> follows the principle of separation<br />
of trading, risk controlling and back office<br />
functions and takes as its guide the bankingspecific<br />
“Minimum Requirements for Trading<br />
Activities of Credit Institutions” (MaRisk)<br />
and the requirements of the German legislation<br />
on corporate control and transparency<br />
(KonTraG). Binding trading limits, responsibilities<br />
and controls are thus set in accordance<br />
with recognized best practices, and Groupwide<br />
policies and principles are in place. All<br />
financial risk positions in the Group have to<br />
be identified and evaluated. This forms the<br />
basis for selective hedging to limit risks.<br />
Credit risks relating to financial contracts<br />
are systematically examined when the contracts<br />
are concluded and monitored continuously<br />
afterwards. Ceilings are set for each<br />
counterparty on the basis of internal or<br />
rating-based creditworthiness analyses.<br />
Details of the financial derivatives used<br />
and their recognition and valuation can be<br />
found in Note (10.3) to the consolidated<br />
financial statements.<br />
Overall risk assessment<br />
Given the measures planned and implemented,<br />
no risks have been identified that—<br />
either individually or in conjunction with<br />
other risks—could jeopardize the continued<br />
existence of <strong>Evonik</strong>. At present, we are specifically<br />
monitoring market and competition<br />
risks, and sales and volume risks.<br />
Due to the fields in which it operates,<br />
the <strong>Evonik</strong> Group is exposed to constantly<br />
changing national and international political,<br />
societal, demographic, legal and economic<br />
operating conditions. To counter the resultant<br />
risks we monitor our business environment<br />
closely, anticipate market trends and<br />
consistently develop our portfolio in conformance<br />
with our corporate strategy.
Start Management report Consolidated financial statements Supplementary information<br />
Risk report<br />
Market and competition risks<br />
In <strong>2009</strong>, the global economic crisis had a<br />
severe impact on many of <strong>Evonik</strong>’s markets.<br />
The shortfall in demand, especially in the<br />
Chemicals Business Area, required action<br />
such as scaling back production capacity and<br />
extensive cost-savings to limit the earning<br />
and cash-flow risks during the year. In the<br />
second half of the year, stabilization or a<br />
slight recovery was registered in almost all<br />
of <strong>Evonik</strong>’s businesses. One major risk factor<br />
is the intensive competition in some market<br />
segments. In the Chemicals Business Area,<br />
competitors in low-wage countries in particular<br />
increase competitive pressure through<br />
aggressive pricing policies. To counter this<br />
we are broadening our foreign production<br />
base and gaining access to new markets in<br />
high-growth regions such as China. The<br />
operating units affected also use various<br />
methods of increasing customer loyalty to<br />
reduce these risks. These include, in particular,<br />
strategic research alliances with customers,<br />
customer relationship management and<br />
an improvement in the services offered. We<br />
are constantly developing attractive and<br />
competitive new products to counter the risk<br />
that chemical products could be replaced by<br />
new, improved or less expensive materials<br />
or technologies. Alternatives also have to be<br />
found for certain raw materials subject to the<br />
REACH Regulation which may no longer be<br />
available in the future. In the Energy Business<br />
Area, the energy policy framework could<br />
have a detrimental effect. This applies in<br />
particular to future regulatory measures to<br />
further reduce CO2 emissions. We therefore<br />
have a clear focus on work geared to reducing<br />
the specific CO2 emissions of power<br />
plants by increasing efficiency further and<br />
using innovative technologies. Moreover,<br />
plans to allocate all CO2 allowances—even<br />
for new power plants—by auction from<br />
2013 will hamper the economical and competitive<br />
construction of new power plants<br />
in Germany. The Real Estate Business Area<br />
uses a strategic mixture of modernization,<br />
demolition and new construction, supplemented<br />
by selective acquisition of attractive<br />
residential properties, to avoid the risk of a<br />
possible deterioration in the value and earning<br />
power of its portfolio due to regional<br />
or demographic factors. At the same time,<br />
opportunities for further profitable expansion<br />
of this business area are used.<br />
Production and environmental risks<br />
As an industrial group, <strong>Evonik</strong> is exposed to<br />
a risk of interruptions in operation, quality<br />
problems and unexpected technical difficulties,<br />
as well as to product safety, occupational<br />
safety and environmental risks. Group-wide<br />
policies on project and quality management,<br />
product safety, occupational safety and environmental<br />
protection are an effective way of<br />
reducing these risks. Production stoppages<br />
due to plant failures are insured. Further,<br />
production processes and workflows, which<br />
are certified as conforming to international<br />
standards, are constantly being upgraded and<br />
improved, careful maintenance is carried out<br />
on all installations and employees receive<br />
appropriate initial and advanced training. In<br />
addition, especially when new production<br />
facilities are erected in countries like China,<br />
the Chemicals Business Area is exposed to<br />
a risk that intellectual property cannot be<br />
adequately protected, even through patents.<br />
Adequate provisions have been made for<br />
any necessary remediation of contaminated<br />
sites. As a responsible company with significant<br />
chemical activities, <strong>Evonik</strong> ensures that<br />
such processes are operated in accordance<br />
with the principles of the global Responsible<br />
Care initiative.<br />
<strong>Annual</strong> <strong>Report</strong> <strong>2009</strong> <strong>Evonik</strong> <strong>Industries</strong> 81
82<br />
<strong>Annual</strong> <strong>Report</strong> <strong>2009</strong> <strong>Evonik</strong> <strong>Industries</strong><br />
Procurement risks<br />
The availability of starting products and<br />
intermediates and dependence on commodity<br />
and energy prices are further potential<br />
risk factors. The Chemicals Business Area is<br />
particularly dependent on the development<br />
of the price of crude oil and petrochemical<br />
feedstocks derived directly or indirectly from<br />
oil. It is also dependent on exchange rates,<br />
which have a major influence on both commodity<br />
and energy costs. We counter these<br />
risks by optimizing global purchasing activities,<br />
entering into long-term supply contracts,<br />
agreeing price formulae where possible or<br />
finding alternative suppliers. We also investigate<br />
the possibility of using substitute raw<br />
materials for various production processes<br />
and are working to develop alternative production<br />
technologies. Procurement costs<br />
were lower in <strong>2009</strong> than in 2008. This<br />
reduced pressure on us to push through sharp<br />
hikes in selling prices, which can be hampered<br />
by the competitive situation. One challenge<br />
in the light of the Energy Business Area’s<br />
portfolio of power plants is the reduction<br />
in mining of hard coal in Germany. We<br />
are addressing this through process and<br />
technology-based measures and the procurement<br />
of alternative fuels.<br />
Sales and marketing risks<br />
The customer base in the Chemicals and Real<br />
Estate Business Areas means they are only<br />
exposed to low cluster risks. However, some<br />
operational units have a certain dependence<br />
on key customers. A decline in demand from<br />
the sectors served by the Chemicals Business<br />
Area or a deterioration in the competitive<br />
position of its customers could adversely<br />
affect the chemicals business. We respond<br />
to these risks by permanent monitoring of<br />
the market, acquiring new customers, developing<br />
customer strategies and efforts to<br />
establish new applications and gain access<br />
to new markets as early as possible. The<br />
Energy Business Area’s business model centers<br />
on long-term contracts, which reduce<br />
the marketing and sales risk as they include<br />
clauses allowing changes in raw material<br />
prices to be passed on to customers to a<br />
large extent.<br />
Interest and exchange rate risks<br />
In the course of its business, <strong>Evonik</strong> is<br />
exposed to the risk of changes in exchange<br />
rates and interest rates. A detailed overview<br />
of interest rate and foreign exchange management<br />
and the use of financial derivatives<br />
is given in Note (10.3) to the consolidated<br />
financial statements and Note (27) to the<br />
annual financial statements of <strong>Evonik</strong><br />
<strong>Industries</strong> <strong>AG</strong>.<br />
Liquidity risks<br />
At the heart of <strong>Evonik</strong>’s central liquidity risk<br />
management is a Group-wide cash pool. In<br />
addition, the Group’s financial independence<br />
is secured through a broadly diversified<br />
financing structure. A detailed overview of<br />
liquidity risks and their management can be<br />
found in Note (10.3) to the consolidated<br />
financial statements.<br />
Details of the financing of the <strong>Evonik</strong><br />
Group and action to protect liquidity can be<br />
found on page 41 (Financial condition).<br />
Overall, <strong>Evonik</strong> believes that adequate<br />
financing instruments are available to ensure<br />
sufficient liquidity at all times.<br />
Acquisition and divestment risks<br />
Active portfolio management and valuebased<br />
controlling have high priority at<br />
<strong>Evonik</strong>. Our operating units are permanently<br />
screened for sustainable profitability<br />
and to ensure they fit the corporate strategy.<br />
The strategic development of <strong>Evonik</strong><br />
may entail the expansion of specific operations,<br />
divestment or gaining a foothold in<br />
completely new fields of business. <strong>Evonik</strong><br />
has defined structured processes for all of<br />
these alternatives.
Start Management report Consolidated financial statements Supplementary information<br />
Risk report<br />
Where it is not possible to strengthen business<br />
operations through organic growth,<br />
other companies or business operations are<br />
acquired. We have set out clear procedures<br />
for preparing, analyzing and undertaking<br />
acquisitions. In particular, these include<br />
clear rules on accountability and approval<br />
processes. For example, an intensive examination<br />
of potential acquisition targets (due<br />
diligence) is undertaken before they are<br />
acquired. This involves a systematic analysis<br />
of all major risks and opportunities and an<br />
appropriate valuation. Key aspects of this<br />
process are strategic focus, management<br />
quality and development potential and any<br />
legal, financial and environmental risks. New<br />
subsidiaries are rapidly integrated into the<br />
Group and thus into our risk management<br />
and controlling processes.<br />
Any restructuring or divestment requirements<br />
relating to the strategic management<br />
of the <strong>Evonik</strong> Group are systematically<br />
implemented. Post-transaction management<br />
closely monitors any liability and guarantee<br />
risks resulting from divestments.<br />
Legal risks<br />
<strong>Evonik</strong> is exposed to risks relating to legal<br />
disputes, administrative proceedings and<br />
fines. Similarly, guarantee claims against the<br />
company may result from divestments. In its<br />
operating business, the Group is exposed to<br />
liability risks, especially in connection with<br />
product liability, patent law, tax law, competition<br />
law, antitrust law and environmental<br />
law. We have developed a concept involving<br />
high quality and safety standards to ensure a<br />
controlled approach to such risks. Insurance<br />
cover has been purchased for the financial<br />
consequences of any damage that may nevertheless<br />
occur as a result of damage to property,<br />
product liability claims and other risks.<br />
Where necessary, provisions have been set<br />
up for such risks.<br />
Human resources risks<br />
The skills and knowledge of our highly<br />
qualified managers and employees are vital<br />
to achieve the strategic and operational<br />
objectives of the organizational units. To<br />
ensure that we can recruit and retain qualified<br />
staff to meet our future requirements<br />
we offer attractive remuneration systems<br />
and systematic personnel development, giving<br />
employees a wide range of opportunities<br />
to develop and enhance their personal<br />
and professional abilities. We also maintain<br />
close links to universities and professional<br />
associations to help us recruit talented<br />
youngsters.<br />
Information technology risks<br />
Group-wide rules and regulations provide<br />
details of how to handle information and<br />
the secure use of information systems.<br />
Modern information security and data protection<br />
technologies are used throughout<br />
the Group to avoid such risks. Appropriate<br />
procedures and state-of-the-art technical<br />
protection are installed to counter the risk<br />
of potential unauthorized access and the<br />
loss of data. Internal communication methods<br />
such as IT security campaigns are used<br />
to heighten employees’ awareness of the<br />
need for security in the handling of information<br />
technology.<br />
<strong>Annual</strong> <strong>Report</strong> <strong>2009</strong> <strong>Evonik</strong> <strong>Industries</strong> 83
84<br />
Outlook<br />
<strong>Annual</strong> <strong>Report</strong> <strong>2009</strong> <strong>Evonik</strong> <strong>Industries</strong><br />
Gradual global economic recovery<br />
In view of the differing impact of the recession<br />
on different regions and sectors, economic<br />
forecasts currently entail considerable<br />
uncertainty. However, it is generally<br />
assumed that the crisis has bottomed out.<br />
Initial signs of revival were identified in the<br />
second half of <strong>2009</strong>. Nevertheless, demand<br />
did not rise further in the fourth quarter.<br />
Industry and especially the chemical industry<br />
is still not operating anywhere near full<br />
capacity. Further, it is not yet clear whether<br />
the expiry of government stimulus packages<br />
will have an impact, and whether the economic<br />
momentum in China and India will<br />
continue. Price trends for energy and commodities<br />
are also unpredictable: Prices have<br />
risen considerably again since the turn of<br />
<strong>2009</strong>/2010. Alongside these factors, which<br />
are likely to dampen the economic recovery,<br />
inventories now need to be built up and<br />
reordering is necessary, especially for starting<br />
products for the automotive, construction<br />
and electronics industries. The financial<br />
sector remains a risk factor. The markets are<br />
being held back by a dramatic rise in publicsector<br />
debt and uncertainty about insolvency<br />
patterns in 2010, which could involve a risk<br />
of considerable impairment losses on loans.<br />
This in turn could reduce new lending, so<br />
the possibility of a credit crunch has not yet<br />
been eliminated. The generally expected<br />
rise in unemployment would also have an<br />
adverse economic effect as it would dampen<br />
consumer spending and domestic demand.<br />
Even if there is an upswing, it could be<br />
several years before the global economy<br />
and, above all, the established industrialized<br />
nations, have regained the level seen in the<br />
first half of 2008.<br />
Corporate strategy:<br />
focus on creating value<br />
Concentrating on specialty chemicals paves<br />
the way for further profitable growth. We<br />
want to enable our energy business to fully<br />
exploit its considerable growth potential in<br />
collaboration with one or more partners,<br />
while remaining part of the <strong>Evonik</strong> Group.<br />
In addition, we intend to combine our real<br />
estate operations with THS and then develop<br />
perspectives for these operations on the<br />
capital markets. Within the specialty chemicals<br />
segment, we are aligning our operations<br />
systematically to high-margin business,<br />
especially with a view to the global megatrends:<br />
resource efficiency, health and nutrition,<br />
and globalization of technologies.<br />
Through this new corporate strategy we<br />
aim to create sustained value for <strong>Evonik</strong><br />
and also enable all three business areas to<br />
develop in line with their potential.
Start Management report Consolidated financial statements Supplementary information<br />
Outlook<br />
Further opportunities resulting from<br />
increased competitiveness<br />
In addition, the current projects to cut costs,<br />
raise efficiency and optimize organizational<br />
structures and processes as part of the On<br />
Track efficiency improvement drive are<br />
strengthening our position for the economic<br />
upswing. The reinforcement of our market<br />
positions in <strong>2009</strong> will also bear fruit: The<br />
new production facilities that have been<br />
completed or are currently under construction<br />
in the Chemicals Business Area should<br />
enable us to participate in the expected<br />
strong growth in Asia and in the future markets<br />
for electronics and the solar industry.<br />
We have also positioned ourselves in the<br />
attractive future market for lithium-ion battery<br />
cells and components and see good<br />
opportunities to benefit from the trend to<br />
electric vehicles. In 2010 the Energy Business<br />
Area should bring the Walsum 10 power<br />
plant into service, providing efficient energy.<br />
Our innovative prowess, reflected by the<br />
introduction of new products, new applications<br />
for established products and new<br />
technologies, will generate considerable<br />
momentum for <strong>Evonik</strong> in the coming years.<br />
Outlook: Higher sales and stable<br />
operating earnings<br />
The economic outlook for 2010 is still very<br />
uncertain. We expect sales to rise this year<br />
as volumes pick up. Successful short-term<br />
cost savings in <strong>2009</strong> boosted EBITDA by<br />
roughly €500 million. However, many of<br />
these savings were one-off . Overall, we<br />
anticipate that in 2010 EBITDA will be<br />
around the same level as in <strong>2009</strong>.<br />
In view of the expected upturn in business,<br />
we are planning to step up capital<br />
expenditures compared with <strong>2009</strong>.<br />
Based on our performance in 2010, we<br />
expect to see a further perceptible improvement<br />
in operating business in 2011. Sustained<br />
cost savings and improved competitiveness<br />
should have a positive effect.<br />
This report contains forward-looking statements based on the present expectations, assumptions and forecasts<br />
made by the Executive Board and the information available to it. These forward-looking statements do not<br />
constitute a guarantee of future developments and earnings expectations. Future performance and developments<br />
depend on a wide variety of factors which contain a number of risks and unforeseeable factors and are based on<br />
assumptions that may prove incorrect.<br />
<strong>Annual</strong> <strong>Report</strong> <strong>2009</strong> <strong>Evonik</strong> <strong>Industries</strong> 85
Tour 3:<br />
Consolidated financial<br />
statements<br />
86<br />
<strong>Annual</strong> <strong>Report</strong> <strong>2009</strong> <strong>Evonik</strong> <strong>Industries</strong><br />
◂ ◂ ◂ ◂<br />
◂ ◂ ◂ ◂ ◂ ◂ ◂ ◂ ◂ ◂ ◂ ◂ ◂ ◂ ◂ ◂ ◂ ◂ ◂ ◂ ◂ ◂ ◂ ◂ ◂ ◂<br />
◂ ◂ ◂ ◂ ◂ ◂ ◂ ◂ ◂ ◂ ◂ ◂ ◂ ◂ ◂ ◂ ◂ ◂ ◂ ◂ ◂ ◂ ◂ ◂ ◂ ◂<br />
◂ ◂ ◂ ◂ ◂ ◂ ◂ ◂ ◂ ◂ ◂ ◂ ◂ ◂ ◂ ◂ ◂ ◂ ◂ ◂ ◂ ◂ ◂ ◂ ◂ ◂ ◂ ◂ ◂ ◂ ◂ ◂ ◂ ◂ ◂ ◂ ◂ ◂ ◂ ◂◂ ◂ ◂ ◂ ◂ ◂ ◂ ◂ ◂ ◂ ◂ ◂ ◂ ◂ ◂ ◂ ◂ ◂ ◂◂ ◂ ◂ ◂ ◂ ◂ ◂ ◂ ◂ ◂ ◂ ◂ ◂ ◂ ◂ ◂ ◂ ◂ ◂ ◂ ◂ ◂ ◂ ◂ ◂ ◂ ◂ ◂ ◂ ◂ ◂ ◂ ◂ ◂ ◂ ◂ ◂ ◂ ◂ ◂
Start Management report Consolidated financial statements Supplementary information<br />
◂ ◂◂ ◂ ◂ ◂ ◂ ◂ ◂ ◂ ◂ ◂ ◂ ◂ ◂ ◂ ◂ ◂ ◂ ◂ ◂ ◂ ◂ ◂ ◂ ◂ ◂ ◂ ◂ ◂◂ ◂ ◂ ◂ ◂ ◂ ◂ ◂ ◂ ◂ ◂ ◂ ◂ ◂ ◂ ◂ ◂ ◂◂ ◂ ◂ ◂ ◂ ◂ ◂ ◂ ◂ ◂ ◂ ◂ ◂ ◂ ◂ ◂ ◂ ◂ ◂ ◂ ◂<br />
88<br />
89<br />
◂ ◂ ◂ ◂ ◂ ◂◂ ◂ ◂ ◂ ◂ ◂◂◂<br />
90<br />
91<br />
Tour 3: Consolidated financial statements<br />
88 Income statement<br />
◂ ◂ ◂ ◂ ◂ ◂ ◂ ◂<br />
94<br />
89 Statement of comprehensive income<br />
90 Balance sheet<br />
91 Statement of changes in equity<br />
92 Cash flow statement<br />
Detailed overview: total length = 74 pages<br />
94 Notes<br />
94 Segment report<br />
96 General information<br />
96 Basis of preparation of the financial statements<br />
111 Discussion of assumptions and estimation uncertainties<br />
113 Changes in the <strong>Evonik</strong> Group<br />
118 Notes to the income statement<br />
122 Notes to the balance sheet<br />
141 Notes to the cash flow statement<br />
142 Notes on the segment report<br />
147 Other disclosures<br />
160 Disclosures in compliance with German legislation<br />
92<br />
<strong>Annual</strong> <strong>Report</strong> <strong>2009</strong> <strong>Evonik</strong> <strong>Industries</strong> 87<br />
◂ ◂ ◂ ◂ ◂ ◂ ◂ ◂ ◂ ◂ ◂ ◂ ◂ ◂ ◂ ◂ ◂ ◂ ◂ ◂ ◂ ◂ ◂ ◂ ◂ ◂ ◂ ◂ ◂ ◂ ◂ ◂ ◂ ◂ ◂ ◂◂ ◂ ◂ ◂ ◂ ◂ ◂ ◂ ◂ ◂ ◂ ◂ ◂ ◂ ◂ ◂ ◂ ◂ ◂ ◂ ◂ ◂ ◂◂ ◂ ◂ ◂ ◂ ◂ ◂ ◂ ◂ ◂ ◂ ◂ ◂ ◂ ◂ ◂ ◂ ◂ ◂ ◂ ◂ ◂ ◂ ◂ ◂
88<br />
Income statement<br />
<strong>Evonik</strong> Group<br />
in € million Note <strong>2009</strong> 2008<br />
Sales (6.1) 13,076 15,873<br />
Cost of sales −9,862 −12,384<br />
Gross profit on sales 3,214 3,489<br />
Selling expenses −1,044 −1,213<br />
Research and development expenses −300 −311<br />
General administrative expenses −638 −740<br />
Other operating income (6.2) 869 1,246<br />
Other operating expenses (6.3) −1,286 −1,659<br />
Income before financial result and income taxes, continuing operations 815 812<br />
Interest income (6.4) 39 76<br />
Interest expense (6.4) −522 −606<br />
Result from investments recognized at equity (6.5) 65 64<br />
Other financial income (6.6) 15 16<br />
Financial result −403 −450<br />
Income before income taxes, continuing operations 412 362<br />
Income taxes (6.7) −94 −128<br />
Income after taxes, continuing operations 318 234<br />
Income after taxes, discontinued operations (5.3) −6 117<br />
Income after taxes<br />
thereof attributable to<br />
Non-controlling interests<br />
Shareholders of <strong>Evonik</strong> <strong>Industries</strong> <strong>AG</strong> (net income)<br />
Earnings per share (basic and diluted) in € (10.1) +0.52 +0.60<br />
Prior-year figures restated.<br />
<strong>Annual</strong> <strong>Report</strong> <strong>2009</strong> <strong>Evonik</strong> <strong>Industries</strong><br />
312<br />
72<br />
240<br />
351<br />
70<br />
281
Start Management report Consolidated financial statements Supplementary information<br />
Income statement<br />
Statement of comprehensive income<br />
Statement of comprehensive income<br />
<strong>Evonik</strong> Group<br />
in € million Note <strong>2009</strong> 2008<br />
Income after taxes<br />
thereof attributable to<br />
Non-controlling interests<br />
Shareholders of <strong>Evonik</strong> <strong>Industries</strong> <strong>AG</strong> (net income)<br />
Unrealized gains/losses on available-for-sale-securities 4 −9<br />
Unrealized gains/losses on hedging instruments 81 −135<br />
Currency translation adjustment 6 −93<br />
Deferred taxes −13 45<br />
Other comprehensive income<br />
thereof attributable to<br />
Non-controlling interests<br />
Shareholders of <strong>Evonik</strong> <strong>Industries</strong> <strong>AG</strong><br />
Total comprehensive income<br />
thereof attributable to<br />
Non-controlling interests<br />
Shareholders of <strong>Evonik</strong> <strong>Industries</strong> <strong>AG</strong><br />
Prior-year figures restated.<br />
312<br />
72<br />
240<br />
(7.8) 78<br />
−17<br />
95<br />
390<br />
55<br />
335<br />
351<br />
70<br />
281<br />
−192<br />
9<br />
−201<br />
159<br />
79<br />
80<br />
<strong>Annual</strong> <strong>Report</strong> <strong>2009</strong> <strong>Evonik</strong> <strong>Industries</strong> 89
90<br />
Balance sheet<br />
<strong>Evonik</strong> Group<br />
in € million Note Dec. 31, <strong>2009</strong> Dec. 31, 2008 Jan. 1, 2008<br />
Intangible assets (7.1) 3,950 4,086 4,159<br />
Property, plant and equipment (7.2) 5,711 5,696 5,566<br />
Investment property (7.3) 1,554 1,502 1,503<br />
Investments recognized at equity (7.4) 626 604 619<br />
Financial assets (7.4) 1,140 1,385 1,302<br />
Deferred tax assets (7.13) 392 364 383<br />
Other income tax assets (7.13) 40 36 29<br />
Other receivables (7.6) 56 73 91<br />
Non-current assets 13,469 13,746 13,652<br />
Inventories (7.5) 1,590 2,196 1,806<br />
Other income tax assets (7.13) 159 130 44<br />
Trade accounts receivable (7.6) 2,148 2,572 2,372<br />
Other receivables (7.6) 356 399 406<br />
Financial assets (7.4) 300 330 488<br />
Cash and cash equivalents (7.7) 885 536 319<br />
<strong>Annual</strong> <strong>Report</strong> <strong>2009</strong> <strong>Evonik</strong> <strong>Industries</strong><br />
5,438 6,163 5,435<br />
Assets held for sale (5.3) − 206 732<br />
Current assets 5,438 6,369 6,167<br />
Total assets 18,907 20,115 19,819<br />
Issued capital 466 466 466<br />
Reserves 4,262 4,208 4,135<br />
Equity attributable to shareholders of <strong>Evonik</strong> <strong>Industries</strong> <strong>AG</strong> 4,728 4,674 4,601<br />
Equity attributable to non-controlling interests 486 481 437<br />
Total equity (7.8) 5,214 5,155 5,038<br />
Provisions for pensions and other post-employment benefits (7.9) 3,979 3,953 3,956<br />
Other provisions (7.10) 1,091 1,064 1,099<br />
Deferred tax liabilities (7.13) 626 687 761<br />
Other income tax liabilities (7.13) 61 120 191<br />
Financial liabilities (7.11) 4,040 4,394 3,752<br />
Other payables (7.12) 395 384 397<br />
Non-current liabilities 10,192 10,602 10,156<br />
Other provisions (7.10) 1,061 1,272 1,188<br />
Other income tax liabilities (7.13) 251 197 206<br />
Financial liabilities (7.11) 455 1,008 942<br />
Trade accounts payable (7.12) 1,365 1,463 1,294<br />
Other payables (7.12) 369 332 516<br />
3,501 4,272 4,146<br />
Liabilities associated with assets held for sale (5.3) − 86 479<br />
Current liabilities 3,501 4,358 4,625<br />
Total equity and liabilities 18,907 20,115 19,819<br />
Prior-year figures restated.
Start Management report Consolidated financial statements Supplementary information<br />
Balance sheet<br />
Statement of changes in equity<br />
Statement of changes in equity<br />
<strong>Evonik</strong> Group Note (7.8)<br />
in € million<br />
Issued<br />
capital Reserves<br />
Capital<br />
reserve<br />
Accumulated<br />
income/loss<br />
after taxes<br />
Accumulated<br />
other comprehensive<br />
income<br />
Attributable to<br />
shareholders<br />
of <strong>Evonik</strong><br />
<strong>Industries</strong> <strong>AG</strong><br />
Attributable<br />
to non-<br />
controlling<br />
interests Total equity<br />
As of December 31, 2007 466 1,165 3,324 −311 4,644 437 5,081<br />
Adjustments according to IAS 8 −43 −43 −43<br />
As of January 1, 2008 466 1,165 3,281 −311 4,601 437 5,038<br />
Capital increases/ decreases 0 19 19<br />
Dividend distribution 0 −40 −40<br />
Total comprehensive income 281 −201 80 79 159<br />
Other changes 0 −7 −7 −14 −21<br />
As of December 31, 2008 466 1,165 3,562 −519 4,674 481 5,155<br />
Capital increases/ decreases 0 8 8<br />
Dividend distribution −280 −280 −61 −341<br />
Total comprehensive income 240 95 335 55 390<br />
Other changes 3 −4 −1 3 2<br />
As of December 31, <strong>2009</strong> 466 1,165 3,525 −428 4,728 486 5,214<br />
Prior-year figures restated.<br />
<strong>Annual</strong> <strong>Report</strong> <strong>2009</strong> <strong>Evonik</strong> <strong>Industries</strong> 91
92<br />
Cash flow statement<br />
<strong>Evonik</strong> Group<br />
in € million Note <strong>2009</strong> 2008<br />
Income before financial result and income taxes, continuing operations 815 812<br />
Depreciation, amortization, impairment losses/reversal of<br />
impairment losses on non-current assets 913 1,119<br />
Gains/losses on disposal of non-current assets −19 −182<br />
Other non-cash income/expense − 34<br />
Change in inventories 610 −434<br />
Change in trade accounts receivable 424 −218<br />
Change in trade accounts payable and<br />
current advance payments received from customers −99 188<br />
Change in provisions for pensions and other post-employment benefits −216 −185<br />
Change in other provisions −178 −4<br />
Change in miscellaneous assets/liabilities 196 −285<br />
Cash outflows for interest −287 −223<br />
Cash inflows from interest 88 23<br />
Cash inflows from dividends 74 42<br />
Cash outflows for income taxes −229 −306<br />
Cash flow from operating activities, continuing operations 2,092 381<br />
Cash flow from operating activities, discontinued operations − 7<br />
Cash flow from operating activities (8.1) 2,092 388<br />
Cash outflows for investments in intangible assets, property, plant and<br />
equipment, investment property −809 −1,165<br />
Cash outflows for investments in shareholdings −25 −84<br />
Cash inflows from divestments of intangible assets, property, plant and<br />
equipment, investment property 70 131<br />
Cash inflows from divestments of shareholdings 126 330<br />
Cash inflows/outflows relating to securities, deposits and loans 6 233<br />
Cash flow from investing activities (8.2) −632 −555<br />
Cash inflows/outflows relating to capital contributions 8 19<br />
Cash outflows for payments to non-controlling interests1) −61 −35<br />
Cash outflows for dividends/profit transfer for prior year2) −280 −345<br />
Cash inflows from the addition of financial liabilities 1,226 983<br />
Cash outflows for repayment of financial liabilities −2,006 −266<br />
Cash flow from financing activities −1,113 356<br />
Change in cash and cash equivalents 347 189<br />
Cash and cash equivalents as of January 1 542 349<br />
Change in cash and cash equivalents 347 189<br />
Changes in exchange rates and other changes in cash and cash equivalents −4 4<br />
Cash and cash equivalents as of December 31 (8.3) 885 542<br />
Cash and cash equivalents included in assets held for sale − −6<br />
Cash and cash equivalents as reported on the balance sheet as of December 31 (7.7) 885 536<br />
Prior-year figures restated.<br />
1) In 2008, €5 million were not paid out.<br />
2) Profit transfer for prior year without tax charge (stand-alone view). − −342<br />
<strong>Annual</strong> <strong>Report</strong> <strong>2009</strong> <strong>Evonik</strong> <strong>Industries</strong>
Start Management report Consolidated financial statements Supplementary information<br />
Cash flow statement<br />
<strong>Annual</strong> <strong>Report</strong> <strong>2009</strong> <strong>Evonik</strong> <strong>Industries</strong> 93
94<br />
Notes to the consolidated financial statements<br />
of <strong>Evonik</strong> <strong>Industries</strong> <strong>AG</strong> for <strong>2009</strong><br />
(1) Segment report<br />
<strong>Evonik</strong> Group by operating segments Note (9.1)<br />
<strong>Annual</strong> <strong>Report</strong> <strong>2009</strong> <strong>Evonik</strong> <strong>Industries</strong><br />
Chemicals Energy<br />
in € million <strong>2009</strong> 2008 <strong>2009</strong> 2008<br />
External sales 9,978 11,762 2,558 3,399<br />
Internal sales 90 116 57 87<br />
Total sales 10,068 11,878 2,615 3,486<br />
EBITDA (before non-operating result) 1,602 1,626 418 517<br />
EBITDA margin in % 16.1 13.8 16.3 15.2<br />
Depreciation and amortization −639 −674 −86 −89<br />
Result from investments recognized at equity 14 23 9 5<br />
EBIT (before non-operating result) 932 941 326 415<br />
Non-operating result −234 −366 −16 63<br />
Operating income 698 575 310 478<br />
Capital employed as of December 31 8,596 9,359 3,284 3,462<br />
Capital employed (on average) 9,071 9,477 3,355 3,152<br />
ROCE in % 10.3 9.9 9.7 13.2<br />
Investments recognized at equity 121 115 61 57<br />
Capital expenditures 502 727 280 328<br />
Additions to financial assets 17 108 14 19<br />
Other significant non-cash income and expenses −868 −989 −109 −187<br />
Employees as of December 31 29,723 31,728 4,820 4,702<br />
<strong>Evonik</strong> Group by regions Note (9.2)<br />
Germany Rest of Europe North America<br />
in € million <strong>2009</strong> 2008 <strong>2009</strong> 2008 <strong>2009</strong> 2008<br />
External sales 4,806 6,310 3,150 3,751 1,897 2,306<br />
Goodwill1) 2,088 2,087 548 546 286 297<br />
Other intangible assets,<br />
property, plant and<br />
equipment, investment<br />
property1) 6,058 6,052 592 634 549 617<br />
Capital expenditures 568 766 80 76 41 87<br />
Additions to financial<br />
assets 34 107 5 16 2 0<br />
Employees<br />
as of December 31 25,447 27,114 3,527 3,682 3,471 3,723<br />
Prior-year figures restated.<br />
1) Non-current assets according to IFRS 8.33 b.
Start Management report Consolidated financial statements Supplementary information<br />
Real Estate Total reportable segments<br />
Segment report<br />
Corporate, other operations,<br />
consolidation<br />
Total Group<br />
(continuing operations)<br />
<strong>2009</strong> 2008 <strong>2009</strong> 2008 <strong>2009</strong> 2008 <strong>2009</strong> 2008<br />
378 375 12,914 15,536 162 337 13,076 15,873<br />
0 0 147 203 −147 −203 − −<br />
378 375 13,061 15,739 15 134 13,076 15,873<br />
183 217 2,203 2,360 −178 −195 2,025 2,165<br />
48.4 57.9 17.1 15.2 15.5 13.6<br />
−45 −44 −770 −807 −28 −35 −798 −842<br />
36 33 59 61 6 3 65 64<br />
135 162 1,393 1,518 −199 −220 1,194 1,298<br />
−2 0 −252 −303 −47 −103 −299 −406<br />
133 162 1,141 1,215 −246 −323 895 892<br />
1,892 1,835 13,772 14,656 −91 −8 13,681 14,648<br />
1,843 1,762 14,269 14,391 8 13 14,277 14,404<br />
7.3 9.2 9.8 10.5 8.4 9.0<br />
443 432 625 604 1 0 626 604<br />
57 87 839 1,142 10 18 849 1,160<br />
− 12 31 139 11 10 42 149<br />
−14 −13 −991 −1,189 −121 −240 −1,112 −1,429<br />
479 443 35,022 36,873 3,659 3,894 38,681 40,767<br />
Asia Central and South America Other<br />
Total Group<br />
(continuing operations)<br />
<strong>2009</strong> 2008 <strong>2009</strong> 2008 <strong>2009</strong> 2008 <strong>2009</strong> 2008<br />
2,452 2,664 535 589 236 253 13,076 15,873<br />
217 224 24 25 21 21 3,184 3,200<br />
711 686 97 80 24 15 8,031 8,084<br />
151 221 3 5 6 5 849 1,160<br />
1 26 0 0 − − 42 149<br />
5,534 5,542 464 466 238 240 38,681 40,767<br />
<strong>Annual</strong> <strong>Report</strong> <strong>2009</strong> <strong>Evonik</strong> <strong>Industries</strong> 95
96<br />
(2) General information<br />
<strong>Evonik</strong> <strong>Industries</strong> <strong>AG</strong> is an international corporation based in Germany operating in the Chemicals, Energy<br />
and Real Estate Business Areas; see Notes (1) and (9). The company’s registered office is Rellinghauser<br />
Straße 1–11, Essen (Germany), and it is registered in the Commercial Register at Essen District Court under<br />
HRB No. 19474.<br />
<strong>Evonik</strong> <strong>Industries</strong> <strong>AG</strong> is a subsidiary of R<strong>AG</strong>-Stiftung, Essen (Germany), which directly and indirectly holds<br />
74.99 percent of the shares in <strong>Evonik</strong> <strong>Industries</strong> <strong>AG</strong>. As a subsidiary of R<strong>AG</strong>-Stiftung, <strong>Evonik</strong> <strong>Industries</strong> <strong>AG</strong><br />
and its subsidiaries are included at equity in the annual consolidated financial statements prepared by R<strong>AG</strong>-<br />
Stiftung in accordance with the German Commercial Code (HGB). The consolidated financial statements of<br />
R<strong>AG</strong>-Stiftung are published in the electronic Federal Gazette.<br />
The present consolidated financial statements of <strong>Evonik</strong> <strong>Industries</strong> <strong>AG</strong> and its subsidiaries (referred<br />
to jointly as “<strong>Evonik</strong>” or the “Group”) were approved for publication by the Executive Board of <strong>Evonik</strong><br />
<strong>Industries</strong> <strong>AG</strong> as of the date of signature. These consolidated financial statements are also published in the<br />
electronic Federal Gazette.<br />
(3) Basis of preparation of the financial statements<br />
(3.1) Compliance with IFRS<br />
As permitted by Section 315 a Paragraph 3 of the German Commercial Code, the present consolidated<br />
financial statements have been prepared on the basis of the International Financial <strong>Report</strong>ing Standards<br />
(IFRS) and comply with these standards. The IFRS comprise the International Financial <strong>Report</strong>ing Standards<br />
and International Accounting Standards (IAS) adopted by the International Accounting Standards Board<br />
(IASB), London (UK) and the interpretations of the International Financial <strong>Report</strong>ing Interpretations Committee<br />
(IFRIC), as adopted by the European Union. Additional disclosures are made in accordance with<br />
national regulations pursuant to Section 315 a Paragraph 1 of the German Commercial Code.<br />
(3.2) Presentation of the financial statements<br />
The consolidated financial statements cover the period from January 1 to December 31, <strong>2009</strong> and are presented<br />
in euros. All amounts are stated in millions of euros (€ million) except where otherwise indicated.<br />
The recognition and valuation principles and items presented in the consolidated financial statements are<br />
in principle consistent from one period to the next. Deviations from this principle are outlined in Note (3.4).<br />
To enhance the clarity of presentation, some items are combined in the income statement, statement of comprehensive<br />
income, balance sheet and statement of changes in equity and explained in detail in the Notes.<br />
The income statement has been prepared for the first time using the cost-of-sales method. Expenses are<br />
divided by function, see Note (3.4). The new statement of comprehensive income contains income after<br />
taxes as shown on the income statement and all other comprehensive income as outlined in Note (3.3). Assets<br />
and liabilities are classified by maturity. They are classified as current if they are due or expected to be<br />
realized within twelve months from the reporting date. The statement of changes in equity shows changes<br />
in the issued capital, reserves attributable to shareholders of <strong>Evonik</strong> <strong>Industries</strong> <strong>AG</strong> and changes in noncontrolling<br />
interests in the reporting period. Transactions with shareholders in their capacity as owners are<br />
also shown separately here. The cash flow statement provides information on the Group’s cash flows. The<br />
cash flow from operating activities is calculated using the indirect method. The Notes contain basic information<br />
on the financial statements, supplementary information on the above components of the financial<br />
statements and further information such as the segment report.<br />
<strong>Annual</strong> <strong>Report</strong> <strong>2009</strong> <strong>Evonik</strong> <strong>Industries</strong>
Start Management report Consolidated financial statements Supplementary information<br />
(3.3) Newly issued IFRS<br />
General information<br />
Basis of preparation of the financial statements<br />
Accounting standards applied for the first time<br />
The IASB has revised or issued a number of standards and interpretations. These have been officially adopted<br />
into European law by the European Union and became mandatory for the first time in fiscal <strong>2009</strong> or were<br />
applied by <strong>Evonik</strong> voluntarily before they became mandatory. The following new accounting standards<br />
applied for the first time in fiscal <strong>2009</strong> impact the consolidated financial statements:<br />
In July 2007 the IASB published interpretation IFRIC 14 IAS 19: The Limit on a Defined Benefit Asset,<br />
Minimum Funding Requirements and their Interaction. This interpretation clarifies the valuation of the asset<br />
ceiling for plan assets and defined benefit obligations and any statutory or contractual minimum funding<br />
requirements for company pension plans as of the reporting date. Resulting changes in valuation must be<br />
undertaken retrospectively. The impact of this interpretation on <strong>Evonik</strong>’s consolidated financial statements<br />
is set out in Note (3.4).<br />
In September 2007 the IASB published a revised version of IAS 1 Presentation of Financial Statements.<br />
The most important change comprises the separate presentation of changes in equity that do not relate to<br />
transactions with the company’s shareholders. These must be presented in one statement of comprehensive<br />
income or as two statements, a separate income statement and a statement of comprehensive income.<br />
<strong>Evonik</strong> presents this information in two separate statements. Further, a company is required to present an<br />
additional balance sheet as of the start of the earliest comparative period if an accounting policy is applied<br />
retrospectively or the items in the statements are restated or reclassified retrospectively. First-time application<br />
of the revised standard only influences the presentation of the financial statements, not the Group’s<br />
net assets, financial position and results of operations.<br />
Further, in March <strong>2009</strong> the IASB published an amendment to IFRS 7 Financial Instruments: Disclosures.<br />
This sets out a three-level hierarchy for measuring the fair value of each class of financial instruments and<br />
extends the required disclosures. In addition, it details and extends the information on liquidity risk. Firsttime<br />
application of the revised standard influences the information provided in the Notes to the financial<br />
statements, but not the Group’s net assets, financial position and results of operations.<br />
Other accounting standards applied for the first time that do not have a significant impact on <strong>Evonik</strong>’s<br />
consolidated financial statements:<br />
• Amendments to IFRS 1 First-time Adoption of International Financial <strong>Report</strong>ing Standards and IAS 27<br />
Consolidated and Separate Financial Statements: Cost of an Investment in a Subsidiary, Jointly-Controlled<br />
Entity or Associate<br />
• Revised version of IFRS 1 First-time Adoption of International Financial <strong>Report</strong>ing Standards<br />
• Amendment to IFRS 2 Share-Based Payment: Vesting Conditions and Cancellations<br />
• Revised version of IAS 23: Borrowing Costs<br />
• Changes to IAS 32 Financial Instruments: Presentation and IAS 1 Presentation of Financial Statements:<br />
Puttable Financial Instruments and Obligations Arising on Liquidation<br />
• <strong>Annual</strong> improvements process 2008 Improvements to IFRSs<br />
• Amendments to IFRIC 9 Reassessment of Embedded Derivatives and IAS 39 Financial Instruments:<br />
Recognition and Measurement: Embedded Derivatives<br />
• IFRIC 12 Service Concession Arrangements<br />
• IFRIC 13 Customer Loyalty Programmes<br />
• IFRIC 15 Agreements for the Construction of Real Estate<br />
• IFRIC 16 Hedges of a Net Investment in a Foreign Operation.<br />
<strong>Annual</strong> <strong>Report</strong> <strong>2009</strong> <strong>Evonik</strong> <strong>Industries</strong> 97
98<br />
Accounting standards that are not yet mandatory<br />
The IASB adopted further accounting standards up to December 31, <strong>2009</strong> which did not become mandatory<br />
in the fiscal year or have not yet been officially adopted by the European Union. These new accounting standards<br />
will probably be applied for the first time—insofar as they are relevant for the Group’s consolidated<br />
financial statements—from the date on which they come into force.<br />
In January 2008 the IASB published the revised standards IFRS 3 Business Combinations and IAS 27<br />
Consolidated and Separate Financial Statements as part of the convergence project with the Financial<br />
Accounting Standards Board (FASB) Business Combinations Phase II. The principal amendments to IFRS 3<br />
relate to the recognition of goodwill relating to non-controlling interests, accounting for existing shares in<br />
a business combination in the case of acquisitions made in stages, the recognition in income of the ancillary<br />
costs of a business combination and the reflection of variable purchase price components. The amendments<br />
to IAS 27 address, among other things, the presentation of the divestment of shares in subsidiaries with no<br />
loss of control as equity transactions between owners and the recognition and valuation of the remaining<br />
shares in subsidiaries where the divestment of shares involves a loss of control. Further, there is now no limit<br />
on the attribution of losses to non-controlling interests. The revised standards are applicable for fiscal years<br />
starting on or after July 1, <strong>2009</strong>. Joint application of both standards at an earlier date is permitted. The revised<br />
standards are relevant for <strong>Evonik</strong>’s consolidated financial statements.<br />
In July 2008 the IASB published an amendment to IAS 39 Financial Instruments: Recognition and Measurement<br />
relating to the permitted hedged items in a hedging relationship. The standard outlines the conditions<br />
under which the risk of inflation relating to the hedged item can be designated for hedge accounting<br />
and the possibility of using options to hedge one-sided risks. In particular, it clarifies that only the intrinsic<br />
value of the option, not the full value, comprising the intrinsic value and the time value, can be designated<br />
as a hedge. The revised standard is applicable retrospectively for fiscal years beginning on or after July 1,<br />
<strong>2009</strong>. Earlier application is permitted. The amended standard will not have a material impact on <strong>Evonik</strong>’s<br />
consolidated financial statements.<br />
In November 2008 the IASB published IFRIC 17 Distributions of Non-cash Assets to Owners. This new<br />
interpretation addresses accounting for non-cash dividends distributed to shareholders and is applicable<br />
for fiscal years beginning on or after July 1, <strong>2009</strong>. Earlier application is permitted. This interpretation is not<br />
currently relevant for <strong>Evonik</strong>’s consolidated financial statements.<br />
In January <strong>2009</strong> the IASB published IFRIC 18 Transfer of Assets from Customers. This interpretation<br />
addresses the treatment of agreements where companies receive from a customer an asset or financing for<br />
an asset to connect the customer to a network or provide the customer with ongoing access to a supply of<br />
goods or services such as the supply of electricity, gas or water. This interpretation must be applied for<br />
fiscal years beginning on or after October 31, <strong>2009</strong>. Earlier application is permitted. The impact on <strong>Evonik</strong>’s<br />
consolidated financial statements is currently being examined.<br />
As part of its second annual improvements process, in April <strong>2009</strong> the IASB published Improvements to<br />
IFRSs containing amendments to a variety of IFRSs. The project makes minor, non-urgent but necessary<br />
amendments to existing standards, which are not addressed in another, major project. The amended standards<br />
are generally applicable for fiscal years starting on or after January 1, 2010. Earlier application is permitted.<br />
The impact on <strong>Evonik</strong>’s consolidated financial statements is currently being examined.<br />
<strong>Annual</strong> <strong>Report</strong> <strong>2009</strong> <strong>Evonik</strong> <strong>Industries</strong>
Start Management report Consolidated financial statements Supplementary information<br />
Basis of preparation of the financial statements<br />
In June <strong>2009</strong> the IASB published the revised standard IFRS 2 Share-based Payment. The amendment clarifies<br />
how to account for certain share-based remuneration agreements where an entity receives goods or<br />
services from employees or suppliers under such an agreement but they are paid for by a different entity in<br />
the group. The revised standard is applicable retrospectively for fiscal years beginning on or after January 1,<br />
2010. Earlier application is permitted. This amendment is not currently relevant for <strong>Evonik</strong>’s consolidated<br />
financial statements.<br />
In July <strong>2009</strong> the IASB published the revised standard IFRS 1 First-time Adoption of International Financial<br />
<strong>Report</strong>ing Standards. This further simplifies the standard, exempting first-time adopters from retrospective<br />
application of certain aspects of IFRS 6 Exploration for and Evaluation of Mineral Resources and from reassessing<br />
the classification as set out in IFRIC 4 Determining whether an Arrangement contains a Lease. The<br />
revised standard is applicable for fiscal years beginning on or after January 1, 2010. Earlier application is permitted.<br />
This amendment is not relevant for <strong>Evonik</strong>’s consolidated financial statements.<br />
In October <strong>2009</strong> the IASB published the revised standard IAS 32 Financial Instruments: Presentation. If a<br />
company issues subscription rights, options or warrants to acquire a fixed number of its shares in a currency<br />
other than its functional currency, such rights previously had to be accounted for as financial liabilities. In<br />
future such rights, insofar as they are issued for a fixed amount of any currency, will be recognized as equity<br />
instruments if the entity offers them pro rata to all existing holders of the same class of its equity. The revised<br />
standard is applicable retrospectively for fiscal years beginning on or after February 1, 2010. Earlier application<br />
is permitted. The impact on <strong>Evonik</strong>’s consolidated financial statements is currently being examined.<br />
In November <strong>2009</strong> the IASB published the revised standard IAS 24 Related Party Disclosures. This<br />
contains simplifications for government-related entities and improves the definition of a related party. The<br />
revised standard is applicable for fiscal years beginning on or after January 1, 2011. Earlier application is permitted.<br />
The impact on <strong>Evonik</strong>’s consolidated financial statements is currently being examined.<br />
In November <strong>2009</strong> the IASB published the revised standard IFRS 9 Financial Instruments. This standard<br />
is part of a project for a new standard to replace IAS 39 Financial Instruments: Recognition and Measurement.<br />
It is concerned exclusively with the classification and measurement of financial assets. IFRS 9 replaces the<br />
former valuation categories with the categories “at amortized cost” or “at fair value”. The decision on whether<br />
to carry an instrument “at amortized cost” depends on the one hand on the entity’s business model and on<br />
the other on the contractually agreed cash flows from the financial instrument. Instruments that do not meet<br />
the criteria for measurement “at amortized cost” are recognized in income “at fair value”. Recognition of<br />
assets at fair value in other comprehensive income is permitted for selected equity instruments. The revised<br />
standard is applicable retrospectively for fiscal years beginning on or after January 1, 2013. Earlier application<br />
is permitted. The impact on <strong>Evonik</strong>’s consolidated financial statements is currently being examined.<br />
Further, in November <strong>2009</strong> the IASB published the amended interpretation IFRIC 14 IAS 19: The Limit<br />
on a Defined Benefit Asset, Minimum Funding Requirements and their Interaction. This amendment<br />
addresses the measurement of prepayments of minimum funding requirements as assets. This interpretation<br />
is applicable for fiscal years beginning on or after December 31, 2010. Earlier application is permitted. The<br />
amended interpretation is not currently relevant for <strong>Evonik</strong>’s consolidated financial statements.<br />
In November <strong>2009</strong> the IASB also published IFRIC 19 Extinguishing Financial Liabilities with Equity Instruments,<br />
which explains the conditions permitting an entity to fully or partially extinguish a financial liability<br />
through the issuance of shares or other equity instruments. This interpretation is applicable for fiscal years<br />
beginning on or after July 1, 2010. Earlier application is permitted. This interpretation is not currently relevant<br />
for <strong>Evonik</strong>’s consolidated financial statements.<br />
<strong>Annual</strong> <strong>Report</strong> <strong>2009</strong> <strong>Evonik</strong> <strong>Industries</strong> 99
100<br />
(3.4) Restatement of prior-year figures<br />
An enterprise may only alter its recognition and valuation principles or the items stated in prior years if this<br />
is required due to a standard or interpretation or results in the disclosure of more relevant information in the<br />
financial statements. Such changes must generally also be presented retroactively for the prior period. For<br />
the present consolidated financial statements, the following prior-year figures have been restated:<br />
Restatements due to IFRIC 14<br />
IFRIC 14 IAS 19: The Limit on a Defined Benefit Asset, Minimum Funding Requirements and their Interaction<br />
became applicable in fiscal <strong>2009</strong>, see Note (3.3). This resulted in the restatement of prior-year figures on the<br />
balance sheet and income statement.<br />
Further changes<br />
<strong>Evonik</strong> has prepared its income statement for fiscal <strong>2009</strong> for the first time using the cost-of-sales method<br />
instead of the total cost format. The Executive Board of <strong>Evonik</strong> <strong>Industries</strong> <strong>AG</strong> is of the opinion that it provides<br />
more relevant data by adopting this more customary international presentation.<br />
Restated prior-year figures<br />
Income statement<br />
in € million<br />
<strong>Annual</strong> <strong>Report</strong> <strong>2009</strong> <strong>Evonik</strong> <strong>Industries</strong><br />
2008<br />
restated IFRIC 14<br />
2008<br />
before<br />
restatement<br />
Sales 15,873 15,873<br />
Cost of sales −12,384 −12,384<br />
Gross profit on sales 3,489 0 3,489<br />
Selling expenses −1,213 −1,213<br />
Research and development expenses −311 −311<br />
General administrative expenses −740 −740<br />
Other operating income 1,246 1,246<br />
Other operating expenses −1,659 −6 −1,653<br />
Interest income 76 76<br />
Interest expense −606 −606<br />
Result from investments recognized at equity 64 64<br />
Other financial income 16 16<br />
Income taxes −128 2 −130<br />
Income after taxes, continuing operations 234 −4 238<br />
Income after taxes, discontinued operations 117 117<br />
Income after taxes<br />
thereof attributable to<br />
Non-controlling interests<br />
Shareholders of <strong>Evonik</strong> <strong>Industries</strong> <strong>AG</strong> (net income)<br />
Earnings per share (basic and diluted) in € +0.60 −0.01 +0.61<br />
351<br />
70<br />
281<br />
−4<br />
−4<br />
355<br />
70<br />
285
Start Management report Consolidated financial statements Supplementary information<br />
Balance sheet (extract)<br />
in € million<br />
Basis of preparation of the financial statements<br />
Dec. 31, 2008<br />
restated IFRIC 14<br />
Dec. 31, 2008<br />
before<br />
restatement<br />
Deferred taxes 364 16 348<br />
Miscellaneous 19,751 19,751<br />
Total assets 20,115 16 20,099<br />
Equity 5,155 −37 5,192<br />
Provisions for pensions and other post-employment benefits 3,953 53 3,900<br />
Miscellaneous 11,007 11,007<br />
Total equity and liabilities 20,115 16 20,099<br />
Balance sheet (extract)<br />
in € million<br />
Jan. 1, 2008<br />
restated IFRIC 14<br />
Dec. 31, 2007<br />
before<br />
restatement<br />
Deferred taxes 383 19 364<br />
Miscellaneous 19,436 19,436<br />
Total assets 19,819 19 19,800<br />
Equity 5,038 −43 5,081<br />
Provisions for pensions and other post-employment benefits 3,956 62 3,894<br />
Miscellaneous 10,825 10,825<br />
Total equity and liabilities 19,819 19 19,800<br />
(3.5) Consolidation methods and scope of consolidation<br />
Scope of consolidation<br />
Alongside <strong>Evonik</strong> <strong>Industries</strong> <strong>AG</strong>, the consolidated financial statements include all material German and foreign<br />
subsidiaries directly or indirectly controlled by <strong>Evonik</strong> <strong>Industries</strong> <strong>AG</strong>. Material associated companies and joint<br />
ventures are recognized using the equity method if <strong>Evonik</strong> is able to exert a significant influence. Initial consolidation<br />
or deconsolidation takes place as of the date on which <strong>Evonik</strong> gains or loses control.<br />
Investments that do not have a material influence on the assets, financial position and earnings of the Group,<br />
either individually or in aggregate, are not included in the scope of consolidation. Instead they are recognized<br />
in accordance with IAS 39 Financial Instruments: Recognition and Measurement.<br />
Changes in the scope of consolidation are outlined in Notes (5.1) and (5.2). An overview of the major<br />
consolidated subsidiaries and companies recognized at equity can be found at the end of this annual report.<br />
Consolidation methods<br />
The financial statements of the consolidated German and foreign subsidiaries are prepared using uniform<br />
accounting and valuation principles.<br />
Capital is consolidated at the time of acquisition by offsetting the carrying amount of the business acquired<br />
against the pro rata revalued equity of the subsidiary. The assets, liabilities and contingent liabilities (net<br />
assets) of the subsidiary are included at their fair values. If shares in the subsidiary are held before acquiring<br />
control, the fair value of the net assets may have altered over time. Every change in relation to the shares<br />
previously held is treated as a revaluation and recognized separately in equity in the revaluation surplus.<br />
Any remaining excess of the acquisition cost over the fair value of the net assets is recognized as goodwill.<br />
<strong>Annual</strong> <strong>Report</strong> <strong>2009</strong> <strong>Evonik</strong> <strong>Industries</strong> 101
102<br />
Negative differences are included in income following a renewed examination of the fair value of the net<br />
assets. In the deconsolidation process the carrying amounts of capitalized goodwill are taken into account<br />
when calculating the gain or loss on the transaction.<br />
Where further shares in a fully consolidated subsidiary are acquired, the additional acquisition costs are<br />
offset against the former non-controlling interests. Any remaining excess of the acquisition cost over the<br />
fair value of the net assets is capitalized as goodwill. Since such cases are not covered by any reporting<br />
standard, the Executive Board of <strong>Evonik</strong> <strong>Industries</strong> <strong>AG</strong> has selected this accounting method after weighing<br />
up all relevant circumstances.<br />
Intergroup income and expenses, profits, losses, receivables and liabilities between consolidated subsidiaries<br />
are eliminated. Write-downs on shares in such companies recognized in the separate financial statements<br />
are reversed.<br />
The same consolidation principles apply for companies accounted for using the equity method; however,<br />
any goodwill is recognized in the carrying amount of the investment. The financial statements of the companies<br />
recognized at equity are prepared using uniform accounting and valuation principles.<br />
(3.6) Currency translation<br />
Foreign currency transactions are measured at the exchange rate at the date of initial recognition. Any gains<br />
or losses resulting from the valuation of monetary assets and liabilities in foreign currencies as of the reporting<br />
date are recognized in other operating income or other operating expenses.<br />
The functional currency method is used to translate the financial statements of foreign subsidiaries. In the<br />
consolidated financial statements, the balance sheets of all foreign subsidiaries are translated from the functional<br />
currency of the company into euros at closing rates on the reporting date, since they conduct their<br />
business independently in their functional currency. The equity of foreign companies recognized at equity is<br />
translated in the same way. As an asset pertaining to an economically autonomous foreign operation, goodwill<br />
is translated at the closing rate. Income and expense items are translated at average exchange rates for<br />
the year. The average annual exchange rates comprise the mean of the exchange rates at month-end over<br />
the past 13 months. Translation differences compared to the prior year and translation differences between<br />
the income statement and balance sheet are recognized in other comprehensive income.<br />
The following exchange rates were used for currency translation:<br />
€1 corresponds to<br />
<strong>Annual</strong> <strong>Report</strong> <strong>2009</strong> <strong>Evonik</strong> <strong>Industries</strong><br />
<strong>Annual</strong> average exchange rates Closing rates<br />
<strong>2009</strong> 2008 Dec. 31, <strong>2009</strong> Dec. 31, 2008<br />
Brazilian real (BRL) 2.80 2.66 2.51 3.23<br />
British pound (GBP) 0.89 0.80 0.89 0.95<br />
Chinese renminbi yuan (CNY) 9.53 10.25 9.84 9.50<br />
Japanese yen (JPY) 130.28 152.57 133.16 126.14<br />
Swiss franc (CHF) 1.51 1.58 1.48 1.49<br />
US dollar (USD) 1.40 1.47 1.44 1.39
Start Management report Consolidated financial statements Supplementary information<br />
(3.7) Accounting policies<br />
Basis of preparation of the financial statements<br />
Revenue recognition<br />
Revenues from the sale of goods and services that constitute part of the company’s normal business activity<br />
and other revenues are recognized as follows:<br />
(a) Sales<br />
The Chemicals Business Area mainly generates sales by selling specialty chemicals to industrial customers<br />
for further processing.<br />
The Energy Business Area mainly generates sales revenues through the operation of power plants in<br />
Germany and abroad, the operation of energy supply facilities based on renewable energy resources, coal<br />
trading and the marketing of related products and services. Where the customer bears substantially all risks<br />
and benefits arising from the ownership of the energy generating facilities, revenues are recognized as finance<br />
leases. The interest component of finance leases is also included in this item.<br />
The Real Estate Business Area’s sales principally comprise revenues from the letting, administration and<br />
running of residential property, the construction of houses and apartment blocks for third parties and the sale<br />
of residential units. Properties held with a view to sale are reclassified to inventories. Utility charges and<br />
heating costs that can be charged to tenants are offset against prepayments received from tenants for such<br />
services and immediately recognized as sales.<br />
The following comments on revenue recognition apply to all business areas:<br />
Prices are contractually agreed between the parties to a transaction. Sales revenues are measured as the<br />
fair value of the consideration received or to be received less value-added tax and any discounts or bulk<br />
rebates granted. The general principle for revenue recognition is that both the revenues and the related<br />
costs can be measured reliably. It must also be sufficiently probable that the economic benefit will flow to<br />
the company.<br />
Revenues from the sale of goods are recognized, assuming that the general conditions for revenue recognition<br />
are met, when title and the associated risks pass to the customer. Provisions are established for general<br />
risks arising from the sale of goods and services on the basis of previous experience.<br />
Revenues from services are recognized, assuming that the general conditions for revenue recognition are<br />
met, when the percentage of completion can be reliably measured.<br />
They are recognized in the year in which the service is rendered. Where the provision of services extends<br />
over more than one fiscal year, sales are recognized proportionately to the total service to be provided.<br />
<strong>Annual</strong> <strong>Report</strong> <strong>2009</strong> <strong>Evonik</strong> <strong>Industries</strong> 103
104<br />
(b) Other revenues<br />
Other revenues are only recognized if they can be determined reliably and it is sufficiently probable that the<br />
economic benefit will flow to the company.<br />
Interest income is recognized on a pro rata temporis basis using the effective interest method. Income from<br />
royalties is accrued on the basis of the commercial terms of the underlying contract and recognized on a pro<br />
rata basis. Dividend income is recognized as of the date of the right to receipt of the payment.<br />
Intangible assets<br />
Intangible assets are capitalized at acquisition or production cost. Intangible assets with a finite useful life are<br />
amortized and an impairment test is conducted if there are indications of a possible impairment, see Note (3.7)<br />
“Impairment test”. Intangible assets with an indefinite useful life are not amortized; instead they are tested<br />
for impairment at least once a year. The assumptions regarding their indefinite useful life are also reviewed<br />
annually.<br />
(a) Goodwill<br />
Goodwill has an indefinite useful life and is tested for impairment at least once a year.<br />
(b) Franchises, trademarks and licenses<br />
Franchises, trademarks and licenses are amortized over their estimated useful life of 5–25 years using the<br />
straight-line method. Some rights have an indefinite useful life. These are trademarks with no restrictions<br />
on their use. They are tested annually for impairment and to check that their useful life is still indefinite. If<br />
the assessment of the useful life of such trademarks has altered and is reclassified as finite, their carrying<br />
amounts are amortized over their estimated remaining useful life using the straight-line method.<br />
(c) Capitalized development costs<br />
Development costs are capitalized if they can be clearly assigned to a newly developed product or process<br />
that is technically feasible and is designated for captive use or commercialization. Capitalized development<br />
costs mainly relate to the development of new products and are amortized using the straight-line method<br />
over their estimated useful life of between 3 and 15 years.<br />
(d) Other intangible assets<br />
The majority of other intangible assets are acquired customer relationships. These are amortized over their<br />
expected useful life. This is estimated on the basis of contractual data and experience and is generally between<br />
2 and 11 years. Amortization takes account of both useful life and probability of continuance of the customer<br />
relationship in the form of a “churn rate”.<br />
Property, plant and equipment<br />
Property, plant and equipment are carried at acquisition or production cost and depreciated over their useful<br />
life using the straight-line method. If there are indications of a possible impairment, an impairment test is<br />
conducted as outlined in Note (3.7) “Impairment test”.<br />
<strong>Annual</strong> <strong>Report</strong> <strong>2009</strong> <strong>Evonik</strong> <strong>Industries</strong>
Start Management report Consolidated financial statements Supplementary information<br />
Basis of preparation of the financial statements<br />
The cost of acquisition includes expenses directly attributable to the acquisition. The cost of production of<br />
assets manufactured within the Group comprises the direct cost of materials and labor, plus the applicable<br />
proportion of material and manufacturing overheads, including depreciation. Costs relating to obligations<br />
to dismantle or remove non-current assets at the end of their useful life are capitalized as acquisition or<br />
production costs at the time of acquisition or production. Acquisition and production costs may also include<br />
transfers from gains and losses on cash flow hedges entered into in connection with the purchase of property,<br />
plant and equipment and previously recognized in other comprehensive income. Borrowing costs that<br />
can be allocated directly to the acquisition, construction or production of a qualifying asset are included in<br />
the cost of acquisition or production. A qualifying asset is an asset for which more than a year is required to<br />
get it ready for its intended use.<br />
Property, plant and equipment are depreciated using the straight-line method over the expected useful<br />
life of the assets:<br />
in years<br />
Buildings 5–50<br />
Plant and machinery<br />
Chemical facilities 5–25<br />
Power plants and the related components 12–40<br />
Decentralized energy supply installations 8–15<br />
Other technical plant and equipment 3–25<br />
Other plant, office furniture and equipment 3–25<br />
Expenses for overhauls and major servicing (major repairs) are generally capitalized if it is probable that they<br />
will result in future economic benefits from an existing asset. They are then depreciated over the period<br />
until the next major repair date. Routine repairs and other maintenance work are expensed in the period in<br />
which they are incurred.<br />
If there is a high probability that the project will be realized, costs incurred for planning and preengineering<br />
work for capital expenditure projects are capitalized. Depreciation is recognized in line with<br />
the useful life of the project.<br />
If major components of an asset have different useful lives, they are recognized and depreciated separately.<br />
Gains and losses from the disposal of property, plant and equipment are calculated as the difference<br />
between the net proceeds of sale and the carrying amount and recognized in other operating income or<br />
other operating expenses.<br />
Investment property<br />
Property held as a financial investment to generate rental revenues and/or for capital appreciation is valued<br />
at the cost of acquisition or production and depreciated over its useful life of 25–80 years using the straightline<br />
method. If there are indications of a possible impairment, an impairment test is conducted as outlined in<br />
Note (3.7) “Impairment test”.<br />
The fair value of such properties is valued by internal appraisers using the discounted cash flow (DCF)<br />
method. The DCF model maps future cash flows, which determine the value of the property, and thus represents<br />
an income-based valuation of the property, as is customary for rented residential property.<br />
<strong>Annual</strong> <strong>Report</strong> <strong>2009</strong> <strong>Evonik</strong> <strong>Industries</strong> 105
106<br />
Impairment test<br />
If there are indications of possible impairment, an impairment test is conducted on intangible assets, property,<br />
plant and equipment and investment property in accordance with IAS 36: Impairment of Assets. The<br />
impairment test on such assets is generally conducted for a cash-generating unit (CGU), which is the smallest<br />
identifiable group of assets that generates independent cash flows, or for a group of CGUs. Goodwill is<br />
allocated to the business areas (2008: to the business units), in other words to a group of CGUs. Goodwill<br />
and other intangible assets with an indefinite useful life are tested for impairment at least once a year. The<br />
impairment test is conducted on September 30.<br />
The impairment test comprises comparing the recoverable amount of the CGU/group of CGUs with its<br />
carrying amount. The recoverable amount is determined as the higher of the fair value less costs to sell (market<br />
value) and the value in use of the CGU/group of GCUs. An impairment loss is recognized if the recoverable<br />
amount of a CGU/group of CGUs is below its carrying amount. The impairment loss is reversed—<br />
except in the case of goodwill—if the reason for the original impairment charge no longer applies.<br />
When testing goodwill for impairment, the recoverable amount of the goodwill is determined from the<br />
market value of the business area. This is determined from a five-year plan based on historical values, in<br />
keeping with the time horizon set by <strong>Evonik</strong>’s new shareholder for achieving its goals of raising value. The<br />
mid-term planning is based on a mixture of experience and expectations of future market trends and future<br />
cash flows. The main economic data, such as growth in gross domestic product, the development of interest<br />
rates, exchange rates, raw material prices and the market price of CO2 allowances, etc., used in the mid-term<br />
planning are derived from market expectations and set centrally by <strong>Evonik</strong>. The specific growth rates for<br />
individual business areas are derived from experience and future expectations. The average long-term growth<br />
rates for the markets in which the business areas operate are not exceeded.<br />
The expected future cash flows are discounted using the weighted average cost of capital (WACC) after<br />
taxes. WACC is determined for each business area on the basis of capital market models and is the weighted<br />
average cost of debt and equity. The cost of equity is determined from the risk-free interest rate and a risk<br />
premium. The risk premium is derived by multiplying the beta factor by the market risk premium. The riskfree<br />
interest rate is defined as 4.50 percent for all business areas (2008: 4.75 percent). The beta factor is<br />
obtained from the capital market by comparison with the values for comparable companies for the business<br />
area (peer group). A terminal growth rate is assumed for individual business areas. The cost of debt for the<br />
Chemicals and Energy Business Areas is derived from an analysis of the gearing of peer group companies<br />
and the resultant cost of debt. In the Real Estate Business Area the actual cost of debt is used. The parameters<br />
used are set out in Notes (6.3) and (7.1).<br />
Inventories<br />
Inventories are measured at the lower of cost and net realizable value. The cost of inventories of similar<br />
structure or for similar applications is determined uniformly as an average or using the first-in first-out<br />
method. The cost of finished goods and work in progress comprises the cost of raw materials and supplies,<br />
directly attributable personnel expenses, other direct costs and general overheads that can be assigned to<br />
production (based on normal operating capacity). The cost of inventories may also contain gains and losses<br />
for qualifying cash flow hedges for the purchase of raw materials which have been reclassified from other<br />
comprehensive income, and borrowing costs for qualifying assets. A qualifying asset is an asset for which<br />
more than a year is required to get it ready for sale.<br />
<strong>Annual</strong> <strong>Report</strong> <strong>2009</strong> <strong>Evonik</strong> <strong>Industries</strong>
Start Management report Consolidated financial statements Supplementary information<br />
Basis of preparation of the financial statements<br />
Purchased emissions allowances are recognized at the lower of cost or net realizable value. Analogously to<br />
IAS 20 Accounting for Government Grants and Disclosure of Government Assistance, a token amount is<br />
recognized for emissions allowances allocated free of charge. Provisions are recognized for the obligation<br />
to return emissions allowances insofar as such allowances are available, at the amount capitalized for such<br />
allowances. If the return obligation exceeds the allowances capitalized, the difference is recognized at the<br />
average price for the three months preceding the reporting date.<br />
Impairment losses are reversed if the reason for them is no longer applicable; they may be written back<br />
at most to the historical cost of acquisition or production.<br />
Provisions for pensions and other post-employment benefits<br />
Provisions for pensions and other post-employment benefits are measured using the projected unit credit<br />
method for defined benefit obligations in accordance with IAS 19 Employee Benefits. This method takes<br />
account of future salary and pension increases as well as pension obligations and accrued entitlements as<br />
of the reporting date. In Germany, valuation is based on the biometric data in the 2005 G mortality tables<br />
published by Klaus Heubeck. Pension obligations outside Germany are determined using country-specific<br />
parameters and accounting principles. The fair value of plan assets is deducted from the benefit obligation.<br />
Actuarial gains and losses are derived from the difference between the expected pension obligations and<br />
the actual obligation calculated at year end, and from deviations between the expected and actual fair value<br />
of plan assets calculated at year end. Actuarial gains and losses are only recognized if the balance of accumulated<br />
actuarial gains and losses not yet recognized in income exceeds the higher of one of the following<br />
at the end of the previous reporting period:<br />
• 10 percent of the present value of the defined benefit obligation<br />
• 10 percent of the fair value of plan assets.<br />
Amounts exceeding this level must be allocated over the expected average remaining service life of the<br />
employees covered by the plan and recognized in income from the following year.<br />
The benefit obligations at year end are compared with the fair value of the plan assets (funded status).<br />
Pension provisions are derived from the funded status by deducting unrecognized actuarial gains and losses<br />
and past service cost, taking the asset ceiling into account.<br />
Defined contribution plans result in an expense in the period in which the contribution is made. Defined<br />
contribution plans exist for both company pension plans and state pension plans (statutory pension insurance).<br />
Other provisions<br />
Other provisions are liabilities of uncertain timing or amount. They are established to cover a present legal<br />
or constructive obligation to third parties based on past events that will probably lead to an outflow of<br />
resources. It must also be possible to reliably estimate the level of the obligation. If there are several obligations<br />
of the same type, the probability of an outflow of resources is calculated for these obligations as an<br />
aggregate. Restructuring provisions are only established if constructive obligations exist on the basis of a<br />
formal, detailed plan and those affected have been given justifiable expectations that the restructuring will<br />
be carried out.<br />
Provisions are based on settlement obligations and take account of future cost increases. Non-current<br />
provisions are discounted. Current provisions and the current portion of non-current provisions are not<br />
discounted. Provisions are adjusted over time to take account of new findings.<br />
The Long-Term Incentive Plans comprise performance-related remuneration plans for <strong>Evonik</strong>’s executives.<br />
The resulting obligations are determined and expensed in accordance with IAS 19 Employee Benefits.<br />
<strong>Annual</strong> <strong>Report</strong> <strong>2009</strong> <strong>Evonik</strong> <strong>Industries</strong> 107
108<br />
Deferred taxes, other income taxes<br />
In compliance with IAS 12 Income Taxes, deferred tax assets and liabilities are established for temporary<br />
valuation and recognition differences between the assets and liabilities recognized in the balance sheets<br />
prepared for tax purposes and those prepared in accordance with IFRS. Tax-deductible loss carryfowards<br />
that will probably be utilized in the future are capitalized at the amount of the deferred tax asset. Deferred<br />
tax assets are recognized on the assumption that sufficient future taxable income is likely to be realized to<br />
cover these temporary differences. Where the realization of deferred tax assets is unlikely, they are written<br />
down.<br />
Deferred tax assets and liabilities are netted if the company is permitted to net other income tax assets<br />
and liabilities and if the deferred tax assets and liabilities relate to income taxes in the same tax jurisdiction.<br />
The tax rates used to calculate deferred taxes are those valid under current legislation or that have been<br />
announced as being applicable as of the date when the temporary differences will probably be settled.<br />
The overall tax rate used to calculate deferred taxes for companies in Germany is 30 percent. In addition to<br />
15 percent German corporation tax, the overall tax rate includes a solidarity surcharge of 5.5 percent of the<br />
German corporation tax and average trade tax of around 14 percent. The tax rates used for foreign companies<br />
are their national tax rates. These vary between 16.5 percent (Hong Kong) and 41.0 percent (Japan).<br />
Other income taxes for the reporting period and previous periods are recognized on the basis of the<br />
expected payment or refund. They are calculated using the company-specific tax rates applicable on the<br />
reporting date.<br />
Financial instruments<br />
Financial instruments comprise contractually agreed rights and obligations resulting in an inflow or outflow<br />
of financial assets or the issue of equity instruments. They are classified as either primary or derivative<br />
financial instruments.<br />
Financial instruments are initially measured at fair value plus any directly attributable transaction costs.<br />
By contrast, transaction costs for financial instruments held at fair value through profit or loss are included<br />
in the income statement. Fair value measurement is based on three-level fair value hierarchy. The fair value<br />
is the quoted price on an active market (Level 1). If such price data are not available, either the quoted<br />
price on an active market for similar financial instruments should be used, or a different valuation method<br />
based on inputs from observable market data should be used (Level 2). In all other cases, valuation methods<br />
should be used that are not based on observable market data (Level 3). Discounted cash flow analyses or<br />
option pricing models have been selected as established valuation methods. To measure non-current assets<br />
that do not bear market interest rates, the expected future cash flows are discounted to the date of acquisition<br />
using the effective interest rate (present value). The effective interest rate takes account of all directly<br />
attributable fees that are by nature interest. Subsequent measurement is based on the classification of the<br />
financial instruments.<br />
(a) Primary financial instruments<br />
<strong>Evonik</strong> classifies primary financial instruments as financial assets in the categories loans and receivables or<br />
available-for-sale. They are initially recognized at the settlement date. Financial assets are derecognized<br />
when the contractual rights to receive payments lapse or are transferred and the Group has transferred substantially<br />
all opportunities and risks associated with ownership. There were no instances where the Group<br />
sold financial assets through securitization or a repurchase agreement and the assets were still reported in<br />
full or in part in the financial statements (continuing involvement).<br />
<strong>Annual</strong> <strong>Report</strong> <strong>2009</strong> <strong>Evonik</strong> <strong>Industries</strong>
Start Management report Consolidated financial statements Supplementary information<br />
Basis of preparation of the financial statements<br />
Primary financial instruments that constitute financial liabilities are recognized at amortized cost. Financial<br />
liabilities are derecognized when the obligation has been settled, canceled or expired.<br />
The categories used by the Group are outlined below:<br />
Loans and receivables principally comprise trade accounts receivable and loans. The assets assigned to<br />
this category are valued at amortized cost using the effective interest rate method. If there are objective<br />
indications based on historical empirical values that it will not be possible to collect the full amounts due<br />
under the customary conditions, an impairment loss is recognized. This is measured as the difference between<br />
the carrying amount of the asset and the present value of the estimated future payments calculated using<br />
the effective interest rate. Impairment losses are recognized in the income statement. If the original reason<br />
for the impairment loss no longer applies, it is reversed to income, but only up to the amortized cost.<br />
Available-for-sale assets comprise equity instruments that are not consolidated or recognized at equity,<br />
and other securities. If no fair value is available for such assets or it cannot be determined reliably, for example,<br />
equity instruments that are not listed on a stock exchange, the assets are recognized at amortized cost. Changes<br />
in the fair value are recognized in other comprehensive income. Financial assets are examined for objective<br />
indications of impairment on every reporting date. A material or lasting reduction in the fair value to below<br />
the carrying amount is regarded as an indication of impairment. In the case of shares, this is considered to<br />
be the case if the fair value is 20 percent below the carrying amount. In such cases, the corresponding losses<br />
are derecognized from other comprehensive income and recognized in the income statement. If the reason<br />
for the impairment loss no longer applies, the reversal is recognized in other comprehensive income and<br />
thus has no impact on income. Only debt instruments that are allocated to this category are written back by<br />
up to the amount of the original impairment in the income statement. Impairment losses are not reversed if<br />
they apply to investments and other financial assets whose fair value cannot be reliably determined.<br />
The category at amortized cost mainly refers to trade accounts payable and credits. The liabilities assigned<br />
to this category are valued at amortized cost using the effective interest rate method.<br />
b) Derivative financial instruments<br />
Derivative financial instruments are used primarily to hedge the risk of changes in exchange rates, the price<br />
of goods and interest rates. Hedges in the form of interest rate swaps, options, forward exchange contracts<br />
and commodity futures are recognized on the balance sheet. Initial recognition is on the trading date. If<br />
no stock exchange or market price is available for the derivative from an active market the fair value is<br />
determined using capital market pricing methods. For forward exchange contracts, the forward exchange<br />
rate as of the reporting date is used. The market price of options is determined using established option pricing<br />
models. Commodity derivatives are valued with the aid of spot prices and forward rates while interest rate<br />
derivatives are valued using future cash flows. Stand-alone financial derivatives are classified as at fair value<br />
through profit or loss. Financial instruments assigned to this category are measured at fair value on each reporting<br />
date. Any gain or loss resulting from a change in their fair value is recognized in the income statement.<br />
<strong>Annual</strong> <strong>Report</strong> <strong>2009</strong> <strong>Evonik</strong> <strong>Industries</strong> 109
110<br />
Specific criteria have to be met to qualify for hedge accounting. In particular, hedge accounting requires<br />
extensive documentation of the hedge relationship, together with evidence that the expected and actual<br />
effectiveness of the hedge is between 80 and 125 percent. A derivative no longer qualifies for hedge<br />
accounting if these conditions are not fulfilled. In the case of cash flow hedges, hedge accounting must<br />
also be halted if the forecast transaction no longer appears probable. In such cases the amount recognized<br />
in other comprehensive income is reclassified to the income statement.<br />
Depending on the structure of the hedge, hedging instruments are valued as outlined below:<br />
The purpose of fair value hedges is to hedge the fair value of assets or liabilities reflected on the balance<br />
sheet. Changes in the fair value of the hedging instrument are recognized in the same income statement<br />
item as changes in the value of the hedged item. These changes must relate to the hedged risk. If off-balancesheet<br />
firm commitments are hedged, changes in the fair value of the firm commitment resulting from changes<br />
in the hedged risk give rise to recognition of an asset or a liability on the income statement. In view of this<br />
method, changes in the value of the hedged item and the hedge cancel each other out in the income statement.<br />
The purpose of cash flow hedges is to minimize the risk of volatility of future cash flows from a recognized<br />
asset or liability or a forecast transaction that is considered highly probable. Changes in the fair value<br />
of hedging instruments, calculated on the effective portion, are recognized in other comprehensive income.<br />
The ineffective portion of the change in value is recognized in the income statement. Amounts recognized<br />
in other comprehensive income are reclassified to the income statement as soon as the hedged item has an<br />
impact on the income statement. In the case of interest rate hedges, such amounts are included in net interest<br />
income or expense, while in the case of sales hedges they are included in the corresponding sales revenues<br />
and for procurement hedges directly in the cost of sales. If the hedged future transaction comprises a<br />
non-financial asset or liability, the profit or loss previously recognized in other comprehensive income is<br />
included in the cost of acquisition of the asset or liability when it is initially recognized.<br />
The purpose of a hedge of a net investment is to reduce the foreign currency risk involved in an investment<br />
in a company whose functional currency is not the euro. Such hedges are treated as cash flow hedges.<br />
Unrealized gains and losses recognized in other comprehensive income are reclassified to the income statement<br />
when the foreign subsidiary is divested.<br />
Leasing<br />
A lease comprises an agreement that transfers the right to use an asset for a certain period in return for one<br />
or more payments. The Group is party to various operating and finance leases as either lessor or lessee.<br />
A lease is classified as a finance lease if, under the lease agreement, the lessee bears substantially all opportunities<br />
and risks associated with ownership of the asset. In addition to contractually agreed finance leases,<br />
lease agreements relating to the use of assets, for example, supply agreements in connection with power<br />
distribution, may be classified as finance leases if they meet certain cumulative criteria. Where <strong>Evonik</strong> is the<br />
lessee, the assets are included in property, plant and equipment at fair value or at the present value of the<br />
non-cancelable lease payments, whichever is the lower. The payment obligations arising from future lease<br />
payments are recognized as a liability at the discounted settlement value. Where <strong>Evonik</strong> is the lessor, it recognizes<br />
a receivable equivalent to the net investment value rather than the property, plant and equipment.<br />
All leasing arrangements that are not finance leases are classified as operating leases. The related income<br />
and expenses are recognized in the income statement in the period in which they are received or incurred.<br />
<strong>Annual</strong> <strong>Report</strong> <strong>2009</strong> <strong>Evonik</strong> <strong>Industries</strong>
Start Management report Consolidated financial statements Supplementary information<br />
Discussion of assumptions and<br />
estimation uncertainties<br />
Assets held for sale and the associated liabilities<br />
Non-current assets are classified as held for sale if the corresponding carrying amount is to be realized<br />
principally through a sale transaction rather than through continued use. Such assets must be available for<br />
immediate sale in their present condition, on terms that are usual and customary for the sale of such assets,<br />
and sale must be highly probable. If the associated liabilities are to be sold with the asset as part of the<br />
transaction, these must also be recognized separately.<br />
Non-current assets are no longer depreciated or amortized. Instead they are recognized at the lower of<br />
their carrying amount or fair value less costs to sell. Unless they are classified as discontinued operations,<br />
the results of the valuation and the sale of the asset are included in income from continuing operations.<br />
Discontinued operations<br />
A discontinued operation is either a major line of business or geographical area of the company that is to<br />
be sold or shut down on the basis of a single coordinated plan, either as a whole or in parts, or a subsidiary<br />
acquired with a view to resale.<br />
The income from the operating activities and the measurement and divestment of discontinued operations<br />
is reported separately from the continuing operations on the income statement. Similarly the cash flow<br />
from the operating activities of discontinued operations is reported separately from the continuing operations<br />
in the cash flow statement.<br />
Government grants<br />
Government grants for the purchase or construction of property, plant and equipment reduce the cost of<br />
acquisition or production of such assets. They are reflected in the income statement over the useful life of<br />
the assets through lower depreciation. Other grants are accrued and recognized as income over the same<br />
period as the expenses for which they are expected to compensate.<br />
Contingent liabilities and other financial commitments<br />
Contingent liabilities, except for those recognized in connection with a business combination, are possible<br />
or present obligations arising from past events where an outflow of resources is not improbable but which<br />
are not recognized on the balance sheet.<br />
Other financial commitments result from non-onerous executory contracts, continuous obligations,<br />
statutory requirements and other commercial obligations that are not already included in the liabilities<br />
shown on the balance sheet or in contingent liabilities and that are of significance for an assessment of the<br />
company’s financial position.<br />
(4) Discussion of assumptions and estimation uncertainties<br />
The preparation of consolidated financial statements involves assumptions and estimates about the future.<br />
Evidently, the subsequent circumstances do not always match the estimates made. Adjustments to estimates<br />
are recognized in income as soon as better information is available. The estimates and assumptions that<br />
constitute a material risk that the carrying amounts of assets and liabilities may have to be adjusted within<br />
the next fiscal year are discussed below.<br />
(a) Impairment testing of goodwill<br />
Testing intangible assets, especially goodwill, for impairment also involves assumptions and estimates regarding,<br />
for example, future cash flows, expected growth rates, exchange rates and discount rates. The relevant<br />
assumptions may change, leading to impairment losses in future periods.<br />
A relative increase in the weighted cost of capital (WACC) of 10 percent as a result of changes in capital<br />
market interest rates would not result in any additional impairment losses.<br />
<strong>Annual</strong> <strong>Report</strong> <strong>2009</strong> <strong>Evonik</strong> <strong>Industries</strong> 111
112<br />
(b) Impairment testing of deferred tax assets<br />
Deferred tax assets may only be recognized if it is probable that sufficient taxable income will be available in<br />
the future. Deferred taxes are calculated on the basis of the tax rates applicable on the date when temporary<br />
differences are likely to be reversed. If these expectations were not met, a write-down would have to be<br />
recognized in income for the deferred tax assets.<br />
(c) Valuation of provisions for pensions and other post-employment benefits<br />
The valuation of provisions for pensions and other post-employment benefits is subject, among other things,<br />
to assumptions about discount rates, the expected long-term return on plan assets, expected future salary<br />
and pension increases, the cost trend for health care, and mortality tables. The actual data may differ from<br />
these assumptions as a result of changes in economic or market conditions.<br />
A reduction of one percentage point in the discount rate would increase the present value of the defined<br />
benefit obligation by €1,031 million. Conversely, increasing the discount rate by one percentage point would<br />
decrease the defined benefit obligation by about €950 million.<br />
If the trend in health-care costs were to increase by one percentage point, the accumulated health-care<br />
benefit obligation would increase by €8 million and pension expense would increase by €1 million. Conversely,<br />
a reduction of one percentage point in the cost trend would reduce the accumulated health-care obligation<br />
by €7 million and personnel expense by €1 million.<br />
(d) Valuation of other provisions<br />
Other provisions, especially provisions for recultivation and environmental protection, litigation risks and<br />
restructuring are naturally exposed to significant forecasting uncertainties regarding the level and timing of<br />
the obligation. The company has to make assumptions about the probability of occurrence of an obligation<br />
or future trends, such as value of the costs, on the basis of experience. Non-current provisions in particular<br />
are exposed to forecasting uncertainties. In addition, the level of non-current provisions depends to a large<br />
extent on the selection and development of the market-oriented discount rate.<br />
(e) Discounting non-current receivables and liabilities<br />
The valuation of non-current receivables and liabilities that are interest-free or do not bear interest at market<br />
rates and of other non-current provisions depends to a large extent on the discount rate selected and how it<br />
develops. The Group uses different interest rates for different currencies and terms to maturity. Changes in<br />
these rates may have a considerable impact on the carrying amounts of non-current receivables and liabilities.<br />
<strong>Annual</strong> <strong>Report</strong> <strong>2009</strong> <strong>Evonik</strong> <strong>Industries</strong>
Start Management report Consolidated financial statements Supplementary information<br />
(5) Changes in the <strong>Evonik</strong> Group<br />
Changes in the <strong>Evonik</strong> Group<br />
(5.1) Scope of consolidation<br />
Alongside <strong>Evonik</strong> <strong>Industries</strong> <strong>AG</strong>, the consolidated financial statements include all material subsidiaries in<br />
Germany and abroad. Material associated companies and joint ventures are recognized at equity.<br />
The scope of consolidation changed as follows:<br />
Number of companies Germany<br />
<strong>Evonik</strong> <strong>Industries</strong> <strong>AG</strong> and consolidated subsidiaries<br />
Other<br />
countries Total<br />
December 31, 2008 106 138 244<br />
Acquisitions 2 1 3<br />
Other companies consolidated for the first time 3 3 6<br />
Divestments −5 −3 −8<br />
Intragroup mergers −6 −3 −9<br />
Other companies deconsolidated −1 −3 −4<br />
December 31, <strong>2009</strong> 99 133 232<br />
Investments recognized at equity<br />
December 31, 2008 17 7 24<br />
Acquisitions − 1 1<br />
Other investments recognized at equity for the first time − 1 1<br />
December 31, <strong>2009</strong> 17 9 26<br />
116 142 258<br />
(5.2) Acquisitions and divestments<br />
This section provides a more detailed overview of the changes in the scope of consolidation in the reporting<br />
period, divided into acquisitions and divestments.<br />
Acquisitions<br />
The Chemicals and Energy Business Areas made several small acquisitions. Their aggregate impact on the<br />
balance sheet was negligible. Moreover, their aggregate purchase price was not material.<br />
Divestments<br />
The Real Estate Business Area divested various commercial properties to AH Gundbesitz GmbH, Berlin<br />
(Germany) and a natural person with legal effect from June <strong>2009</strong>. This transaction included the subsidiary<br />
NMI Immobilien GmbH, Hückelhoven (Germany), which had been classified as held for sale since December<br />
2007.<br />
The Chemicals Business Area sold the AlzChem Group to two companies of financial investor<br />
BluO SICAV-SIF, Luxembourg (Luxembourg) with legal effect from the end of October <strong>2009</strong>. The<br />
AlzChem Group comprises the NCN chemicals business and had been classified as held for sale since<br />
September 2008. Six subsidiaries were deconsolidated as a result of this divestment.<br />
With effect from the start of December <strong>2009</strong>, the Energy Business Area sold 49 percent of its shares in<br />
the subsidiary Ayas Enerji Üretim ve Ticaret A.S., Ankara (Turkey) to the pension fund Ordu Yardimlasma<br />
Kurumu, Ankara (Turkey). The remaining 51 percent of shares in this company are recognized at equity<br />
because <strong>Evonik</strong> does not have a majority of the voting rights.<br />
<strong>Annual</strong> <strong>Report</strong> <strong>2009</strong> <strong>Evonik</strong> <strong>Industries</strong> 113
114<br />
The aggregate impact of these transactions on the balance sheet at the time of divestment or deconsolidation<br />
was as follows:<br />
in € million<br />
Non-current assets 121<br />
Current assets (excluding cash and cash equivalents) 69<br />
Cash and cash equivalents 15<br />
Non-current liabilities 57<br />
Current liabilities 52<br />
Gross price 105<br />
(5.3) Assets held for sale and discontinued operations<br />
In addition to the divestments outlined in Note (5.2), the Executive Board of <strong>Evonik</strong> <strong>Industries</strong> <strong>AG</strong> has decided<br />
to divest further business operations. Since the divestment process was not completed in 2008, they were still<br />
included in the consolidated financial statements. IFRS 5 Non-current Assets Held for Sale and Discontinued<br />
Operations sets out the valuation and accounting principles to be used for such operations, see Note (3.7),<br />
and their presentation in the consolidated financial statements.<br />
Assets held for sale and the associated liabilities are stated separately from other assets and liabilities on<br />
the balance sheet. The amounts recognized for these assets and liabilities in the previous year do not have to<br />
be reclassified or restated.<br />
Businesses whose assets and liabilities have been classified as held for sale may also meet the criteria for<br />
classification as discontinued operations, especially if a significant area of <strong>Evonik</strong>’s business is to be sold.<br />
The income and expenses of such discontinued operations have to be stated separately from those of<br />
continuing operations in the income statement. Cash flows must also be stated separately. The prior-year<br />
figures in the income statement have to be reclassified.<br />
The tar refining and initiators businesses divested in 2008 met the criteria for classification as discontinued<br />
operations. Post-divestment income and expenses resulted from various discontinued operations divested<br />
prior to 2008 (various discontinued operations from previous years).<br />
<strong>Annual</strong> <strong>Report</strong> <strong>2009</strong> <strong>Evonik</strong> <strong>Industries</strong>
Start Management report Consolidated financial statements Supplementary information<br />
Changes in the <strong>Evonik</strong> Group<br />
The table shows the main impact of the discontinued operations on the income statement, broken down<br />
into operating earnings and the gain or loss on divestment:<br />
Income statement<br />
in € million<br />
Operating earnings Divestment gains/losses<br />
Income from<br />
discontinued operations<br />
<strong>2009</strong> 2008 <strong>2009</strong> 2008 <strong>2009</strong> 2008<br />
Tar refining – 22 −3 128 −3 150<br />
Initiators – 5 4 −36 4 −31<br />
Discontinued operations from previous years – – −7 −2 −7 −2<br />
0 27 −6 90 −6 117<br />
The following income and expense items relate to the operating earnings of these operations:<br />
Income statement<br />
in € million <strong>2009</strong> 2008<br />
Income 0 331<br />
thereof tar refining − 255<br />
thereof initiators − 76<br />
Expenses 0 −289<br />
thereof tar refining − −220<br />
thereof initiators − −69<br />
Operating earnings before income taxes, discontinued operations 0 42<br />
thereof tar refining − 35<br />
thereof initiators − 7<br />
Income taxes 0 −15<br />
thereof tar refining − −13<br />
thereof initiators − −2<br />
Operating earnings after taxes, discontinued operations 0 27<br />
thereof tar refining − 22<br />
thereof initiators − 5<br />
<strong>Annual</strong> <strong>Report</strong> <strong>2009</strong> <strong>Evonik</strong> <strong>Industries</strong> 115
116<br />
The divestment gains and losses comprise the following:<br />
Income statement<br />
in € million <strong>2009</strong> 2008<br />
Income before income taxes from the divestment of discontinued operations 0 92<br />
thereof tar refining 4 129<br />
thereof initiators 4 −33<br />
thereof discontinued operations from previous years −8 −4<br />
Income taxes −6 −2<br />
thereof tar refining −7 −1<br />
thereof initiators 0 −3<br />
thereof discontinued operations from previous years 1 2<br />
Income after taxes from the divestment of discontinued operations −6 90<br />
thereof tar refining −3 128<br />
thereof initiators 4 −36<br />
thereof discontinued operations from previous years −7 −2<br />
Various non-core businesses were also classified as held for sale. Their assets and liabilities have therefore<br />
been presented separately in the balance sheet alongside the discontinued operations. None of the discontinued<br />
operations were shown on the balance sheets for 2008 and <strong>2009</strong>. The following non-core businesses<br />
were reclassified in 2008:<br />
From December 2007 <strong>Evonik</strong> classified various commercial properties as held for sale. These were divested<br />
in <strong>2009</strong>, see Note (5.2). In 2008, assets totaling €26 million were assigned to these activities.<br />
In September 2008, the NCN chemicals business was classified as held for sale. It was divested in <strong>2009</strong>,<br />
see Note (5.2). Assets of €180 million and liabilities of €86 million were reclassified in 2008.<br />
Impairment losses of €38 million (2008: €8 million) were recognized for the non-core businesses divested<br />
(2008: €8 million). The corresponding reversals of impairment losses were €7 million (2008: none).<br />
Balance sheet<br />
in € million Dec. 31, <strong>2009</strong> Dec. 31, 2008<br />
Intangible assets – 25<br />
Property, plant and equipment – 56<br />
Investment property – 23<br />
Financial assets – 1<br />
Inventories – 52<br />
Trade accounts receivable – 31<br />
Other receivables – 9<br />
Miscellaneous – 9<br />
Assets held for sale 0 206<br />
<strong>Annual</strong> <strong>Report</strong> <strong>2009</strong> <strong>Evonik</strong> <strong>Industries</strong>
Start Management report Consolidated financial statements Supplementary information<br />
Balance sheet<br />
Changes in the <strong>Evonik</strong> Group<br />
in € million Dec. 31, <strong>2009</strong> Dec. 31, 2008<br />
Provisions for pensions and other post-employment benefits – 32<br />
Other provisions – 33<br />
Trade accounts payable – 16<br />
Miscellaneous – 5<br />
Liabilities associated with assets held for sale 0 86<br />
The cash flows from operating, investing and financing activities of the discontinued operations only comprise<br />
cash flows generated through transactions with third parties. The net cash flows reflect the change in cash<br />
and cash equivalents and in cash pooling activities within the Group.<br />
The cash flows for the discontinued operations can be broken down as follows:<br />
Cash flow statement<br />
in € million <strong>2009</strong> 2008<br />
Cash flow from operating activities 0 7<br />
thereof tar refining − 12<br />
thereof initiators − −5<br />
Cash flow from investing activities 0 −6<br />
thereof tar refining − −3<br />
thereof initiators − −3<br />
Cash flow from financing activities 0 −2<br />
thereof from tar refining − −4<br />
thereof from initiators − 2<br />
Change in cash and cash equivalents, discontinued operations 0 −1<br />
<strong>Annual</strong> <strong>Report</strong> <strong>2009</strong> <strong>Evonik</strong> <strong>Industries</strong> 117
118<br />
(6) Notes to the income statement<br />
(6.1) Sales<br />
in € million <strong>2009</strong> 2008<br />
Revenues from the sale of goods and services 12,555 15,360<br />
Revenues from investment property 347 343<br />
Revenues from finance leases 166 170<br />
Other revenues 8 −<br />
(6.2) Other operating income<br />
<strong>Annual</strong> <strong>Report</strong> <strong>2009</strong> <strong>Evonik</strong> <strong>Industries</strong><br />
13,076 15,873<br />
in € million <strong>2009</strong> 2008<br />
Income from the disposal of assets 13 195<br />
Income from the reversal of provisions 135 79<br />
Income from the reversal of deferred items 7 9<br />
Income from the reversal of impairment losses 26 20<br />
Income from the measurement of derivatives (excluding interest rate derivatives) 398 427<br />
Gains on currency translation of monetary assets and liabilities 115 288<br />
Income from non-core operations 61 107<br />
Income from cost transfer 5 13<br />
Income from insurance refunds 12 12<br />
Income from research subsidies 8 13<br />
Other income 89 83<br />
869 1,246<br />
Income from the disposal of assets comprises €12 million (2008: €51 million) from the divestment of property,<br />
plant and equipment and investment property and €1 million (2008: €120 million) from the sale of investments.<br />
The income from reversals of impairment losses in accordance with IAS 39 Financial Instruments: Recognition<br />
and Measurement includes €18 million (2008: €5 million) relating to trade accounts receivable and<br />
loans. In 2008, it also included €1 million from reversals of impairment losses on other investments. Further,<br />
pursuant to IAS 36 Impairment of Assets, €8 million (2008: €14 million) of the reversals relate to the following<br />
business areas:<br />
Reversal of impairment losses<br />
in € million <strong>2009</strong> 2008<br />
Chemicals 5 6<br />
Real Estate 3 8<br />
8 14
Start Management report Consolidated financial statements Supplementary information<br />
(6.3) Other operating expenses<br />
Notes to the income statement<br />
in € million <strong>2009</strong> 2008<br />
Losses on the disposal of assets 19 77<br />
Losses on measurement of derivatives (excluding interest rate derivatives) 365 658<br />
Losses on currency translation of monetary assets and liabilities 178 40<br />
Expenses for restructuring 59 63<br />
Expenses for recultivation and environmental protection 6 12<br />
Other additions to provisions 160 104<br />
Impairment losses pursuant to IAS 36 75 278<br />
Impairment losses pursuant to IAS 39 27 32<br />
Impairment losses pursuant to IFRS 5 38 8<br />
Expenses relating to the REACH Regulation 8 6<br />
Miscellaneous tax expense 5 5<br />
Other expense 346 376<br />
1,286 1,659<br />
Losses on the disposal of assets mainly comprise €13 million (2008: €11 million) relating to the divestment<br />
of property, plant and equipment and investment property and €4 million (2008: €8 million) relating to the<br />
sale of investments.<br />
Impairment losses determined in accordance with IAS 36 Impairment of Assets in response to indications<br />
of a possible impairment were divided among the following business areas:<br />
Impairment losses<br />
Risk-adjusted<br />
discount rate in %<br />
in € million <strong>2009</strong> 2008 <strong>2009</strong> 2008<br />
Chemicals 65 267 7.9 8.1<br />
Energy 7 3 6.8 7.2<br />
Real Estate 3 8 6.5 6.2<br />
75 278<br />
In the Chemicals Business Area, impairment losses of €40 million resulted from an accident and the related<br />
production shutdown in the Health & Nutrition Business Unit. This principally relates to plant and equipment<br />
used to manufacture products for the pharmaceuticals industry.<br />
Additional impairment losses of €15 million relate to the Coatings & Additives Business Unit and result<br />
from the need for a strategic refocusing of some activities in this business unit.<br />
Further impairment losses amounting to €10 million relate to other business units in the Chemicals Business<br />
Area. They mainly affect property, plant and equipment.<br />
<strong>Annual</strong> <strong>Report</strong> <strong>2009</strong> <strong>Evonik</strong> <strong>Industries</strong> 119
120<br />
The impairment losses on financial instruments and other receivables determined in accordance with IAS 39<br />
Financial Instruments: Recognition and Measurement comprise €21 million (2008: €23 million) on trade<br />
accounts receivable and €1 million (2008: €4 million) on loans and other investments. An impairment loss<br />
of €5 million (2008: €4 million) was recognized for the other receivables. Further, in 2008 an impairment<br />
loss of €1 million was recognized on receivables from finance leases.<br />
The other expense mainly comprises expenses for outsourcing, IT, insurance contributions, M&A projects,<br />
energy and supplies, commission payments, and legal and consultancy fees.<br />
(6.4) Net interest expense<br />
in € million <strong>2009</strong> 2008<br />
Income from securities and loans 9 19<br />
Interest and similar income from interest rate derivatives 15 44<br />
Other interest-type income 15 13<br />
Interest income 39 76<br />
Interest expense on financial liabilities −176 −225<br />
Interest expense for finance leases −11 −11<br />
Interest and similar expense for interest rate derivatives −14 −48<br />
Other interest-type expense −31 −51<br />
Net interest expense for pensions −247 −215<br />
Interest expense on accrued interest on other provisions −43 −56<br />
Interest expense −522 −606<br />
<strong>Annual</strong> <strong>Report</strong> <strong>2009</strong> <strong>Evonik</strong> <strong>Industries</strong><br />
−483 −530<br />
Borrowing costs of €27 million (2008: €22 million) are capitalized. The underlying cost of financing is<br />
3.6 percent (2008: 3.5 percent).<br />
(6.5) Result from investments recognized at equity<br />
in € million <strong>2009</strong> 2008<br />
Income from measurement at equity 70 80<br />
Expenses for measurement at equity −5 −8<br />
Impairment losses − −8<br />
65 64<br />
(6.6) Other financial income<br />
Other financial income includes income of €15 million (2008: €16 million) from other investments.
Start Management report Consolidated financial statements Supplementary information<br />
(6.7) Income taxes<br />
Income taxes comprise the following:<br />
Notes to the income statement<br />
in € million <strong>2009</strong> 2008<br />
Other income taxes 194 129<br />
(thereof relating to other periods) (−5) (7)<br />
Deferred taxes −100 −1<br />
(thereof relating to other periods) (6) (−34)<br />
94 128<br />
The tax reconciliation shows the development of expected income taxes relative to the effective income taxes<br />
stated in the income statement. The effective income taxes include other income taxes and deferred taxes.<br />
As in the previous year, the expected income taxes for <strong>2009</strong> are based on an overall tax rate of 30 percent,<br />
comprising German corporation tax of 15 percent, a solidarity surcharge of 5.5 percent and the average trade<br />
tax rate.<br />
in € million <strong>2009</strong> 2008<br />
Income before income taxes, continuing operations 412 362<br />
Expected income taxes 124 109<br />
Variances due to differences in the assessment base for trade tax 8 13<br />
Deviation from the expected tax rate 14 −1<br />
Changes in valuation allowances on deferred taxes −38 −33<br />
Losses not affecting deferred taxes and the use of loss carryforwards 5 8<br />
Changes in tax rates and tax legislation −1 1<br />
Non-deductible expenses 67 74<br />
Interest ceiling −18 26<br />
Tax-free income −43 −61<br />
Result from investments recognized at equity −19 −19<br />
Other −5 11<br />
Effective income taxes (other income taxes and deferred taxes) 94 128<br />
Effective tax rate in % 22.8 35.4<br />
The change in the valuation allowances on deferred taxes is principally due to the adjustment of deferred<br />
tax assets. “Other” contains other income taxes and deferred taxes relating to different periods.<br />
<strong>Annual</strong> <strong>Report</strong> <strong>2009</strong> <strong>Evonik</strong> <strong>Industries</strong> 121
122<br />
(7) Notes to the balance sheet<br />
(7.1) Intangible assets<br />
in € million Goodwill<br />
Cost of acquisition/production<br />
<strong>Annual</strong> <strong>Report</strong> <strong>2009</strong> <strong>Evonik</strong> <strong>Industries</strong><br />
Franchises,<br />
trademarks<br />
and licenses<br />
Capitalized<br />
development<br />
costs<br />
Other<br />
intangible<br />
assets Total<br />
As of January 1, 2008 3,288 1,748 156 518 5,710<br />
Currency translation 46 5 − 2 53<br />
Additions from business combinations 6 0 − 0 6<br />
Other additions 18 29 7 7 61<br />
Disposal −41 −45 − −1 −87<br />
Reclassification − 2 − 0 2<br />
As of December 31, 2008 3,317 1,739 163 526 5,745<br />
Currency translation −17 −2 − −1 −20<br />
Additions from business combinations 1 − − 0 1<br />
Other additions − 13 4 5 22<br />
Disposal 0 −3 − 0 −3<br />
Reclassification − 11 − −6 5<br />
As of December 31, <strong>2009</strong> 3,301 1,758 167 524 5,750<br />
Amortization and impairment losses<br />
As of January 1, 2008 128 986 100 337 1,551<br />
Currency translation − 3 − 0 3<br />
Additions from business combinations − 0 − 0 0<br />
Amortization − 104 8 39 151<br />
Impairment losses − 1 6 0 7<br />
Reversals of impairment losses − − − − 0<br />
Disposal −11 −41 − −1 −53<br />
Reclassification − 0 − 0 0<br />
As of December 31, 2008 117 1,053 114 375 1,659<br />
Currency translation − −2 − 0 −2<br />
Additions from business combinations − − − − 0<br />
Amortization − 95 9 31 135<br />
Impairment losses − 6 4 0 10<br />
Reversal of impairment losses − − − − 0<br />
Disposal − −3 − 0 −3<br />
Reclassification − − − 1 1<br />
As of December 31, <strong>2009</strong> 117 1,149 127 407 1,800<br />
Carrying amounts as of Dec. 31, 2008 3,200 686 49 151 4,086<br />
Carrying amounts as of Dec. 31, <strong>2009</strong> 3,184 609 40 117 3,950
Start Management report Consolidated financial statements Supplementary information<br />
Notes to the balance sheet<br />
The carrying amounts of goodwill are divided among the business areas as follows:<br />
Goodwill Growth rate in %<br />
in € million Dec. 31, <strong>2009</strong> Dec. 31, 2008 <strong>2009</strong> 2008<br />
Chemicals 2,734 2,733 1.5 1.5<br />
Energy 398 415 0.7 0.7<br />
Real Estate 40 40 1.0 1.0<br />
Corporate, other operations 12 12 1.0 –<br />
3,184 3,200<br />
As in the previous year, the goodwill allocated to the Chemicals Business Area principally relates to earlier<br />
acquisitions of shares in <strong>Evonik</strong> Degussa GmbH, Essen (Germany). The goodwill allocated to the Energy<br />
Business Area mainly relates to the earlier acquisitions of shares in <strong>Evonik</strong> Steag GmbH, Essen (Germany).<br />
As in the previous year, franchises, trademarks and licenses include trademarks with an indefinite useful<br />
life totaling €283 million. These relate exclusively to the Chemicals Business Area.<br />
Capitalized development costs mainly relate to the purchase price allocation for former purchases of shares<br />
in <strong>Evonik</strong> Degussa GmbH and the related recognition of hidden reserves. They are allocated in full to the<br />
Chemicals Business Area.<br />
As in the previous year, as of the reporting date there were no intangible assets to which title was restricted<br />
and no commitments to purchase intangible assets.<br />
<strong>Annual</strong> <strong>Report</strong> <strong>2009</strong> <strong>Evonik</strong> <strong>Industries</strong> 123
124<br />
(7.2) Property, plant and equipment<br />
in € million<br />
Cost of acquisition/production<br />
<strong>Annual</strong> <strong>Report</strong> <strong>2009</strong> <strong>Evonik</strong> <strong>Industries</strong><br />
Land, land<br />
rights and<br />
buildings<br />
Plant and<br />
machinery<br />
Other plant,<br />
office furniture<br />
and equipment<br />
Advance<br />
payments and<br />
construction<br />
in progress Total<br />
As of January 1, 2008 3,370 12,847 1,114 820 18,151<br />
Currency translation 9 20 −2 21 48<br />
Additions from business combinations 11 10 1 2 24<br />
Other additions 51 193 56 766 1,066<br />
Disposal −191 −894 −122 −34 −1,241<br />
Reclassification 49 293 19 −355 6<br />
As of December 31, 2008 3,299 12,469 1,066 1,220 18,054<br />
Currency translation −4 −7 2 0 −9<br />
Additions from business combinations 1 8 0 − 9<br />
Other additions 27 214 38 491 770<br />
Disposal −25 −28 −29 −10 −92<br />
Reclassification 60 489 16 −605 −40<br />
As of December 31, <strong>2009</strong> 3,358 13,145 1,093 1,096 18,692<br />
Depreciation and impairment losses<br />
As of January 1, 2008 1,783 9,864 903 35 12,585<br />
Currency translation 7 12 −2 2 19<br />
Additions from business combinations 6 8 0 − 14<br />
Depreciation 79 502 67 − 648<br />
Impairment losses 71 174 5 13 263<br />
Reversal of impairment losses −5 −1 0 0 −6<br />
Disposal −175 −855 −116 −25 −1,171<br />
Reclassification 6 2 −1 −1 6<br />
As of December 31, 2008 1,772 9,706 856 24 12,358<br />
Currency translation −4 −5 2 1 −6<br />
Additions from business combinations 0 3 0 − 3<br />
Depreciation 72 483 64 − 619<br />
Impairment losses 20 45 2 5 72<br />
Reversal of impairment losses −5 0 − − −5<br />
Disposal −17 −14 −28 − −59<br />
Reclassification 2 10 −4 −9 −1<br />
As of December 31, <strong>2009</strong> 1,840 10,228 892 21 12,981<br />
Carrying amounts as of Dec. 31, 2008 1,527 2,763 210 1,196 5,696<br />
Carrying amounts as of Dec. 31, <strong>2009</strong> 1,518 2,917 201 1,075 5,711<br />
The carrying amounts of assets from finance leases are €9 million (2008: €12 million) for land, land rights and<br />
buildings, €61 million (2008: €66 million) for plant and machinery and €3 million (2008: €4 million) for<br />
other plant, office furniture and equipment.
Start Management report Consolidated financial statements Supplementary information<br />
Notes to the balance sheet<br />
The carrying amounts of property, plant and equipment pledged as security for Group liabilities amounted<br />
to €159 million (2008: €85 million). A further €114 million (2008: €89 million) was subject to other restrictions<br />
on title.<br />
The Group has commitments of €179 million (2008: €422 million) to purchase property, plant and<br />
equipment.<br />
(7.3) Investment property<br />
in € million Land, land rights Buildings<br />
Cost of acquisition/production<br />
Buildings<br />
under<br />
construction Total<br />
As of January 1, 2008 341 2,134 0 2,475<br />
Currency translation 1 3 − 4<br />
Additions from business combinations − − − 0<br />
Other additions 4 47 − 51<br />
Disposal 0 −1 − −1<br />
Reclassification −21 −3 − −24<br />
As of December 31, 2008 325 2,180 0 2,505<br />
Currency translation 0 −1 − −1<br />
Additions from business combinations − − − 0<br />
Other additions 2 30 25 57<br />
Disposal −2 −5 0 −7<br />
Reclassification 3 13 17 33<br />
As of December 31, <strong>2009</strong> 328 2,217 42 2,587<br />
Depreciation and impairment losses<br />
As of January 1, 2008 13 959 0 972<br />
Currency translation − 2 − 2<br />
Additions from business combinations − − − 0<br />
Depreciation 0 43 − 43<br />
Impairment losses 0 8 − 8<br />
Reversal of impairment losses − −8 − −8<br />
Disposal 0 0 − 0<br />
Reclassification −5 −9 − −14<br />
As of December 31, 2008 8 995 0 1,003<br />
Currency translation − −1 − −1<br />
Additions from business combinations − − − 0<br />
Depreciation − 44 − 44<br />
Impairment losses 0 3 − 3<br />
Reversal of impairment losses −1 −2 − −3<br />
Disposal 0 −6 − −6<br />
Reclassification − −7 − −7<br />
As of December 31, <strong>2009</strong> 7 1,026 0 1,033<br />
Carrying amounts as of Dec. 31, 2008 317 1,185 0 1,502<br />
Carrying amounts as of Dec. 31, <strong>2009</strong> 321 1,191 42 1,554<br />
<strong>Annual</strong> <strong>Report</strong> <strong>2009</strong> <strong>Evonik</strong> <strong>Industries</strong> 125
126<br />
Other additions comprise retroactive acquisition costs of €23 million (2008: €32 million). The fair value of<br />
investment property was €2,850 million on the reporting date (2008: €2,778 million).<br />
The carrying amount of investment property with restrictions to title amounts to €1,039 million (2008:<br />
€1,118 million). This mainly comprises registered land charges for loans, which totaled €816 million on the<br />
reporting date (2008: €840 million).<br />
The income statement comprises operating expenses totaling €225 million (2008: €230 million) relating<br />
to investment property which generates rental revenues. Operating expenses for investment property which<br />
does not generate rental revenues were €9 million (2008: €7 million).<br />
Commitments to purchase real estate classified as investment property amounted to €13 million (2008:<br />
€12 million). Apart from this, there are only contractual commitments in respect of statutory obligations to<br />
undertake maintenance, repairs and improvements under rent contracts.<br />
(7.4) Investments recognized at equity and financial assets<br />
in € million Total<br />
<strong>Annual</strong> <strong>Report</strong> <strong>2009</strong> <strong>Evonik</strong> <strong>Industries</strong><br />
Dec. 31, <strong>2009</strong> Dec. 31, 2008<br />
thereof<br />
with a term<br />
to maturity<br />
of more<br />
than 1 year Total<br />
thereof<br />
with a term<br />
to maturity<br />
of more<br />
than 1 year<br />
Investments recognized at equity 626 626 604 604<br />
Other investments 117 117 112 112<br />
Loans 97 33 165 82<br />
Securities and similar claims 66 43 45 38<br />
Receivables from finance leases 1,004 923 1,117 1,036<br />
Receivables from derivatives 128 12 218 97<br />
Other financial assets 28 12 58 20<br />
2,066 1,766 2,319 1,989<br />
(a) Investments recognized at equity<br />
The key financial data from the last available financial statements of the main associated companies included<br />
at equity, based on <strong>Evonik</strong>’s stake, are as follows:<br />
in € million <strong>2009</strong> 2008<br />
Non-current assets as of December 31 115 99<br />
Current assets as of December 31 31 32<br />
Non-current liabilities as of December 31 51 33<br />
Current liabilities as of December 31 37 45<br />
Income 114 97<br />
Expenses 104 92
Start Management report Consolidated financial statements Supplementary information<br />
Notes to the balance sheet<br />
These data include the 54.4 percent stake in Kommanditgesellschaft Deutsche Gasrußwerke GmbH & Co., KG,<br />
Dortmund (Germany) and the 51 percent stakes in JSSi GmbH, Freiberg (Germany) and DSL. Japan Co., Ltd,<br />
Tokyo (Japan). These companies are accounted for at equity because <strong>Evonik</strong> does not have a majority of the<br />
voting rights.<br />
The key financial data from the last available financial statements of the main joint ventures recognized<br />
at equity, based on <strong>Evonik</strong>’s stake, are as follows:<br />
in € million <strong>2009</strong> 2008<br />
Non-current assets as of December 31 1,479 1,524<br />
Current assets as of December 31 165 198<br />
Non-current liabilities as of December 31 938 1,027<br />
Current liabilities as of December 31 169 177<br />
Income 536 504<br />
Expenses 483 450<br />
These data include the 80 percent stake in the power plant REG Raffinerie-Energie GmbH & Co. oHG,<br />
Cologne (Germany) and the 51 percent stake in Ayas Enerji Üretim ve Ticaret A.S., Ankara (Turkey). These<br />
companies are accounted for at equity because <strong>Evonik</strong> does not have a majority of the voting rights.<br />
(b) Other investments<br />
Other investments comprise investments in unlisted equity instruments that are recognized at the cost of<br />
acquisition since the fair value cannot be determined reliably.<br />
(c) Loans<br />
Loans are exposed to an interest-rate risk, which can affect their fair value or future cash flows. They are<br />
recognized at cost of acquisition.<br />
As of the reporting date the long-term loans of €13 million (2008: €15 million) included accumulated<br />
impairment losses of €5 million (2008: €8 million). <strong>Evonik</strong> did not renegotiate the terms and conditions of<br />
any long-term loans in <strong>2009</strong> (2008: €3 million). Non-impaired loans totaling €1 million (2008: none) were<br />
up to three months overdue.<br />
(d) Securities and similar claims<br />
Securities and similar claims are exposed to an interest-rate risk, which can affect their fair value or future<br />
cash flows. If no market price is available, they are valued at amortized cost. Securities listed on a stock<br />
exchange are exposed to a risk of changes in their market price.<br />
<strong>Annual</strong> <strong>Report</strong> <strong>2009</strong> <strong>Evonik</strong> <strong>Industries</strong> 127
128<br />
(e) Receivables from finance leases<br />
The reconciliation from gross investment in leasing arrangements to the present value of the minimum lease<br />
payments and their due dates is as follows:<br />
in € million Dec. 31, <strong>2009</strong> Dec. 31, 2008<br />
Gross investment 1,942 2,249<br />
(thereof non-guaranteed residual value) (−) (−)<br />
due within 1 year 231 246<br />
due in 1–5 years 857 909<br />
due in more than 5 years 854 1,094<br />
Interest included therein −937 −1,131<br />
Net investment 1,005 1,118<br />
Accumulated impairment losses −1 −1<br />
Carrying amount of receivables from finance leases 1,004 1,117<br />
less present value of non-guaranteed residual values − −<br />
Present value of outstanding minimum lease payments 1,004 1,117<br />
due within 1 year 81 81<br />
due in 1–5 years 408 382<br />
due in more than 5 years 515 654<br />
As in 2008, no contingent lease payments were received under finance leases. In 2008, an impairment loss<br />
was recognized for uncollectable outstanding minimum lease payments as insolvency proceedings were<br />
opened against the lessee.<br />
Receivables from finance leases include a contract for the supply of electricity by the Iskenderun power<br />
plant near Adana (Turkey) valued at €577 million (2008: €658 million). This contract runs for 20 years and<br />
ends in November 2019.<br />
A further €156 million (2008: €162 million) results from a supply contract for power from the Mindanao<br />
power station near Cagayan de Oro (Philippines). This contract with STE<strong>AG</strong> State Power Inc., Makati City<br />
(Philippines) runs for 25 years and ends in November 2031. The leased assets will be transferred to the lessee<br />
when the contract ends.<br />
Moreover, receivables from finance leases include €165 million (2008: €179 million) relating to the lease<br />
agreement for STE<strong>AG</strong>-Raffinerie-Kraftwerk-Sachsen-Anhalt, Leuna (Germany). This lease dates from November<br />
1996 and had an original term of twelve years. In 2006 it was extended for eight years to November 2016.<br />
(f) Receivables from derivatives<br />
The breakdown of receivables from derivatives is as follows:<br />
in € million Dec. 31, <strong>2009</strong> Dec. 31, 2008<br />
Receivables from currency derivatives 79 126<br />
Receivables from interest derivatives 3 42<br />
Receivables from commodity derivatives 46 50<br />
In <strong>2009</strong>, the receivables from interest derivatives related exclusively to interest caps.<br />
<strong>Annual</strong> <strong>Report</strong> <strong>2009</strong> <strong>Evonik</strong> <strong>Industries</strong><br />
128 218
Start Management report Consolidated financial statements Supplementary information<br />
Notes to the balance sheet<br />
(g) Security<br />
Financial assets pledged as security for Group liabilities amounted to €528 million (2008: €606 million). A<br />
further €402 million (2008: €425 million) were subject to other restrictions on title. The majority of the assets<br />
pledged as collateral are receivables from finance leases of the project companies involved in the Iskenderun<br />
and Mindanao power plants. The pledges relate to borrowing of €497 million by these companies. The collateral<br />
can only be utilized by the banks providing this financing in the event of permanent non-performance<br />
of contractual obligations, for example, non-payment of interest and repayment installments, or failure to<br />
achieve agreed financial covenants. Utilization of the collateral is not anticipated.<br />
(7.5) Inventories<br />
in € million Dec. 31, <strong>2009</strong> Dec. 31, 2008<br />
Raw materials and supplies 571 668<br />
Work in progress 147 150<br />
Finished goods 872 1,378<br />
1,590 2,196<br />
In <strong>2009</strong> impairment losses on raw materials and supplies and goods totaling €23 million were recognized in<br />
income (2008: €45 million) while reversals of impairment losses were negligible (2008: €2 million).<br />
The carrying amounts of inventories pledged as security for Group liabilities amounted to €42 million<br />
(2008: €54 million).<br />
(7.6) Trade accounts receivable and other receivables<br />
in € million Total<br />
Dec. 31, <strong>2009</strong> Dec. 31, 2008<br />
thereof<br />
with a term<br />
to maturity<br />
of more<br />
than 1 year Total<br />
thereof<br />
with a term<br />
to maturity<br />
of more<br />
than 1 year<br />
Trade accounts receivable 2,148 – 2,572 –<br />
Advance payments made 43 – 41 –<br />
Miscellaneous other receivables 293 31 355 41<br />
Deferred expenses 76 25 76 32<br />
2,560 56 3,044 73<br />
Trade accounts receivable totaling €41 million on the reporting date (2008: €163 million) were impaired by<br />
€20 million (2008: €45 million). €153 million (2008: €272 million) of the non-impaired trade accounts<br />
receivable were overdue on the balance sheet date.<br />
in € million Dec. 31, <strong>2009</strong> Dec. 31, 2008<br />
Overdue trade accounts receivable<br />
up to 3 months 142 259<br />
more than 3 months and up to 6 months 6 7<br />
more than 6 months and up to 9 months 3 3<br />
more than 9 months and up to 12 months − 2<br />
more than 1 year 2 1<br />
153 272<br />
<strong>Annual</strong> <strong>Report</strong> <strong>2009</strong> <strong>Evonik</strong> <strong>Industries</strong> 129
130<br />
The terms for trade accounts receivable totaling €1 million (2008: €2 million) were renegotiated and would<br />
otherwise have been impaired or overdue.<br />
Receivables pledged as security for Group liabilities amounted to €5 million (2008: €5 million). €3 million<br />
(2008: €8 million) were subject to other restrictions on title. In the previous year a further €1 million was<br />
pledged for guarantees granted.<br />
(7.7) Cash and cash equivalents<br />
The cash and cash equivalents totaling €885 million (2008: €536 million) include balances with banks, checks<br />
and cash. This item also includes financial securities with high liquidity and terms of no more than three months<br />
on the date of acquisition. The carrying amounts of cash and cash equivalents pledged as security amounted<br />
to €240 million (2008: €151 million). These majority of the pledged cash and cash equivalents are deposited<br />
in tied project accounts in connection with two foreign power plant projects, in Iskenderun and Mindanao.<br />
Surplus liquidity can be distributed to the shareholders in the project companies once the original purpose<br />
has been fulfilled.<br />
(7.8) Equity<br />
(a) Issued capital<br />
As in the previous year, the company’s fully paid-up capital stock was €466,000,000 on the reporting date<br />
and is divided into 466,000,000 non-par bearer shares. R<strong>AG</strong>-Stiftung notified <strong>Evonik</strong> <strong>Industries</strong> <strong>AG</strong> pursuant<br />
to Section 20, Paragraph 4 of the German Stock Corporation Act (AktG) that it directly holds a majority of<br />
the shares in <strong>Evonik</strong> <strong>Industries</strong> <strong>AG</strong>. Gabriel Acquisitions GmbH (Gabriel Acquisitions), Cologne (Germany)<br />
notified <strong>Evonik</strong> <strong>Industries</strong> <strong>AG</strong> pursuant to Section 20 Paragraph 1 of the German Stock Corporation Act<br />
(AktG) that it directly holds more than a quarter of the shares in <strong>Evonik</strong> <strong>Industries</strong> <strong>AG</strong>. Further, the following<br />
companies have submitted notification pursuant to Section 20 Paragraph 1 of the German Stock Corporation<br />
Act (AktG) that they indirectly hold over a quarter of the shares in <strong>Evonik</strong> <strong>Industries</strong> <strong>AG</strong> through their investment<br />
in Gabriel Acquisitions: Gabriel Investments S.à r.l., Gabriel Holdings S.à r.l., CVC European Equity<br />
Partners V (A) L.P., CVC European Equity Partners V (B) L.P., CVC European Equity Partners V (C) L.P.,<br />
CVC European Equity Partners V (D) L.P., CVC European Equity Partners V (E) L.P., CVC European Equity V<br />
Ltd., CVC European Equity Partners Tandem (A) L.P., CVC European Equity Partners Tandem (B) L.P.,<br />
CVC European Equity Partners Tandem (C) L.P., CVC European Equity Tandem GP Ltd., CVC Capital Partners<br />
Advisory Company Ltd., CVC Capital Partners Finance Ltd., Clear Vision Capital Fund SICAV-FIS S.A.,<br />
CVC Nominees Ltd.<br />
(b) Capital reserve<br />
The capital reserve contains all other payments received from shareholders pursuant to Section 272 Paragraph<br />
2 No. 4 of the German Commercial Code.<br />
(c) Accumulated income/loss after taxes<br />
The accumulated income of €3,525 million (2008: €3,562 million) comprises Group earnings received in fiscal<br />
<strong>2009</strong> and previous years. Income after taxes corresponds to the net income attributable to shareholders of<br />
<strong>Evonik</strong> <strong>Industries</strong> <strong>AG</strong>, as stated in the income statement for fiscal <strong>2009</strong>. However, under German stock corporation<br />
law, only profit reserves from the separate financial statements drawn up by <strong>Evonik</strong> <strong>Industries</strong> <strong>AG</strong><br />
which are not subject to any restrictions are available for distribution. As of December 31, <strong>2009</strong>, <strong>Evonik</strong><br />
<strong>Industries</strong> <strong>AG</strong>’s profit reserves totaled €3,371 million, as in the previous year. €47 million of this comprises<br />
the statutory reserve that is not available for distribution.<br />
A proposal will be submitted to the Shareholders’ Meeting that €320 million should be distributed for <strong>2009</strong>.<br />
That corresponds to a dividend of around €0.69 per non-par share.<br />
<strong>Annual</strong> <strong>Report</strong> <strong>2009</strong> <strong>Evonik</strong> <strong>Industries</strong>
Start Management report Consolidated financial statements Supplementary information<br />
Notes to the balance sheet<br />
(d) Accumulated other comprehensive income<br />
Accumulated other comprehensive income contains gains and losses that are not included in the income<br />
statement. The reserve for unrealized gains and losses on available-for-sale securities contains remeasurement<br />
amounts resulting from changes in the value of financial instruments that are expected to be temporary<br />
and thus not charged to income. The reserve for unrealized gains and losses on hedging instruments<br />
comprises changes in the fair value of the effective portion of cash flow hedges and net investment<br />
hedges. The reserve for revaluation surplus for acquisitions made in stages contains the change in the fair<br />
value of shares previously held in subsidiaries that are consolidated for the first time. The reserve for currency<br />
translation adjustment comprises differences arising from the translation of foreign financial statements.<br />
The components of accumulated other comprehensive income (OCI) changed as follows:<br />
in € million<br />
Unrealized<br />
gains/losses<br />
on available-for-<br />
sale securities<br />
Unrealized<br />
gains/losses<br />
on hedging<br />
instruments<br />
Revaluation<br />
surplus for<br />
acquisitions<br />
in stages<br />
Currency<br />
translation<br />
adjustment<br />
Accumulated<br />
other<br />
comprehensive<br />
income<br />
As of January 1, 2008 8 79 56 −454 −311<br />
Other comprehensive income as in the<br />
statement of comprehensive income −6 −79 0 −116 −201<br />
Gains/losses included in OCI −9 −119 − −128<br />
Deferred taxes thereon 3 37 − 40<br />
Amounts reclassified from OCI to the<br />
income statement − 4 4<br />
Deferred taxes thereon − −1 −1<br />
Currency translation adjustment −116 −116<br />
Other changes − − −5 −2 −7<br />
As of December 31, 2008 2 0 51 −572 −519<br />
Other comprehensive income as in the<br />
statement of comprehensive income 3 72 0 20 95<br />
Gains/losses included in OCI 5 −2 − 3<br />
Deferred taxes thereon −2 0 − −2<br />
Amounts reclassified from OCI<br />
to the income statement − 80 80<br />
Deferred taxes thereon − −11 −11<br />
Amounts reclassified from OCI and<br />
recognized in the first-time measurement<br />
of assets or liabilities 5 5<br />
Deferred taxes thereon − 0<br />
Currency translation adjustment 20 20<br />
Other changes − − −5 1 −4<br />
As of December 31, <strong>2009</strong> 5 72 46 −551 −428<br />
<strong>Annual</strong> <strong>Report</strong> <strong>2009</strong> <strong>Evonik</strong> <strong>Industries</strong> 131
132<br />
In <strong>2009</strong>, €80 million (2008: €4 million) was reclassified from the reserve for changes in the fair value of<br />
financial instruments in hedge relationships to the income statement. €3 million (2008: €23 million) of this<br />
was recognized in sales, €82 million (2008: €30 million) in the cost of sales, €7 million (2008: €1 million) in<br />
other operating expenses and €6 million (2008: €4 million in other operating income).<br />
(e) Non-controlling interests<br />
Non-controlling interests comprise shares in the issued capital and reserves of consolidated subsidiaries that<br />
are not attributable to the shareholders of <strong>Evonik</strong> <strong>Industries</strong> <strong>AG</strong>.<br />
The changes in accumulated other comprehensive income (OCI) relating to non-controlling interests<br />
were as follows:<br />
in € million<br />
<strong>Annual</strong> <strong>Report</strong> <strong>2009</strong> <strong>Evonik</strong> <strong>Industries</strong><br />
Unrealized<br />
gains/losses<br />
on available-for-<br />
sale securities<br />
Unrealized<br />
gains/losses<br />
on hedging<br />
instruments<br />
Revaluation<br />
surplus for<br />
acquisitions<br />
in stages<br />
Currency<br />
translation<br />
adjustment<br />
Accumulated<br />
other<br />
comprehensive<br />
income<br />
As of January 1, 2008 1 4 0 −101 −96<br />
Other comprehensive income as in the<br />
statement of comprehensive income 0 −14 0 23 9<br />
Gains/losses included in OCI − −20 − −20<br />
Deferred taxes thereon − 6 − 6<br />
Currency translation adjustment 23 23<br />
Other changes − − − 5 5<br />
As of December 31, 2008 1 −10 0 −73 −82<br />
Other comprehensive income as in the<br />
statement of comprehensive income −1 −2 0 −14 −17<br />
Gains/losses included in OCI −1 −6 − −7<br />
Deferred taxes thereon − 1 − 1<br />
Amounts reclassified from OCI<br />
to the income statement − 4 4<br />
Deferred taxes thereon − −1 −1<br />
Currency translation adjustment −14 −14<br />
Other changes − − − − 0<br />
As of December 31, <strong>2009</strong> 0 −12 0 −87 −99
Start Management report Consolidated financial statements Supplementary information<br />
Notes to the balance sheet<br />
(7.9) Provisions for pensions and other post-employment benefits<br />
Provisions for pensions are established to cover benefit plans for retirement, disability and surviving dependents’<br />
pensions. The benefit obligations vary depending on the legal, tax and economic circumstances in the<br />
various countries in which the companies operate. The level of the benefit obligations generally depends on<br />
length of service and remuneration.<br />
Germany accounted for around 94.3 percent (2008: 95.5 percent) and thus the vast majority of provisions<br />
for pensions on the reporting date.<br />
At the German companies, occupational pension plans are predominantly defined benefit plans. They are<br />
primarily funded by provisions and pension fund assets.<br />
The pension plans at foreign companies may be either defined contribution or defined benefit plans.<br />
The table shows the expected return on plan assets and the weighted average assumptions used for the<br />
actuarial valuation of the obligations:<br />
Group Germany<br />
in % <strong>2009</strong> 2008 <strong>2009</strong> 2008<br />
Discount rate as of December 31 5.54 6.02 5.50 6.00<br />
Future salary increases 2.63 2.68 2.53 2.50<br />
Future pension increases 2.07 2.02 2.00 2.00<br />
Expected return on plan assets as of December 31 5.35 5.41 5.00 5.00<br />
Health-care cost trend 7.28 7.45 – –<br />
The expected return on plan assets is derived from published capital market reports and forecasts and in-house<br />
experience for each class of assets.<br />
The present value of the defined benefit obligation changed as follows in fiscal <strong>2009</strong>:<br />
in € million <strong>2009</strong> 2008<br />
Present value of the defined benefit obligation as of January 1 6,815 7,078<br />
Current service cost 92 100<br />
Interest cost 400 380<br />
Employee contributions 34 35<br />
Actuarial gains and losses 482 −269<br />
Benefits paid −407 −395<br />
Past service cost 1 15<br />
Additions from business combinations 0 −5<br />
Reclassification pursuant to IFRS 5 − −36<br />
Curtailments −1 −1<br />
Currency translation 14 −87<br />
Present value of the defined benefit obligation as of December 31 7,430 6,815<br />
<strong>Annual</strong> <strong>Report</strong> <strong>2009</strong> <strong>Evonik</strong> <strong>Industries</strong> 133
134<br />
The fair value of the plan assets changed as follows in fiscal <strong>2009</strong>:<br />
in € million <strong>2009</strong> 2008<br />
Fair value of plan assets as of January 1 2,910 3,058<br />
Expected return on plan assets 155 165<br />
Employer contributions 94 90<br />
Employee contributions 14 13<br />
Actuarial gains and losses 116 −152<br />
Benefits paid −151 −146<br />
Reclassification pursuant to IFRS 5 − −7<br />
Currency translation 23 −111<br />
Fair value of plan assets as of December 31 3,161 2,910<br />
The actual return on plan assets was €271 million in fiscal <strong>2009</strong> (2008: €13 million).<br />
Employer contributions of €70 million are expected to be incurred for 2010.<br />
The next table shows the present value of all defined benefit obligations, the fair value of plan assets,<br />
the funded status and experience adjustments to actuarial gains (+) and losses (−) for the defined benefit<br />
obligation and plan assets over time:<br />
in € million <strong>2009</strong> 2008 2007 2006 2005<br />
Present value of the defined benefit<br />
obligation as of December 31 7,430 6,815 7,078 8,034 8,494<br />
Fair value of plan assets as of December 31 3,161 2,910 3,058 3,138 3,115<br />
Funded status as of December 31 4,269 3,905 4,020 4,896 5,379<br />
Experience adjustments to the defined<br />
benefit obligation −37 −21 −39 −47 −64<br />
Experience adjustments to plan assets 116 −152 −129 −14 −50<br />
The funded status, which is defined as the difference between the present value of the defined benefit obligation<br />
and the fair value of the plan assets, is reconciled with the pension provisions shown in the balance<br />
sheet as follows:<br />
in € million Dec. 31, <strong>2009</strong> Dec. 31, 2008 Jan. 1, 2008<br />
Present value of the defined benefit obligation 7,430 6,815 7,078<br />
Fair value of plan assets 3,161 2,910 3,058<br />
Funded status 4,269 3,905 4,020<br />
Unrecognized past service cost −1 – 1<br />
Unrecognized actuarial loss −481 −216 −225<br />
Other changes (including asset ceiling and IFRIC 14) 192 264 160<br />
Pension provisions recognized on the balance sheet 3,979 3,953 3,956<br />
<strong>Annual</strong> <strong>Report</strong> <strong>2009</strong> <strong>Evonik</strong> <strong>Industries</strong>
Start Management report Consolidated financial statements Supplementary information<br />
Notes to the balance sheet<br />
As of the reporting date, €4,169 million (2008: €3,864 million) of the present value of all defined benefit<br />
obligations was unfunded and €3,185 million (2008: €2,880 million) was fully or partially funded. In addition,<br />
there were health-care obligations totaling €76 million (2008: €71 million). For an explanation of the impact<br />
of changes in the cost trends in the health-care sector, see Note (4).<br />
The fair value of plan assets totaling €3,161 million on the reporting date (2008: €2,910 million) was split<br />
as follows: 12.8 percent (2008: 11.4 percent) in shares, 81.1 percent (2008: 80.1 percent) in debt instruments,<br />
0.4 percent (2000: 0.7 percent) in real estate and 5.7 percent (2008: 7.8 percent) in other assets. Shares<br />
amounting to €119 million (2008: €114 million) were hedged. On the reporting date, €23 million (2008:<br />
€22 million) was invested in real estate used by the company.<br />
The pension provisions include concessionary coal and power allowances in Germany and the entitlements<br />
of retirees of US companies to receive health-care benefits.<br />
The actuarial loss was €481 million (2008: €216 million) and thus outside the permitted corridor in some<br />
cases. The corridor and amortization are calculated separately for each plan recognized.<br />
The total expense for the defined benefit obligation is broken down as follows:<br />
in € million <strong>2009</strong> 2008<br />
Current service cost 92 100<br />
Interest cost 404 380<br />
Expected return on plan assets −157 −165<br />
Amortization 95 −83<br />
Effect of curtailments and settlements 0 −1<br />
Effect of asset ceiling −73 117<br />
Net pension expense 361 348<br />
Preventive health-care benefits accounted for €5 million of the total expense (2008: €4 million). Further,<br />
€4 million of the interest cost and €2 million of the expected return on plan assets relate to companies classified<br />
as held for sale, see Note (5.3).<br />
Interest cost and the expected return on plan assets are included in net interest expense, see Note (6.4),<br />
while the other amounts are allocated to the functional areas as personnel expense (pension expenses).<br />
A breakdown of overall personnel expense is given in Note (11.2).<br />
A total of €10 million (2008: €9 million) was paid into foreign defined-contribution plans, which are<br />
also included in personnel expense (pension expenses).<br />
Further, €153 million (2008: €158 million) was paid into defined-contribution state plans (statutory<br />
pension insurance). This is reported in personnel expense (expenses for social security contributions).<br />
<strong>Annual</strong> <strong>Report</strong> <strong>2009</strong> <strong>Evonik</strong> <strong>Industries</strong> 135
136<br />
(7.10) Other provisions<br />
in € million Total<br />
<strong>Annual</strong> <strong>Report</strong> <strong>2009</strong> <strong>Evonik</strong> <strong>Industries</strong><br />
Dec. 31, <strong>2009</strong> Dec. 31, 2008<br />
thereof<br />
with a term<br />
to maturity<br />
of more<br />
than 1 year Total<br />
thereof<br />
with a term<br />
to maturity<br />
of more<br />
than 1 year<br />
Personnel-related 895 481 967 476<br />
Recultivation and environmental protection 238 203 252 212<br />
Restructuring 189 115 135 65<br />
Sales and procurement 145 9 172 9<br />
Other taxes and interest on taxes 76 36 128 43<br />
Dismantling obligations 71 69 81 76<br />
Other obligations 538 178 601 183<br />
Other provisions changed as follows in fiscal <strong>2009</strong>:<br />
in € million<br />
Personnel-<br />
related<br />
Recultivation,<br />
environmental<br />
protection<br />
Restruc- Sales,<br />
turing procurement<br />
2,152 1,091 2,336 1,064<br />
Other<br />
taxes,<br />
interest<br />
on taxes<br />
Dismantling<br />
obligations Other Total<br />
As of Jan. 1, <strong>2009</strong> 967 252 135 172 128 81 601 2,336<br />
Additions 445 18 108 117 50 1 275 1,014<br />
Utilization −484 −29 −29 −122 −99 −1 −246 −1,010<br />
Reversal −71 −2 −23 −23 −3 −3 −104 −229<br />
Addition of acrrued<br />
interest/interest rate<br />
adjustments 36 −3 3 − − 2 4 42<br />
Other 2 2 −5 1 − −9 8 −1<br />
As of Dec. 31, <strong>2009</strong> 895 238 189 145 76 71 538 2,152<br />
Personnel-related provisions are established for a number of different reasons and include provisions for<br />
bonuses and other variable remuneration, statutory and other early retirement arrangements, unused<br />
vacation entitlements, lifetime working arrangements and anniversary bonuses. The vast majority of these<br />
provisions will be due for payment within five years.<br />
Provisions are established for recultivation and environmental protection on the basis of laws, contracts<br />
and regulatory requirements. They cover soil reclamation obligations, water protection, the recultivation of<br />
landfills and site decontamination obligations. Only a small proportion of these provisions will result in payments<br />
in the short term; the majority will result in longer term payments in the period up to 2014.<br />
Provisions for restructuring are based on defined restructuring measures. Such measures comprise programs<br />
which are planned and controlled by the company and will materially alter one of the company’s areas of<br />
business activity or the way in which a business activity is carried out. Restructuring provisions may only be<br />
established for costs that are directly attributable to the restructuring program. These include severance packages,<br />
redundancy and early retirement arrangements, expenses for the termination of contracts, dismantling<br />
and soil reclamation expenses, rents for unused facilities and all other shutdown and wind-up expenses. The<br />
majority will be utilized within five years.
Start Management report Consolidated financial statements Supplementary information<br />
Notes to the balance sheet<br />
The provisions for sales and procurement relate principally to guarantee obligations, outstanding commission<br />
payments, price discounts and rebates, impending losses and goods and services procured for which no<br />
invoice has yet been received. Almost all of these provisions will be utilized within one year.<br />
Provisions for other taxes and interest on taxes mainly comprise property tax, value-added tax and interest<br />
obligations relating to all types of taxes. They will give rise to current and non-current payments within<br />
five years.<br />
Provisions for dismantling obligations relate to dismantling that is not part of a restructuring program.<br />
Most of these provisions are long-term and will be utilized in the period after 2014.<br />
Provisions for other obligations include litigation risks, legal and consultancy expenses, audit expenses,<br />
the obligation to return emission allowances, purchase price adjustments, guarantees and indemnities relating<br />
to divestment projects. Most of these will give rise to payments by the end of 2010.<br />
Companies in the <strong>Evonik</strong> Group are involved in legal disputes and court cases, including class actions in<br />
the USA and Canada and other claims for compensation relating to actual or alleged price-fixing. The outcome<br />
of such legal disputes and litigation cannot be predicted accurately. Adequate provisions have been<br />
established to cover the possible unfavorable outcome of such disputes and legal expenses.<br />
(7.11) Financial liabilities<br />
Dec. 31, <strong>2009</strong> Dec. 31, 2008<br />
thereof<br />
thereof<br />
with a term<br />
with a term<br />
to maturity<br />
to maturity<br />
of more<br />
of more<br />
in € million Total than 1 year Total than 1 year<br />
Bonds 2,040 2,040 1,290 1,290<br />
Liabilities to banks 2,047 1,762 3,477 2,810<br />
Loans from non-banks 71 53 51 45<br />
Liabilities from finance leases 114 93 132 112<br />
Liabilities from derivatives 102 54 272 67<br />
Other financial liabilities 121 38 180 70<br />
4,495 4,040 5,402 4,394<br />
(a) Bonds, liabilities to banks<br />
The amount stated under bonds includes, for the first time, a bond issued by <strong>Evonik</strong> <strong>Industries</strong> <strong>AG</strong> with a<br />
nominal value of €750 million. This matures in 2014 and has an annual coupon of 7.000 percent. It is recognized<br />
at the issue price of 99.489 percent and the discount is credited over the maturity of the bond using<br />
the effective interest rate method.<br />
This item also includes a corporate bond issued by <strong>Evonik</strong> Degussa GmbH with a nominal value of<br />
€1,250 million. This bond matures in 2013 and has an annual coupon of 5.125 percent. It is recognized at the<br />
issue price of 98.99 percent and the discount is credited over the maturity of the bond using the effective<br />
interest rate method.<br />
The accrual of €16 million (2008: €4 million) for payment of the coupon on these bonds is reflected in<br />
current loans from non-banks.<br />
The liabilities to banks include low-interest loans from public-sector banks to finance subsidized residential<br />
properties in the Real Estate Business Unit. These are reported at fair value. The difference between the fair<br />
value and the amount disbursed is shown as deferred income, see Note (7.12).<br />
Further, <strong>Evonik</strong> <strong>Industries</strong> <strong>AG</strong> issued its first promissory note, with a nominal value of around €184 million.<br />
This matures in 2013 and is recognized mainly in liabilities to banks.<br />
<strong>Annual</strong> <strong>Report</strong> <strong>2009</strong> <strong>Evonik</strong> <strong>Industries</strong> 137
138<br />
In 2008 this item also included drawings of €1,479 million on an unsecured syndicated credit facility. None<br />
of this facility was drawn at year end <strong>2009</strong>. Interest on amounts drawn under this syndicated credit facility<br />
is based on EURIBOR plus a margin.<br />
Fixed-interest bonds are exposed to a risk of price fluctuations while variable-rate liabilities to banks are<br />
exposed to an interest-rate risk. These risks may affect their fair value or future cash flows. The stock market<br />
price of the bond issued by <strong>Evonik</strong> <strong>Industries</strong> <strong>AG</strong> was 107.8 percent on the reporting date, valuing it at<br />
€809 million. The stock market price of the bond issued by <strong>Evonik</strong> Degussa GmbH was 103.05 percent on<br />
the reporting date, valuing it at €1,288 million (2008: €1,260 million).<br />
The Group has not infringed the payment terms agreed for its financial liabilities.<br />
(b) Liabilities from finance leases<br />
Liabilities from finance leases are recognized if the leased assets are capitalized under property, plant and<br />
equipment as economic assets belonging to the Group. The reconciliation from the future minimum lease<br />
payments to their present values and their due dates are as follows:<br />
in € million Dec. 31, <strong>2009</strong> Dec. 31, 2008<br />
Future minimum lease payments 167 191<br />
due within 1 year 30 32<br />
due in 1–5 years 78 117<br />
due in more than 5 years 59 42<br />
Interest included therein −53 −59<br />
Present value of future minimum leases payments (liabilities from finance leases) 114 132<br />
due within 1 year 21 20<br />
due in 1–5 years 52 64<br />
due in more than 5 years 41 48<br />
(c) Liabilities from derivatives<br />
The breakdown of liabilities from derivatives is as follows:<br />
in € million Dec. 31, <strong>2009</strong> Dec. 31, 2008<br />
Liabilities from currency derivatives 30 103<br />
Liabilities from interest derivatives 33 51<br />
Liabilities from commodity derivatives 39 118<br />
<strong>Annual</strong> <strong>Report</strong> <strong>2009</strong> <strong>Evonik</strong> <strong>Industries</strong><br />
102 272
Start Management report Consolidated financial statements Supplementary information<br />
(7.12) Trade accounts payable and other payables<br />
Notes to the balance sheet<br />
in € million Total<br />
Dec. 31, <strong>2009</strong> Dec. 31, 2008<br />
thereof<br />
with a term<br />
to maturity<br />
of more<br />
than 1 year Total<br />
thereof<br />
with a term<br />
to maturity<br />
of more<br />
than 1 year<br />
Trade accounts payable 1,365 − 1,463 −<br />
Advance payments received 109 3 84 15<br />
Miscellaneous other payables 244 33 179 11<br />
Deferred income 411 359 453 358<br />
2,129 395 2,179 384<br />
The Real Estate Business Area offset €79 million (2008: €77 million) in utility charges and heating costs that<br />
can be allocated to tenants against prepayments from tenants for these costs.<br />
Deferred income includes accrued government grants amounting €257 million (2008: €269 million) which<br />
represents the benefit arising from low-interest loans from public-sector banks to finance subsidized residential<br />
properties, see Note (7.11). The deferred income is released over the term of the loans in the same<br />
amount as the interest on the loans. The amount is recognized in sales if the low-interest loan was granted<br />
as rental revenues forgone as a result of rent caps. If the interest benefit was granted in connection with an<br />
investment, the amount released from deferred income over the period in which the benefit is granted is<br />
recognized in other operating income.<br />
(7.13) Deferred taxes, other income taxes<br />
The breakdown of deferred taxes and other income taxes reported on the balance sheet by due date is shown<br />
in the table:<br />
in € million Total<br />
Dec. 31, <strong>2009</strong> Dec. 31, 2008 Jan. 1, 2008<br />
thereof<br />
with a term<br />
to maturity<br />
of more<br />
than 1 year Total<br />
thereof<br />
with a term<br />
to maturity<br />
of more<br />
than 1 year Total<br />
thereof<br />
with a term<br />
to maturity<br />
of more<br />
than 1 year<br />
Deferred tax assets 392 268 364 170 383 226<br />
Other income tax assets 199 40 166 36 73 29<br />
Deferred tax liabilities 626 581 687 627 761 644<br />
Other income tax liabilities 312 61 317 120 397 191<br />
In accordance with IAS 1 Presentation of Financial Statements, the current elements of deferred taxes are<br />
reported on the balance sheet under non-current assets and liabilities.<br />
<strong>Annual</strong> <strong>Report</strong> <strong>2009</strong> <strong>Evonik</strong> <strong>Industries</strong> 139
140<br />
Deferred taxes relate to the following balance sheet items:<br />
<strong>Annual</strong> <strong>Report</strong> <strong>2009</strong> <strong>Evonik</strong> <strong>Industries</strong><br />
Deferred tax assets Deferred tax liabilities<br />
in € million Dec. 31, <strong>2009</strong> Dec. 31, 2008 Jan. 1, 2008 Dec. 31, <strong>2009</strong> Dec. 31, 2008 Jan. 1, 2008<br />
Assets<br />
Intangible assets 8 17 12 234 264 318<br />
Property, plant and equipment,<br />
investment property 321 370 333 629 629 676<br />
Financial assets 19 10 26 285 393 333<br />
Inventories 135 153 121 28 42 38<br />
Receivables and other assets 10 29 6 29 42 58<br />
Liabilities<br />
Provisions 435 439 535 54 77 99<br />
Payables 145 151 123 105 69 45<br />
Special tax allowance reserves<br />
(based on local law) − − − 43 52 22<br />
Loss carryforwards 196 224 195 − − −<br />
Tax credits 2 − 4 − − −<br />
Other 16 13 38 15 24 10<br />
Deferred taxes (gross) 1,287 1,406 1,393 1,422 1,592 1,599<br />
Write-downs −99 −137 −172 − − −<br />
Netting −796 −905 −838 −796 −905 −838<br />
Deferred taxes (net) 392 364 383 626 687 761<br />
No deferred tax assets were recognized on temporary differences of €912 million (2008: €1,048 million)<br />
because it is not probable that future taxable income will enable them to be realized. €29 million of this<br />
(2008: €85 million) relates to the interest ceiling pursuant to Section 8 a of the German Corporate Income<br />
Tax Act (KStG) in conjunction with Section 4 h of the German Income Tax Act (EStG).<br />
In addition to tax loss carryforwards for which deferred taxes were recognized, there are tax loss carryforwards<br />
that are not utilizable and for which no deferred taxes are recognized. These are shown in the<br />
table, together with their expiry dates:<br />
Corporation taxes<br />
(German and foreign)<br />
Local taxes<br />
(German and foreign) Tax credits (foreign)<br />
in € million <strong>2009</strong> 2008 <strong>2009</strong> 2008 <strong>2009</strong> 2008<br />
Up to 1 year 7 3 2 1 − −<br />
2–5 years 79 42 1 36 − −<br />
6–10 years − 384 − 9 − −<br />
Unlimited 531 548 1,333 1,129 155 157<br />
617 977 1,336 1,175 155 157
Start Management report Consolidated financial statements Supplementary information<br />
(8) Notes to the cash flow statement<br />
Notes to the cash flow statement<br />
The cash flow statement shows the changes in cash and cash equivalents of the Group in the reporting period.<br />
It is broken down into cash flows from operating, investing and financing activities and reflects cash flows<br />
from continuing and discontinued operations. The impact of changes in the scope of consolidation has been<br />
eliminated.<br />
Interest paid and interest and dividends received are included in operating activities while dividends paid<br />
are assigned to financing activities.<br />
(8.1) Cash flow from operating activities<br />
The cash flow from operating activities is calculated using the indirect method. Income before the financial<br />
result and income taxes from the continuing operations is adjusted for the effects on non-cash income and<br />
expenses and items that are allocated to investing or financing activities. Certain other changes in amounts<br />
shown on the balance sheet are calculated and added to the result. The net cash flow generated by the discontinued<br />
operations with external counterparties is shown as an aggregate.<br />
(8.2) Cash flow from investing activities<br />
The cash flow from investing activities includes cash inflows and outflows from acquisitions and divestments<br />
of subsidiaries.<br />
The total purchase price for shares in subsidiaries consolidated for the first time was negligible in <strong>2009</strong><br />
(2008: €11 million). In <strong>2009</strong>, as in 2008, the entire purchase price for such transactions resulted in cash outflows.<br />
The cash and cash equivalents acquired in <strong>2009</strong> and 2008 were negligible.<br />
The total selling prices of subsidiaries divested in <strong>2009</strong> was €73 million (2008: €406 million), all of which<br />
was settled in cash and cash equivalents (2008: €392 million). Divestments included outflows of cash and<br />
cash equivalents totaling €15 million (2008: €64 million).<br />
Further, cash inflows from divestments in <strong>2009</strong> included €42 million from the sale in 2008 of a company<br />
that had been included at equity. In 2008, cash inflows of €14 million were recorded from the sale of shares<br />
in connection with the mining technology activities divested in 2007.<br />
(8.3) Cash and cash equivalents<br />
The cash and cash equivalents of €885 million (2008: €542 million) comprise the liquid assets of the continuing<br />
operations as well as liquid assets relating to assets held for sale in the previous year. Since the cash and<br />
cash equivalents assigned to the assets held for sale have to be reclassified in the balance sheet in accordance<br />
with IFRS 5 Non-current Assets Held for Sale and Discontinued Operations, see Note (5.3), a reconciliation<br />
is provided from the cash and cash equivalents shown in the cash flow statement and the balance sheet, see<br />
Note (7.7).<br />
<strong>Annual</strong> <strong>Report</strong> <strong>2009</strong> <strong>Evonik</strong> <strong>Industries</strong> 141
142<br />
(9) Notes on the segment report<br />
The segment report provides an overview of the earnings and asset position of the continuing operations<br />
by operating segments and regions. In compliance with IFRS 8 Operating Segments, segment reporting is<br />
presented using the same structure as internal reporting to the Executive Board of <strong>Evonik</strong> <strong>Industries</strong> <strong>AG</strong><br />
(management approach).<br />
(9.1) <strong>Report</strong>ing based on operating segments<br />
The reporting based on operating segments comprises the Chemicals, Energy and Real Estate Business Areas.<br />
The following adjustment was made to the reporting structure in <strong>2009</strong>:<br />
As of January 1, 2008 <strong>Evonik</strong> Steag GmbH, Essen (Germany) acquired from <strong>Evonik</strong> Degussa GmbH, Essen<br />
(Germany) 50 percent of the shares in Infracor GmbH, Marl (Germany). This stake was transferred back to<br />
<strong>Evonik</strong> Degussa GmbH effective December 31, <strong>2009</strong>. The segment report for fiscal <strong>2009</strong> adopts the new<br />
structure. The prior-year figures have been restated accordingly.<br />
The Group’s activities are outlined below:<br />
(a) Chemicals<br />
This business area bundles <strong>Evonik</strong>’s global chemicals activities, which are now focused entirely on specialty<br />
chemicals, following extensive acquisitions and divestments in recent years.<br />
The portfolio now comprises products that <strong>Evonik</strong> supplies to customers in the agrochemicals, chemicals,<br />
plastics and paper industries for high-quality end-applications. The company also has extensive competencies<br />
in the design of inorganic particles and their surface properties, and integrated silicon complexes for the<br />
production of a unique range of chlorosilanes and organosilanes. The consumer goods industry uses customtailored<br />
substances and systems solutions from <strong>Evonik</strong> in products for personal care, hygiene and cleaning.<br />
<strong>Evonik</strong> produces essential amino acids for animal nutrition, active ingredients for the pharmaceuticals industry,<br />
and catalysts, which are required to meet high quality and registration standards. For this, it uses its longstanding<br />
experience of organic synthesis, catalysis and biotechnology. Functional polymers and high-quality<br />
monomers for the paints and coatings industry, adhesives and sealants are other key aspects of <strong>Evonik</strong>’s<br />
specialty chemicals business. The business area’s portfolio is rounded out by a broad spectrum of highperformance<br />
materials at the heart of which are methylmethacrylate chemistry, integrated production facilities<br />
for polyamide 12 and other specialized materials.<br />
Close collaboration with industrial customers—often through long-term development alliances—is another<br />
of <strong>Evonik</strong>’s strengths. Many of the chemical specialties developed, produced and commercialized by the<br />
Chemicals Business Area are tailored to customers’ individual needs through additional application technology<br />
services.<br />
Pronounced innovative capacity is a key success factor in the field of specialty chemicals. <strong>Evonik</strong> provides<br />
substantial funding for its efficient, market-oriented research and thus lastingly strengthens the development<br />
of new products, processes and applications.<br />
(b) Energy<br />
<strong>Evonik</strong>’s power and heat generation business and related services for power stations are grouped in the<br />
Energy Business Area. Its core competencies include planning, financing, building and operating highly<br />
efficient fossil-fueled power plants.<br />
As a grid-independent power generator, <strong>Evonik</strong> operates coal-fired power plants at eight locations in<br />
Germany, refinery power plants at two locations and a variety of facilities to generate energy from renewable<br />
resources. The business area’s international operations comprise coal-fired power stations in Colombia,<br />
Turkey and the Philippines. In each of these countries it works closely with local partners. Total installed<br />
power is around 9,400 Megawatts (MW) worldwide, including around 7,700 MW in Germany. The main<br />
agreements with key customers are based on long-term supply and offtake contracts.<br />
<strong>Annual</strong> <strong>Report</strong> <strong>2009</strong> <strong>Evonik</strong> <strong>Industries</strong>
Start Management report Consolidated financial statements Supplementary information<br />
Notes on the segment report<br />
<strong>Evonik</strong> is well-positioned in the high-growth future market for renewable energies and is one of the<br />
German market leaders in the generation of electricity and heat from mine gas, biomass and geothermal<br />
energy. Its globally aligned engineering services also deepen its country-specific insight into the energy<br />
market, enabling it to develop new business ideas for power plant projects.<br />
(c) Real Estate<br />
The Real Estate Business Area manages a portfolio of around 60,000 company-owned residential units<br />
concentrated in the federal state of North Rhine-Westphalia (NRW) in Germany. It also has a 50 percent<br />
stake in THS GmbH, Essen (Germany), which owns more than 70,000 residential units. These are also<br />
located predominantly in the federal state of NRW. <strong>Evonik</strong> is thus one of Germany’s leading privately<br />
owned residential real estate companies. Business focuses on letting homes to private households.<br />
In addition, active portfolio management involving the selective sale and purchase of residential units is<br />
used. The business model is rounded out by property development activities on company-owned land to<br />
upgrade the portfolio.<br />
The business area’s regional focus is the key to above-average market insight and brings advantages in<br />
the management of the housing stock.<br />
(d) Corporate, other operations, consolidation<br />
The Corporate Center, which supports the Executive Board of <strong>Evonik</strong> <strong>Industries</strong> <strong>AG</strong> in the management of<br />
the Group, the Shared Service Center, which provides services for the Group and a small amount of services<br />
for third parties, and operations that are not assigned to any of the reportable segments, are reflected here,<br />
together with intersegment consolidation effects.<br />
(9.2) <strong>Report</strong>ing based on regions<br />
The regional breakdown of the segments is based on geographical criteria, which are outlined in more detail<br />
in Note (9.3).<br />
(9.3) Notes to the segment data<br />
The segment data are derived from the consolidated data for the subsidiaries, and the consolidation effects<br />
that arise at Group level and are allocated to the segments. These relate primarily to goodwill, hidden reserves<br />
and charges and the resultant impact on earnings. The segment data are explained below.<br />
External sales reflect the segments’ sales with parties outside the Group. Sales generated between the<br />
reportable segments are internal sales.<br />
The following table shows a reconciliation from the sales of all reportable segments to Group sales.<br />
in € million <strong>2009</strong> 2008<br />
Total sales, reportable segments 13,061 15,739<br />
Total sales, other operations 510 723<br />
Consolidation −495 −589<br />
Total sales, corporate, other operations, consolidation 15 134<br />
Total sales, continuing operations 13,076 15,873<br />
<strong>Annual</strong> <strong>Report</strong> <strong>2009</strong> <strong>Evonik</strong> <strong>Industries</strong> 143
144<br />
The total sales reported for the other operations mainly relate to services provided by the Shared Service<br />
Center for the business units and the Corporate Center.<br />
External sales by region are divided by point of sale. They comprise:<br />
in € million <strong>2009</strong> 2008<br />
Germany 4,806 6,310<br />
USA 1,597 1,944<br />
China 609 578<br />
Turkey 508 657<br />
Netherlands 449 496<br />
France 434 537<br />
Switzerland 363 349<br />
Italy 326 405<br />
Other countries 3,984 4,597<br />
External sales, continuing operations 13,076 15,873<br />
As internal management parameters for the operating business, the Executive Board of <strong>Evonik</strong> <strong>Industries</strong> <strong>AG</strong><br />
uses a variety of earnings indicators, which are reported on a segment basis. These are EBITDA (before<br />
non-operating result), EBIT (before non-operating result) and operating income.<br />
Operating income is defined as earnings before interest and income taxes and is the earnings parameter<br />
that corresponds to the recognition and valuation principles used to prepare the consolidated financial statements,<br />
without adjustment for non-operating items.<br />
The non-operating result reflects business transactions that are defined for purposes of internal management<br />
as occurring once or rarely and are significant for an assessment of the company’s earnings position.<br />
EBIT (before non-operating result) comprises earnings before interest, taxes and the non-operating result<br />
(subsequently referred to as EBIT).<br />
EBITDA (before non-operating result) is the main parameter that can be influenced by the segment<br />
management (subsequently referred to as EBITDA). To calculate EBITDA, EBIT is adjusted for depreciation<br />
and amortization, impairment losses and reversals of impairment losses, which are not included in the nonoperating<br />
result. The EBITDA margin is the ratio of EBITDA to external sales.<br />
Depreciation and amortization relate to the depletion in the value of intangible assets, property, plant<br />
and equipment and investment property over their estimated useful life.<br />
The result from investments recognized at equity corresponds to the result for these investments as<br />
reported in the income statement; see Note (6.5).<br />
<strong>Annual</strong> <strong>Report</strong> <strong>2009</strong> <strong>Evonik</strong> <strong>Industries</strong>
Start Management report Consolidated financial statements Supplementary information<br />
Notes on the segment report<br />
The following table shows the relationship between the internal management parameters EBITDA and<br />
EBIT and the external earnings parameters operating income and income before income taxes from the<br />
continuing operations:<br />
in € million <strong>2009</strong> 2008<br />
EBITDA (before non-operating result) 2,025 2,165<br />
Depreciation, amortization, impairment losses/reversal of impairment losses −921 −1,148<br />
Impairment losses/reversal of impairment losses (non-operating result) 90 281<br />
EBIT (before non-operating result) 1,194 1,298<br />
Non-operating result −299 −406<br />
Operating income 895 892<br />
Net interest expense −483 −530<br />
Income before income taxes, continuing operations 412 362<br />
In fiscal <strong>2009</strong> the non-operating loss amounted to €299 million, compared with a non-operating loss of<br />
€406 million in 2008. In <strong>2009</strong>, non-operating income came to €35 million (2008: €138 million) and nonoperating<br />
expenses were €334 million (2008: €544 million).<br />
In <strong>2009</strong>, the income principally resulted from reversals of provisions. The main expenses related to the<br />
On Track efficiency enhancement program, impairment losses on assets, the divestment of the NCN chemicals<br />
activities, a one-off payment to the German pension insurance association (Pensions-Sicherungs-Verein a.G.,<br />
Cologne) and restructuring. This item also includes the corresponding reversals of provisions where applicable.<br />
The reconciliation from the operating income of all reportable segments to income before income taxes<br />
from the continuing operations is as follows:<br />
in € million <strong>2009</strong> 2008<br />
Operating income, reportable segments 1,141 1,215<br />
Operating income, other operations −21 −2<br />
Corporate Center and corporate activities −220 −308<br />
Consolidation −5 −13<br />
Operating income, corporate, other operations, consolidation −246 −323<br />
Operating income, Group, continuing operations 895 892<br />
Net interest expense −483 −530<br />
Income before income taxes, continuing operations 412 362<br />
Capital employed is calculated by determining the total of intangible assets, property, plant and equipment,<br />
investment property, investments, inventories, trade accounts receivable, financial assets required for operations,<br />
certain amounts relating to assets held for sale and other non-interest-bearing current assets. The<br />
sum of interest-free provisions, trade accounts payable, other interest-free liabilities and deferred tax liabilities<br />
is then deducted.<br />
<strong>Annual</strong> <strong>Report</strong> <strong>2009</strong> <strong>Evonik</strong> <strong>Industries</strong> 145
146<br />
Capital employed comprises the assets required by the reportable segments for operational purposes. The<br />
table shows a reconciliation to the capital employed of the continuing operations:<br />
in € million Dec. 31, <strong>2009</strong> Dec. 31, 2008<br />
Capital employed, reportable segments 13,772 14,656<br />
Capital employed, other operations −60 −94<br />
Corporate, consolidation −31 86<br />
Capital employed, corporate, other operations, consolidation −91 −8<br />
Capital employed, continuing operations 13,681 14,648<br />
Another major internal management parameter used by the Group is the return on capital employed (ROCE).<br />
ROCE is calculated from the ratio of EBIT to capital employed. To smooth the closing date effect, the calculation<br />
uses average capital employed.<br />
Investments recognized at equity correspond to their carrying amounts as reflected in the balance sheet,<br />
see Note (7.4).<br />
Capital expenditures comprise additions to intangible assets (excluding goodwill from capital consolidation),<br />
property, plant and equipment and investment property. Additions resulting from changes in the scope<br />
of consolidation are not taken into account. Capital expenditures by region are based on the location of the<br />
subsidiaries.<br />
Additions to investments recognized at equity, other investments, non-current loans and non-current<br />
securities and security-type claims made in the reporting period are recognized as financial investments.<br />
The acquisition of subsidiaries is shown as an addition to financial investments in the year of acquisiton<br />
(including goodwill from capital consolidation). Financial investments by region are based on the location<br />
of the subsidiaries.<br />
Other material income and expense items that do not impact cash flows mainly comprise impairment<br />
losses, reversals of impairment losses, additions to and reversals of provisions and the reversal of deferred<br />
income and expenses.<br />
The headcount is taken on the reporting date. It shows the number of employees. Part-time employees<br />
are included as absolute figures. The headcount by region is based on the location of the subsidiaries.<br />
Goodwill and other intangible assets, property, plant and equipment and investment property are segmented<br />
by the location of the subsidiaries. Together, these assets comprise the non-current assets in accordance<br />
with IFRS 8 Operating Segments (c.f. IFRS 8.33 b). The following table provides a breakdown of the<br />
Group’s non-current assets by country:<br />
in € million Dec. 31, <strong>2009</strong> Dec. 31, 2008<br />
Germany 8,146 8,139<br />
USA 761 835<br />
Belgium 535 542<br />
China 514 524<br />
Other countries 1,259 1,244<br />
Non-current assets 11,215 11,284<br />
<strong>Annual</strong> <strong>Report</strong> <strong>2009</strong> <strong>Evonik</strong> <strong>Industries</strong>
Start Management report Consolidated financial statements Supplementary information<br />
(10) Other disclosures<br />
Other disclosures<br />
(10.1) Earnings per share<br />
Basic earnings per share as shown in the income statement are calculated by dividing net income by the<br />
weighted average number of shares issued. Net income comprises the total earnings for the year less noncontrolling<br />
interests, including the earnings of discontinued operations. Earnings per share could be diluted<br />
by “potential” ordinary shares.<br />
Number of shares <strong>2009</strong> 2008<br />
Weighted average number of shares issued (basic) 466,000,000 466,000,000<br />
Dilution by potential shares – –<br />
Weighted average number of shares issued (diluted) 466,000,000 466,000,000<br />
in € million <strong>2009</strong> 2008<br />
Income after taxes, continuing operations 318 234<br />
Income after taxes, discontinued operations −6 117<br />
less income after taxes attributable to non-controlling interests −72 −70<br />
Income after taxes attributable to shareholders<br />
of <strong>Evonik</strong> <strong>Industries</strong> <strong>AG</strong> (net income) 240 281<br />
Earnings per share (basic and diluted) in €<br />
from continuing operations +0.68 +0.50<br />
from discontinued operations −0.01 +0.25<br />
less non-controlling interests −0.15 −0.15<br />
Earnings per share (basic and diluted) in €<br />
attributable to shareholders of <strong>Evonik</strong> <strong>Industries</strong> <strong>AG</strong> +0.52 +0.60<br />
(10.2) Performance-related remuneration<br />
<strong>Evonik</strong>’s remuneration system comprises a basic salary, short-term incentives and long-term components,<br />
the Long-Term Incentive Plan for executives of the <strong>Evonik</strong> Group (<strong>Evonik</strong> LTI Plan) and a Long-Term Incentive<br />
Plan for executives of the former <strong>Evonik</strong> Degussa Group (<strong>Evonik</strong> Degussa LTI Plan). The value of these<br />
LTI Plans is not linked to the development of shares in the company. Instead it is calculated on the basis of<br />
defined business indicators. Both LTI Plans are long-term compensation plans and are accounted for in accordance<br />
with IAS 19 Employee Benefits.<br />
(a) <strong>Evonik</strong> LTI Plan<br />
<strong>Evonik</strong> <strong>Industries</strong> <strong>AG</strong> granted the <strong>Evonik</strong> LTI Plan to executives nominated by the Executive Board for the<br />
first time in 2008 and again in <strong>2009</strong>. This LTI Plan comprises a three-year performance period, starting on<br />
May 1 on the year on which it is granted. The intrinsic value of the plan depends on how the fictitious equity<br />
value of <strong>Evonik</strong> derived from EBITDA develops over the performance period.<br />
<strong>Annual</strong> <strong>Report</strong> <strong>2009</strong> <strong>Evonik</strong> <strong>Industries</strong> 147
148<br />
The reference base for calculating the increase in value is the fictitious equity value as of December 31 of<br />
the year prior to its granting. The actual increase compared with this reference base will be compared with<br />
the mid-term plan approved by the Supervisory Board of <strong>Evonik</strong> <strong>Industries</strong> <strong>AG</strong> in the year in which the plan<br />
is granted. Assuming that the fictitious equity value after three years is above the reference value set in the<br />
mid-term planning, a cash payment is made under the LTI Plan. The level of this payment is based on an<br />
individual target and the relationship between the actual and planned target attainment. As of the reporting<br />
date a provision of €1 million (2008: €2 million) had been established for the <strong>Evonik</strong> LTI Plans 2008 and <strong>2009</strong>.<br />
(b) <strong>Evonik</strong> Degussa LTI Plan<br />
Under the <strong>Evonik</strong> Degussa LTI Plan, performance options were granted to the members of the Board of<br />
Management of <strong>Evonik</strong> Degussa GmbH (for 2003 through 2005) and around 190 executives at the former<br />
<strong>Evonik</strong> Degussa Group (for 2003 through 2006). The indicators for this LTI Plan were the ROCE and EBITDA<br />
of <strong>Evonik</strong> Degussa.<br />
The table shows the number of performance options allocated under the <strong>Evonik</strong> Degussa LTI Plans<br />
between 2003 and 2006:<br />
LTI Plan 2006 2005 2004 2003<br />
As of January 1, <strong>2009</strong> 105,657 783,251 724,467 0<br />
Granted − − − −<br />
Exercised −842 − − −<br />
Lapsed −3,668 −62,700 −724,467 −<br />
As of December 31, <strong>2009</strong> 101,147 720,551 0 0<br />
A five-year period was defined as the term of each tranche of the LTI Plan from 2003 through 2006. This<br />
five-year period is divided into an initial lock-up period of two years, during which the performance options<br />
may not be exercised, followed by a three-year exercise period with four exercise windows. The 2003 and<br />
2004 LTI Plans have now expired.<br />
Exercise of the performance options is contingent upon achievement of a specific ROCE target for <strong>Evonik</strong><br />
Degussa. If ROCE exceeds this hurdle, the number of options that can be exercised rises in line with ROCE.<br />
The formula used to calculate this is based on the weighted average cost of capital (WACC) of <strong>Evonik</strong> Degussa<br />
and was defined separately for each tranche of the LTI Plan.<br />
EBITDA is used to calculate the value of the options eligible for exercise. The performance options only<br />
have an intrinsic value if the increase in EBITDA at <strong>Evonik</strong> Degussa is at least in line with the average EBITDA<br />
performance of the defined peer group companies. If EBITDA exceeds this level, the value of the options<br />
rises in line with the amount by which <strong>Evonik</strong> Degussa outperforms the peer group.<br />
Provisions for the LTI Plan totaled €15 million on the reporting date (2008: €18 million). Since the exercise<br />
conditions for the 2004 and 2005 tranches of the LTI Plan were not met, no payments were made in<br />
<strong>2009</strong>. The 2006 tranche of the LTI Plan can only result in marginal exercise as extensive exercise of rights<br />
by eligible participants was recorded in 2008. Accordingly, the provisions for amounts above this level were<br />
reversed. In 2008 the exercise of rights relating to the tranches for 2003 and 2006 resulted in a total payment<br />
of €26 million.<br />
<strong>Annual</strong> <strong>Report</strong> <strong>2009</strong> <strong>Evonik</strong> <strong>Industries</strong>
Start Management report Consolidated financial statements Supplementary information<br />
(10.3) Additional information on financial instruments<br />
Other disclosures<br />
Net result<br />
The income and expenses, gains and losses from financial instruments reflected in the income statement<br />
are reported as the net result for each of the valuation categories defined in IAS 39 Financial Instruments:<br />
Recognition and Measurement.<br />
<strong>2009</strong><br />
At fair value through<br />
profit or loss<br />
in € million Trading Designation<br />
Availablefor-sale<br />
Loans and<br />
receivables<br />
Liabilities at<br />
fair value<br />
Liabilities at<br />
amort. cost<br />
Proceeds from disposals −1 − − 1 −2 − −<br />
Income from the measurement<br />
of derivatives 33 359 − − − −326 −<br />
Impairment losses/reversals<br />
of impairment losses −4 − − −1 −3 − −<br />
Net interest expense −167 1 − 0 8 − −176<br />
Income from other<br />
investments 15 − − 15 − − −<br />
2008<br />
−124 360 0 15 3 −326 −176<br />
At fair value through<br />
profit or loss<br />
in € million Trading Designation<br />
Availablefor-sale<br />
Loans and<br />
receivables<br />
Liabilities at<br />
fair value<br />
Liabilities at<br />
amort. cost<br />
Proceeds from disposals −34 − −35 2 −1 − −<br />
Income from the measurement<br />
of derivatives −229 340 − − − −569 −<br />
Impairment losses/reversals<br />
of impairment losses −22 − − −4 −18 − −<br />
Net interest expense −206 0 − 1 18 0 −225<br />
Income from other<br />
investments 16 − − 16 − − −<br />
−475 340 −35 15 −1 −569 −225<br />
Income from the measurement of derivatives does not include income from derivative financial instruments<br />
that qualify for hedge accounting.<br />
<strong>Annual</strong> <strong>Report</strong> <strong>2009</strong> <strong>Evonik</strong> <strong>Industries</strong> 149
150<br />
Interest income of €9 million (2008: €19 million) relates to financial instruments not allocated to the category<br />
at fair value through profit or loss, while interest expense, including interest expense for finance leases, was<br />
€187 million (2008: €236 million). Further, net interest expense does not include any interest income on the<br />
impaired portion of financial assets or trade accounts receivable.<br />
Classification<br />
At <strong>Evonik</strong>, the classification of financial instruments that fall within the scope of IFRS 7 Financial Instruments:<br />
Disclosures is based on the presentation on the balance sheet. The following table comprises a reconciliation<br />
of the carrying amounts of these balance sheet items to the valuation categories defined in IAS 39<br />
Financial Instruments: Recognition and Measurement and shows their fair values:<br />
<strong>Annual</strong> <strong>Report</strong> <strong>2009</strong> <strong>Evonik</strong> <strong>Industries</strong><br />
At fair value through<br />
profit or loss<br />
in € million Trading Designation<br />
Availablefor-sale<br />
Loans and<br />
receivables<br />
Not allocated<br />
to any<br />
category Dec. 31, <strong>2009</strong><br />
Financial assets 52 0 183 106 1,099 1,440<br />
Carrying<br />
amounts Fair value<br />
Other investments − – 117 − − 117 117<br />
Loans − – − 97 − 97 97<br />
Securities and similar<br />
claims − – 66 − − 66 66<br />
Receivables from finance<br />
leases − – − − 1,004 1,004 1,599<br />
Receivables from<br />
derivatives 52 – − − 76 128 128<br />
Other financial assets − – − 9 19 28 28<br />
Trade accounts receivable − – − 2,148 − 2,148 2,148<br />
Cash and cash equivalents − – − 885 − 885 885<br />
in € million<br />
52 0 183 3,139 1,099 4,473<br />
Liabilities at<br />
fair value<br />
Liabilities at<br />
amort. cost<br />
Not allocated<br />
to any<br />
category Dec. 31, <strong>2009</strong><br />
Financial liabilities 30 4,248 217 4,495<br />
Carrying<br />
amounts Fair value<br />
Bonds − 2,040 − 2,040 2,097<br />
Liabilities to banks − 2,047 − 2,047 2,199<br />
Loans from non-banks − 71 − 71 73<br />
Liabilities from finance leases − − 114 114 148<br />
Liabilities from derivatives 30 − 72 102 102<br />
Other financial liabilities − 90 31 121 121<br />
Trade accounts payable − 1,365 − 1,365 1,365<br />
30 5,613 217 5,860
Start Management report Consolidated financial statements Supplementary information<br />
At fair value through<br />
profit or loss<br />
in € million Trading Designation<br />
Other disclosures<br />
Availablefor-sale<br />
Loans and<br />
receivables<br />
Not allocated<br />
to any<br />
category Dec. 31, 2008<br />
Financial assets 73 0 157 182 1,303 1,715<br />
Carrying<br />
amounts Fair value<br />
Other investments – – 112 − − 112 112<br />
Loans – – – 165 − 165 164<br />
Securities and similar<br />
claims – – 45 − − 45 45<br />
Receivables from<br />
finance leases – – – − 1,117 1,117 1,271<br />
Receivables from<br />
derivatives 73 – – − 145 218 218<br />
Other financial assets – – – 17 41 58 58<br />
Trade accounts receivable – – – 2,572 − 2,572 2,572<br />
Cash and cash equivalents – – – 536 − 536 536<br />
in € million<br />
73 0 157 3,290 1,303 4,823<br />
Liabilities<br />
at fair value<br />
Liabilities at<br />
amort.cost<br />
Not allocated<br />
to any<br />
category Dec. 31, 2008<br />
Financial liabilities 102 4,177 1,123 5,402<br />
Carrying<br />
amounts Fair value<br />
Bonds – 516 774 1,290 1,260<br />
Liabilities to banks – 3,477 − 3,477 3,577<br />
Loans from non-banks – 51 − 51 52<br />
Liabilities from finance leases – − 132 132 133<br />
Liabilities from derivatives 102 − 170 272 272<br />
Other financial liabilities – 133 47 180 180<br />
Trade accounts payable – 1,463 − 1,463 1,463<br />
102 5,640 1,123 6,865<br />
Some of the derivative financial instruments, parts of the bond issued by <strong>Evonik</strong> Degussa GmbH and some<br />
of the other financial assets and liabilities included in hedge accounting are not allocated to any of the categories<br />
defined in IAS 39 Financial Instruments: Recognition and Measurement.<br />
Non-current receivables are valued using a variety of parameters. Impairment losses are recognized for<br />
any expected defaults on receivables. Accordingly, the net carrying amount of these receivables basically<br />
corresponds to their fair value. The assumption used to calculate the fair value of loans, receivables from<br />
finance leases, liabilities to banks, loans from non-banks and liabilities from finance leases is a risk-free<br />
interest rate. The fair value of the bond is its stock market price on the reporting date. In all other cases the<br />
fair value of the financial instruments recognized on the balance sheet is their carrying amount on the<br />
reporting date.<br />
<strong>Annual</strong> <strong>Report</strong> <strong>2009</strong> <strong>Evonik</strong> <strong>Industries</strong> 151
152<br />
Fair value hierarchy<br />
Fair value measurement of financial instruments is based on a three-level hierarchy, see Note (3.7) “Financial<br />
instruments”. The table shows the allocation of financial instruments measured at fair value to the three<br />
levels of the fair value hierarchy:<br />
in € million<br />
<strong>Annual</strong> <strong>Report</strong> <strong>2009</strong> <strong>Evonik</strong> <strong>Industries</strong><br />
Dec. 31, <strong>2009</strong><br />
Fair value Level 11) Level 22) Level 33)<br />
Financial assets 194 66 128 0<br />
Securities and similar claims 66 66 0 −<br />
Receivables from derivatives 128 − 128 −<br />
Financial liabilities 102 0 102 0<br />
Liabilities from derivatives 102 − 102 −<br />
1) Quoted price on an active market.<br />
2) Quoted price on an active market for similar financial instruments or a valuation method based on observable market data.<br />
3) Valuation method not based on observable market data.<br />
Notional value of derivatives<br />
The notional value of currency derivatives is the hedged foreign exchange amount converted into euros. The<br />
notional value of interest derivatives is the sum of the hedged items during their term to maturity while the<br />
notional value of commodity derivatives is the hedged procurement cost translated into euros. The notional<br />
value of embedded derivatives corresponds to one of the above definitions of notional value, depending on<br />
the type of derivative.<br />
Notional value of derivative financial instruments:<br />
in € million Total<br />
Dec. 31, <strong>2009</strong> Dec. 31, 2008<br />
thereof<br />
with a term<br />
to maturity<br />
of up to<br />
1 year<br />
thereof<br />
with a term<br />
to maturity<br />
of more<br />
than 1 year Total<br />
thereof<br />
with a term<br />
to maturity<br />
of up to<br />
1 year<br />
thereof<br />
with a term<br />
to maturity<br />
of more<br />
than 1 year<br />
Currency derivatives 3,931 3,746 185 3,773 3,517 256<br />
Interest derivatives 989 0 989 1,171 36 1,135<br />
Commodity derivatives 522 299 223 492 310 182<br />
Other derivatives − − − 13 13 0<br />
5,442 4,045 1,397 5,449 3,876 1,573<br />
Where the criteria for hedge accounting are fulfilled, currency, interest and commodity derivatives are<br />
accounted for as fair value hedges, cash flow hedges or hedges of a net investment.
Start Management report Consolidated financial statements Supplementary information<br />
Other disclosures<br />
Hedge accounting<br />
The following major hedging transactions qualified for hedge accounting in fiscal <strong>2009</strong>:<br />
(a) Fair value hedges<br />
Until August <strong>2009</strong>, the €1,250 million bond issued by <strong>Evonik</strong> Degussa GmbH in November 2003 was hedged<br />
by receiver swaps with a notional value of €750 million and an expiration date of 2013. The fair value of these<br />
interest rate hedges when they were closed out was €54 million (December 31, 2008: €40 million). A<br />
regression analysis was used to provide evidence of the effectiveness of the hedges for the last time as of<br />
the date on which they were closed out. In the period January to August <strong>2009</strong>, income of €14 million (fullyear<br />
2008: €44 million) relating to the fair value measurement of these derivatives and expenses of €14 million<br />
(full-year 2008: €47 million) from the fair value measurement of the bond were included in net interest<br />
expense. When the hedge was closed out, the accumulated income from the effective portion of the fair<br />
value hedge of the bond amounted to €60 million. This will be released to net interest expense over the<br />
remaining maturity of the bond using the effective interest method. €5 million of this amount was released<br />
in <strong>2009</strong>.<br />
The Energy Business Area has long-term master agreements on the purchase and sale of imported coal,<br />
including ocean freight. Both fixed and indexed rates have been agreed for such contracts. The price risk<br />
relating to pending transactions where purchase and sale are not synchronized is hedged through to 2011<br />
using coal and freight swaps designated as fair value hedges. The fair value of these hedges was €9 million<br />
on the reporting date (2008: €5 million). A regression analysis is carried out quarterly to provide evidence<br />
of their prospective effectiveness. Their retrospective effectiveness is measured by the cumulative dollar<br />
offset method. The fair value measurement of derivatives resulted in income of €17 million in <strong>2009</strong> (2008:<br />
€40 million) and expenses of €22 million (2008: €45 million), while the fair value measurement of the<br />
pending hedged transactions resulted in expenses of €22 million (2008: €48 million) and income of<br />
€17 million (2008: 41 million). These amounts were recognized in other operating income and expenses.<br />
(b) Cash flow hedges<br />
The Energy Business Area has hedged interest payments relating to the financing of power plant projects<br />
up to 2026 with interest rate swaps and interest rate caps. In addition, commodity swaps were used to hedge<br />
coal and freight price risks relating to the planned supply to company-owned power stations and forward<br />
exchange contracts to hedge currency risks relating to the planned procurement of raw materials. These<br />
derivatives mature in the period up to 2011. The following fair values were recognized for these derivatives:<br />
designated interest rate derivatives minus €33 million (2008: minus €48 million), currency derivatives €4 million<br />
(2008: €8 million) and commodity derivatives minus €5 million (2008: minus €16 million).<br />
In the Chemicals Business Area, forward exchange contracts are used to hedge forecast sales as of the<br />
balance sheet date amounting to around €526 million (2008: €615 million) up to 2010 against exchange rate<br />
movements. The fair value of hedging instruments included in hedge accounting was €3 million (2008: €19<br />
million). In addition, commodity swaps with a fair value of €3 million (2008: minus €56 million) were used<br />
to hedge forecast purchases of raw materials against price fluctuations up to 2011.<br />
Evidence of the effectiveness of hedging relations is provided using the dollar offset method, critical<br />
term match, the hypothetical derivatives method, regression analysis and sensitivity analyses. In <strong>2009</strong>, the<br />
calculation for interest hedges where interest options are used as the hedging instrument was transitioned<br />
to the intrinsic value method. Similarly, as from <strong>2009</strong>, only the spot components of forward exchange<br />
contracts used to hedge currency risks relating to transactions that are highly probable are designated as<br />
hedges. As in 2008, only a negligible amount was recognized in income as the ineffective portion of the<br />
valuation of cash flow hedges.<br />
<strong>Annual</strong> <strong>Report</strong> <strong>2009</strong> <strong>Evonik</strong> <strong>Industries</strong> 153
154<br />
(c) Hedge of a net investment<br />
The Energy Business Area uses currency derivatives to hedge the proportionate equity allocated to foreign<br />
power plant projects against exchange rate risks. The fair value of these hedges was €22 million (2008:<br />
€31 million). €4 million was derecognized from unrealized gains/losses on hedges in accumulated other<br />
comprehensive income in 2008 and charged to income as the result of capital reductions or the divestment<br />
of shares.<br />
Financial risk management<br />
As an international company, <strong>Evonik</strong> is exposed to financial risks in the normal course of business. A major<br />
objective of corporate policy is to minimize the impact of market, liquidity and default risks both on the<br />
value of the company and on profitability in order to check adverse fluctuations in cash flows and earnings<br />
without forgoing the opportunity to benefit from positive market trends. For this purpose a systematic<br />
financial and risk management system has been established. Interest rate and exchange rate risks are managed<br />
centrally at <strong>Evonik</strong>. Commodity risks are identified by the business units and hedged with the aid of futures<br />
in compliance with corporate guidelines.<br />
Financial derivatives are used to reduce financial risks. They are entered into exclusively in connection<br />
with the corresponding underlying transaction (hedged item) relating to normal operating business, which<br />
provides a risk profile directly opposite to that of the hedge. The instruments used to manage exchange rate<br />
and interest rate risks are customary products found on the market such as forward exchange contracts and<br />
currency options, interest rate and currency swaps and interest rate caps. Commodity risks relating to coal,<br />
gas, electricity and oil are hedged through futures contracts. The procurement of emissions allowances to<br />
meet obligations pursuant to Section 6 of the German Emissions Trading Act (TEHG) is optimized through<br />
the use of EUA-CER swaps, EUA or CER futures and securities lending transactions.<br />
(a) Market risk<br />
Market risk can basically be subdivided into exchange rate, interest rate and commodity risks.<br />
Exchange rate risks relate to both the sourcing of raw materials and the sale of end-products in currencies<br />
other than the functional currency of the company concerned. The aim of currency management is to protect<br />
the company’s operating business from fluctuations in earnings and cash flows resulting from changes in<br />
exchange rates. Account is taken of the opposite effects arising from procurement and sales activities. The<br />
remaining currency risks to the Group chiefly relate to changes in the exchange rate of the euro versus the<br />
US dollar (USD).<br />
The aim of interest rate management is to protect net income from the negative effects of fluctuations<br />
in market interest rates. Interest rate risk is managed through primary and derivative financial instruments,<br />
especially interest rate swaps and interest rate caps. The aim is to achieve an appropriate ratio of fixed rates<br />
(with interest rates fixed for more than one year) and variable rates (terms of less than one year), taking<br />
costs and risks into account. The receiver swaps with a notional value of €750 million held to hedge the<br />
€1,250 million bond issued by <strong>Evonik</strong> Degussa GmbH in November 2003 were closed out in August <strong>2009</strong>.<br />
As of December 31, <strong>2009</strong> around 98 percent (2008: around 50 percent) of net financing liabilities were<br />
hedged by primary and derivative fixed-interest contracts.<br />
Several scenario analyses were carried out to measure exchange rate and interest rate risk as of December<br />
31, <strong>2009</strong>.<br />
A change of 5 percent and 10 percent in the exchange rates of the USD, which is the most important currency<br />
for <strong>Evonik</strong>, was modeled, together with the standard deviation for each of these changes to simulate<br />
the possible loss of value of primary and derivative financial instruments.<br />
<strong>Annual</strong> <strong>Report</strong> <strong>2009</strong> <strong>Evonik</strong> <strong>Industries</strong>
Start Management report Consolidated financial statements Supplementary information<br />
The scenarios are shown in the table:<br />
in € million<br />
Other disclosures<br />
Dec. 31, <strong>2009</strong> Dec. 31, 2008<br />
Impact on<br />
income<br />
Impact on<br />
equity<br />
Impact on<br />
income<br />
Impact on<br />
equity<br />
+5% −28 −25 −42 −24<br />
−5% 28 25 42 24<br />
+10% −56 −50 −83 −49<br />
−10% 56 50 83 49<br />
+ standard deviation −5 −5 −8 −5<br />
− standard deviation 5 5 8 5<br />
Several scenarios were also simulated for interest rates. These analyzed shifts of 50, 100 and 150 basis points<br />
in interest rates or the interest rate curve. The changes modeled relate to the interest rate curves for all foreign<br />
currencies and for the euro to simulate the possible loss of value of primary and derivative financial<br />
instruments. The scenarios are shown in the table:<br />
in € million<br />
Dec. 31, <strong>2009</strong> Dec. 31, 2008<br />
Impact on<br />
income<br />
Impact on<br />
equity<br />
Impact on<br />
income<br />
Impact on<br />
equity<br />
+50 basis points 1 20 −24 22<br />
−50 basis points −1 −21 25 −23<br />
+100 basis points 1 39 −48 43<br />
−100 basis points 0 −44 51 −48<br />
+150 basis points 2 57 −71 62<br />
−150 basis points 0 −68 78 −75<br />
Commodity risks result from changes in the market prices for the purchase and sale of raw materials and the<br />
sale of electricity. Raw materials are purchased principally to meet in-house requirements, but steam coal is<br />
also purchased for resale to third parties via the market. Commodity management is the responsibility of the<br />
business units. They identify procurement risks and take effective measures to minimize them. For example,<br />
price escalation clauses and swaps are used to reduce price volatility. Other factors of importance for <strong>Evonik</strong>’s<br />
risk position are the availability and price of raw materials, starting products and intermediates. In particular,<br />
raw material prices of significance to the <strong>Evonik</strong> Group are dependent on exchange rates and the price of<br />
crude oil. Pricing and procurement risks are reduced through worldwide procurement and optimized processes<br />
to ensure immediate sourcing of additional raw material requirements. Similarly, use of alternative<br />
raw materials is examined for various production processes and <strong>Evonik</strong> is working on the development of<br />
alternative production technologies.<br />
Financial derivatives were used to hedge procurement price risks. If the price of crude oil or natural gas<br />
had altered by 10 percent on the reporting date, the equity impact of the fluctuation in the value of these<br />
derivatives would have been €7 million (2008: €8 million). If the price of imported coal or freight rates had<br />
been altered by 10 percent, the equity impact of the corresponding derivatives would have been €4 million<br />
(2008: €4 million). The sensitivity analysis for these raw materials and for emissions allowances shows a<br />
negligible impact on earnings in <strong>2009</strong> and 2008.<br />
<strong>Annual</strong> <strong>Report</strong> <strong>2009</strong> <strong>Evonik</strong> <strong>Industries</strong> 155
156<br />
(b) Liquidity risk<br />
Liquidity risk is managed through business planning to ensure that the funds required to finance the current<br />
operating business and current and future investments in all Group companies are available at the right time<br />
and in the right currency at optimum cost. Liquidity requirements for business operations, investments and<br />
other financial activities are derived from a financing status and liquidity planning, which form part of liquidity<br />
risk management. Liquidity is pooled in a central cash management pool where this makes economic sense<br />
and is legally permissible. Central liquidity risk management facilitates low-cost borrowing and advantageous<br />
offsetting of financial requirements. To secure its liquidity, <strong>Evonik</strong> has a €2,250 million syndicated credit<br />
facility agreed in 2006 which runs until 2011. None of this was in use on the reporting date (2008: €800<br />
million was in use at year end). There are also agreed bilateral credit facilities amounting to €224 million<br />
(2008: €180 million) to cover short-term funding requirements, and more than €365 million (2008: €450<br />
million) for letters of credit. Drawings at year end <strong>2009</strong> were €67 million and €265 million respectively<br />
(2008: €5 million and €268 million).<br />
The table shows the remaining maturity of the primary financial instruments based on the agreed dates<br />
for payment of the sum of interest and installment payments.<br />
<strong>Annual</strong> <strong>Report</strong> <strong>2009</strong> <strong>Evonik</strong> <strong>Industries</strong><br />
Total Up to 1 year<br />
More than 1 and<br />
up to 3 years<br />
More than 3 and<br />
up to 5 years More than 5 years<br />
in € million <strong>2009</strong> 2008 <strong>2009</strong> 2008 <strong>2009</strong> 2008 <strong>2009</strong> 2008 <strong>2009</strong> 2008<br />
Financial liabilities<br />
as of December 31 5,784 6,476 576 1,463 757 1,442 2,811 1,791 1,640 1,780<br />
Bonds 2,519 1,570 117 64 233 128 2,169 1,378 − −<br />
Liabilities to banks 2,901 4,465 334 1,243 461 1,189 584 362 1,522 1,671<br />
Loans from non-banks 74 70 5 14 15 11 16 3 38 42<br />
Liabilities from finance<br />
leases 167 191 30 32 44 69 34 48 59 42<br />
Other financial liabilities 123 180 90 110 4 45 8 0 21 25<br />
Trade accounts payable<br />
as of December 31 1,365 1,463 1,365 1,463 − − − − − −
Start Management report Consolidated financial statements Supplementary information<br />
Other disclosures<br />
The breakdown of the sum of interest and installment payments by maturity in the following table relates to<br />
derivative financial instruments with positive and negative fair values. The table shows the net value of cash<br />
inflows and outflows. Since netting was not agreed for currency derivatives, they are presented as gross<br />
amounts:<br />
Total Up to 1 year<br />
More than 1 and<br />
up to 3 years<br />
More than 3 and<br />
up to 5 years More than 5 years<br />
in € million <strong>2009</strong> 2008 <strong>2009</strong> 2008 <strong>2009</strong> 2008 <strong>2009</strong> 2008 <strong>2009</strong> 2008<br />
Receivables from<br />
derivatives as of Dec. 31 191 148 174 96 17 39 0 13 0 0<br />
Currency derivatives 139 92 127 87 12 5 − − − −<br />
Cash inflows 2,426 1,789 2,349 1,672 74 114 3 3 − −<br />
Cash outflows −2,287 −1,697 −2,222 −1,585 −62 −109 −3 −3 − −<br />
Interest derivatives 0 45 − 9 − 23 − 13 − −<br />
Commodity derivatives 52 11 47 − 5 11 − 0 − −<br />
Liabilities from<br />
derivatives as of Dec. 31 −154 −241 −111 −200 −49 −42 −6 −1 12 2<br />
Currency derivatives −76 −138 −70 −118 −6 −20 − − − −<br />
Cash inflows 1,495 1,836 1,388 1,748 104 88 3 − − −<br />
Cash outflows −1,571 −1,974 −1,458 −1,866 −110 −108 −3 − − −<br />
Interest derivatives −33 −23 −21 −6 −18 −18 −6 −1 12 2<br />
Commodity derivatives −45 −80 −20 −76 −25 −4 − − − −<br />
(c) Risk of default<br />
Credit risk management divides default risk into three categories, which are analyzed separately on the<br />
basis of their specific features. The three categories are debtor and creditor risk, country risk and the risk of<br />
default by financial counterparties.<br />
The debtor and creditor default risks are analyzed and monitored continuously with the aid of an internal<br />
limit system. Political risk (country risk) is also taken into account for export orders so that the overall risk<br />
assessment takes account of both political and economic risk factors. On the basis of the analysis, a maximum<br />
risk exposure limit is set for the contracting party. The credit standing of contracting parties is updated constantly<br />
via ratings or scoring processes.<br />
In addition, a specific limit is set for financial counterparties for each type of risk (money market, capital<br />
market and derivatives). Maximum limits for each contracting party are set on the basis of the creditworthiness<br />
analyses. These are normally based on the ratings issued by international rating agencies and our own<br />
internal analysis of credit standing. In the case of banks, the level of deposits covered by the deposit insurance<br />
system and liable capital are also taken into account.<br />
Credit management also covers derivative financial instruments, where the risk of default is equivalent<br />
to the positive fair value. This risk is minimized by setting high standards for the creditworthiness of counterparties.<br />
Only common instruments found on the market with sufficient liquidity are used. Consequently,<br />
no material risk of default is expected in this field. As for primary financial instruments, there is also a default<br />
risk amounting to the positive fair value. This can be minimized by regular creditworthiness reviews. We do<br />
not anticipate any material risk of default here either.<br />
Owing to the diversity of business and large number of customers, there are no significant cluster risks.<br />
<strong>Annual</strong> <strong>Report</strong> <strong>2009</strong> <strong>Evonik</strong> <strong>Industries</strong> 157
158<br />
(10.4) Related parties<br />
In addition to the subsidiaries included in the consolidated financial statements, the Group maintains relationships<br />
with related parties. The legal relationships to major subsidiaries and investments are listed at the end<br />
of this annual report.<br />
Related parties with which the Group maintains business relationships comprise R<strong>AG</strong>-Stiftung and Gabriel<br />
Acquisitions as shareholders of <strong>Evonik</strong> <strong>Industries</strong> <strong>AG</strong>, fellow subsidiaries of <strong>Evonik</strong> owned by the R<strong>AG</strong>-<br />
Stiftung and associated companies and joint ventures of <strong>Evonik</strong>, which are recognized at equity.<br />
The transactions between the Group and these companies are shown in the table:<br />
<strong>Annual</strong> <strong>Report</strong> <strong>2009</strong> <strong>Evonik</strong> <strong>Industries</strong><br />
R<strong>AG</strong>-Stiftung Fellow subsidiaries <strong>Evonik</strong> Group<br />
in € million <strong>2009</strong> 2008 <strong>2009</strong> 2008 <strong>2009</strong> 2008<br />
Goods and services supplied 1 15 42 152 71 84<br />
Goods and services received − − 304 464 28 55<br />
Other income − − − 2 6 11<br />
Receivables as of December 31 − − 195 201 17 14<br />
Liabilities as of December 31 − − 466 527 34 62<br />
The receivables and liabilities on the reporting date principally result from the supply of coal and electricity.<br />
Further, as of the balance sheet date, €25 million (2008: €28 million) comprised security pledged to a<br />
fellow subsidiary for the liabilities of the Real Estate Business Area in connection with the financing of<br />
property.<br />
Related parties also include members of the management who are directly or indirectly responsible for<br />
corporate planning, management and oversight, and members of their families. At <strong>Evonik</strong>, these parties<br />
comprise the Executive Board and Supervisory Board of <strong>Evonik</strong> <strong>Industries</strong> <strong>AG</strong>, the Executive Board and<br />
Board of Trustees of R<strong>AG</strong>-Stiftung and other members of the Group’s management. The other management<br />
members comprise the Boards of Management of the companies at the head of the Chemicals, Energy and<br />
Real Estate Business Areas.<br />
The Supervisory Board of <strong>Evonik</strong> <strong>Industries</strong> <strong>AG</strong> received total remuneration of €2,075,000 for its work<br />
in <strong>2009</strong> (2008: €1,990,000).<br />
The remuneration paid to the Executive Board of <strong>Evonik</strong> <strong>Industries</strong> <strong>AG</strong> and other members of the Group’s<br />
management is shown in the table:<br />
Executive Board of<br />
<strong>Evonik</strong> <strong>Industries</strong> <strong>AG</strong><br />
Other<br />
management members<br />
in € million <strong>2009</strong> 2008 <strong>2009</strong> 2008<br />
Short-term remuneration 3 20 6 6<br />
Post-employment benefits 10 19 9 15<br />
Termination benefits 1 8 – 1<br />
LTI Plans – 0 – 0<br />
Post-employment benefits comprise pension obligations at the present value of the defined benefit obligation.<br />
Current service cost for pensions amounted to €1 million (2008: €1 million).<br />
Apart from the relationships stated above, <strong>Evonik</strong> did not have any other significant business relationships<br />
with related parties.
Start Management report Consolidated financial statements Supplementary information<br />
Other disclosures<br />
(10.5) Contingent liabilities and other financial commitments<br />
Contingent liabilities were as follows on the reporting date:<br />
in € million Dec. 31, <strong>2009</strong> Dec. 31, 2008<br />
Guarantee obligations 43 44<br />
Obligations under warranties and indemnity guarantees 125 330<br />
168 374<br />
Obligations under warranties and indemnity agreements include letters of comfort, some of which were<br />
issued in conjunction with third parties.<br />
<strong>Evonik</strong> has a legal liability in respect of investments in partnerships, collectively owned enterprises and<br />
as the general partner of limited liability partnerships.<br />
Other financial commitments are outlined below:<br />
The table shows the nominal value of obligations from future minimum lease payments for assets leased<br />
under operating leases with the following payment terms:<br />
in € million Dec. 31, <strong>2009</strong> Dec. 31, 2008<br />
Due within 1 year 64 44<br />
Due in 1–5 years 162 137<br />
Due in more than 5 years 137 119<br />
Contingent rental payments amounted to €3 million in <strong>2009</strong> (2008: none).<br />
363 300<br />
(10.6) Events after the reporting date<br />
Effective January 1, 2010 <strong>Evonik</strong> acquired a production site in Tippecanoe, Lafayette (Indiana, USA) from<br />
Eli Lilly and Company, Indianapolis (Indiana, USA). This site produces active ingredients and starting products<br />
for the pharmaceutical industry. It was agreed not to disclose details of the purchase price.<br />
In parallel with the acquisition of this site, <strong>Evonik</strong> signed an agreement with Eli Lilly and Company on the<br />
supply of pharmaceutical active ingredients and intermediates for a number of years.<br />
Since this acquisition took place close to the reporting date, the recognition of the identifiable assets and<br />
liabilities has not yet been completed.<br />
<strong>Annual</strong> <strong>Report</strong> <strong>2009</strong> <strong>Evonik</strong> <strong>Industries</strong> 159
160<br />
(11) Disclosures in compliance with German legislation<br />
(11.1) Information on shareholdings pursuant to Section 313 Paragraphs 2 and 4 of the German<br />
Commercial Code<br />
Information on the shareholdings of <strong>Evonik</strong> <strong>Industries</strong> <strong>AG</strong> and the Group is provided in a separate list rather<br />
than in the notes to the financial statements. The list indicates which companies have made use of the provisions<br />
in Section 264 Paragraph 3 of the German Commercial Code on exemption from disclosure of annual<br />
financial statements and the preparation of notes to their financial statements and a management report.<br />
(11.2) Personnel expense and number of employees pursuant to Section 314 Paragraph 1 No. 4 of<br />
the German Commercial Code<br />
The personnel expense for the continuing operations in the reporting period comprised the following items:<br />
in € million <strong>2009</strong> 2008<br />
Wages and salaries 2,165 2,320<br />
Social security contributions 331 336<br />
Pension expenses 124 142<br />
Other personnel expense 55 18<br />
<strong>Annual</strong> <strong>Report</strong> <strong>2009</strong> <strong>Evonik</strong> <strong>Industries</strong><br />
2,675 2,816<br />
Interest expense on accrued interest on pensions and the expected return on plan assets are included in net<br />
interest expense, see Note (6.4).<br />
The table shows the annual average headcount for the continuing operations:<br />
by business area <strong>2009</strong> 2008<br />
Chemicals 30,761 32,108<br />
Energy 4,763 4,701<br />
Real Estate 441 443<br />
Corporate, other operations 3,803 3,933<br />
In addition, an average of 657 employees worked for the discontinued operations in 2008.<br />
39,768 41,185
Start Management report Consolidated financial statements Supplementary information<br />
Disclosures in compliance with German legislation<br />
(11.3) Remuneration of Board of Management and Supervisory Board pursuant to Section 314<br />
Paragraph 1 No. 6 of the German Commercial Code<br />
Remuneration paid to the members of the Executive Board of <strong>Evonik</strong> <strong>Industries</strong> <strong>AG</strong> for their work in <strong>2009</strong><br />
amounted to €3,447,407.52 (2008: €20,269,173.51).<br />
Total remuneration for former members of the Executive Board was €1,391,101.38 in <strong>2009</strong> (2008:<br />
€7,699,000.00).<br />
In <strong>2009</strong> €590,450.00 was allocated to provisions for bonuses for 2008 due to members who left the<br />
Executive Board in 2008.<br />
As of the reporting date €13,844,691.00 (2008: €9,657,904.00) was allocated to provisions for pension<br />
obligations to former members of the Executive Board.<br />
The remuneration of the Supervisory Board for <strong>2009</strong> totaled €2,075,000.00 (2008: €1,990,343.03).<br />
(11.4) Auditors’ fees pursuant to Section 314 Paragraph 1 No. 9 of the German Commercial Code<br />
The auditor for the consolidated financial statements of the <strong>Evonik</strong> Group is PricewaterhouseCoopers<br />
Aktiengesellschaft Wirtschaftsprüfungsgesellschaft (PwC), Düsseldorf (Germany). PwC rendered the<br />
following services to the Group:<br />
in € million <strong>2009</strong><br />
Auditing of annual financial statements 4<br />
Other audit-related services 1<br />
Tax consultation services 0<br />
Other services 1<br />
The fees for auditing annual financial statements include expenses for the audit of the consolidated financial<br />
statements and of the separate annual financial statements of <strong>Evonik</strong> <strong>Industries</strong> <strong>AG</strong> and its German subsidiaries.<br />
Other audit-related services comprise services apart from the auditing of annual financial statements,<br />
especially the review of interim financial statements.<br />
Essen, February 22, 2010<br />
<strong>Evonik</strong> <strong>Industries</strong> <strong>AG</strong><br />
The Executive Board<br />
Dr. Engel Blauth Dr. Colberg<br />
<strong>Annual</strong> <strong>Report</strong> <strong>2009</strong> <strong>Evonik</strong> <strong>Industries</strong> 161<br />
6
◂ ◂ ◂ ◂ ◂ ◂ ◂ ◂ ◂ ◂ ◂ ◂ ◂ ◂ ◂ ◂ ◂ ◂ ◂ ◂ ◂ ◂ ◂ ◂ ◂ ◂ ◂ ◂ ◂ ◂ ◂ ◂ ◂ ◂ ◂ ◂ ◂ ◂ ◂ ◂ ◂ ◂ ◂ ◂ ◂ ◂ ◂ ◂ ◂ ◂ ◂ ◂ ◂<br />
◂ ◂ ◂ ◂ ◂ ◂ ◂ ◂ ◂ ◂ ◂ ◂ ◂ ◂ ◂ ◂ ◂<br />
162<br />
◂ ◂ ◂<br />
Tour 4:<br />
Supplementary<br />
information<br />
<strong>Annual</strong> <strong>Report</strong> <strong>2009</strong> <strong>Evonik</strong> <strong>Industries</strong><br />
Tour 4: Supplementary information<br />
164 Auditor’s report<br />
165 <strong>Report</strong> of the Supervisory Board<br />
168 Further information on corporate officers<br />
170 Major shareholdings<br />
172 Market positions<br />
174 Useful information for travelers<br />
◂ ◂ ◂ ◂ ◂ ◂ ◂ ◂ ◂ ◂ ◂ ◂ ◂ ◂ ◂ ◂ ◂ ◂ ◂ ◂ ◂ ◂ ◂ ◂ ◂ ◂ ◂ ◂ ◂ ◂ ◂ ◂ ◂ ◂ ◂ ◂ ◂ ◂ ◂ ◂◂ ◂ ◂ ◂ ◂ ◂ ◂ ◂ ◂ ◂ ◂ ◂ ◂ ◂ ◂ ◂ ◂ ◂ ◂◂ ◂ ◂ ◂ ◂ ◂ ◂ ◂ ◂ ◂ ◂ ◂ ◂ ◂ ◂ ◂ ◂ ◂ ◂ ◂ ◂ ◂ ◂ ◂ ◂ ◂ ◂ ◂ ◂ ◂ ◂ ◂ ◂ ◂ ◂ ◂ ◂ ◂ ◂ ◂
◂ ◂ ◂ ◂ ◂ ◂ ◂◂ ◂ ◂ ◂ ◂ ◂ ◂ ◂ ◂ ◂ ◂ ◂ ◂<br />
Start Management report Consolidated financial statements Supplementary information<br />
◂ ◂◂ ◂ ◂ ◂ ◂ ◂ ◂ ◂ ◂ ◂ ◂ ◂ ◂ ◂ ◂ ◂ ◂ ◂ ◂ ◂ ◂ ◂ ◂ ◂ ◂ ◂ ◂ ◂◂ ◂ ◂ ◂ ◂ ◂ ◂ ◂ ◂ ◂ ◂ ◂ ◂ ◂ ◂ ◂ ◂ ◂◂ ◂ ◂ ◂ ◂ ◂ ◂ ◂ ◂ ◂ ◂ ◂ ◂ ◂ ◂ ◂ ◂ ◂ ◂ ◂ ◂<br />
174<br />
◂ ◂◂◂ ◂ ◂ ◂ ◂ ◂ ◂ ◂ ◂ ◂ ◂ ◂ ◂ ◂ ◂ ◂ ◂ ◂ ◂ ◂ ◂ ◂ ◂ ◂ ◂ ◂ ◂ ◂ ◂ ◂ ◂ ◂ ◂ ◂ ◂ ◂◂ ◂ ◂ ◂ ◂ ◂ ◂ ◂ ◂<br />
172<br />
◂ ◂ ◂ ◂ ◂ ◂ ◂ ◂ ◂◂ ◂ ◂ ◂ ◂ ◂ ◂◂◂ ◂<br />
◂ ◂ ◂ ◂ ◂ ◂◂ ◂ ◂ ◂ ◂ ◂◂◂<br />
170<br />
165<br />
◂ ◂ ◂ ◂ ◂ ◂ ◂ ◂<br />
168<br />
Detailed overview: total length = 12 pages<br />
164<br />
◂ ◂ ◂ ◂ ◂ ◂ ◂ ◂ ◂ ◂<br />
<strong>Annual</strong> <strong>Report</strong> <strong>2009</strong> <strong>Evonik</strong> <strong>Industries</strong> 163
164<br />
<strong>Annual</strong> <strong>Report</strong> <strong>2009</strong> <strong>Evonik</strong> <strong>Industries</strong><br />
Auditor’s report<br />
We have audited the consolidated financial statements prepared by <strong>Evonik</strong> <strong>Industries</strong> <strong>AG</strong>,<br />
Essen, comprising the income statement and the statement of comprehensive income, the<br />
balance sheet, statement of changes in equity, cash flow statement and the notes to the<br />
consolidated financial statements, together with the group management report, which is<br />
combined with the management report of <strong>Evonik</strong> <strong>Industries</strong> <strong>AG</strong> for the business year from<br />
January 1 to December 31, <strong>2009</strong>. The preparation of the consolidated financial statements<br />
and the combined management report in accordance with the IFRSs, as adopted by the<br />
EU, and the additional requirements of German commercial law pursuant to § (Article) 315 a<br />
Abs. (paragraph) 1 HGB (“Handelsgesetzbuch”: German Commercial Code) are the responsibility<br />
of the parent Company’s Executive Board. Our responsibility is to express an opinion<br />
on the consolidated financial statements and on the combined management report based on<br />
our audit.<br />
We conducted our audit of the consolidated financial statements in accordance with<br />
§ 317 HGB and German generally accepted standards for the audit of financial statements<br />
promulgated by the Institut der Wirtschaftsprüfer (Institute of Public Auditors in Germany)<br />
(IDW) and additionally observed the International Standards on Auditing (ISA). Those<br />
standards require that we plan and perform the audit such that misstatements materially<br />
affecting the presentation of the net assets, financial position and results of operations in the<br />
consolidated financial statements in accordance with the applicable financial reporting framework<br />
and in the combined management report are detected with reasonable assurance.<br />
Knowledge of the business activities and the economic and legal environment of the Group<br />
and expectations as to possible misstatements are taken into account in the determination of<br />
audit procedures. The effectiveness of the accounting-related internal control system and the<br />
evidence supporting the disclosures in the consolidated financial statements and the combined<br />
management report are examined primarily on a test basis within the framework of<br />
the audit. The audit includes assessing the annual financial statements of those entities<br />
included in consolidation, the determination of the entities to be included in consolidation,<br />
the accounting and consolidation principles used and significant estimates made by the<br />
Company’s Executive Board, as well as evaluating the overall presentation of the consolidated<br />
financial statements and the combined management report. We believe that our audit<br />
provides a reasonable basis for our opinion. Our audit has not led to any reservations.<br />
In our opinion based on the findings of our audit the consolidated financial statements<br />
comply with the IFRSs as adopted by the EU, the additional requirements of German commercial<br />
law pursuant to § 315 a Abs. 1 HGB and give a true and fair view of the net assets,<br />
financial position and results of operations of the Group in accordance with these provisions.<br />
The combined management report is consistent with the consolidated financial statements<br />
and as a whole provides a suitable view of the Group’s position and suitably presents the<br />
opportunities and risks of future development.<br />
Düsseldorf, February 24, 2010<br />
PricewaterhouseCoopers<br />
Aktiengesellschaft<br />
Wirtschaftsprüfungsgesellschaft<br />
Dr. Norbert Vogelpoth, Wirtschaftsprüfer Eckhard Sprinkmeier, Wirtschaftsprüfer<br />
(German Public Auditor) (German Public Auditor)
Start Management report Consolidated financial statements Supplementary information<br />
<strong>Report</strong> of the Supervisory Board<br />
Ladies and gentlemen:<br />
During the past fiscal year, the Supervisory Board of <strong>Evonik</strong> <strong>Industries</strong> <strong>AG</strong> once again performed<br />
the obligations imposed on it by law and the Articles of Incorporation. We maintained an<br />
ongoing dialog with the Executive Board of <strong>Evonik</strong> <strong>Industries</strong> <strong>AG</strong>, continuously monitored its<br />
management of the company and offered regular advice. The Executive Board provided us<br />
with full and timely information on all relevant aspects of business policy, corporate planning<br />
and strategic development, and the profitability, business performance and situation of the<br />
Group.<br />
We addressed all issues of relevance to the company at four meetings, on March 23, June 17,<br />
September 17 and December 16, <strong>2009</strong> and in two cases—in June and October <strong>2009</strong>—through<br />
a written circulation procedure. In addition, the Executive Board submitted written reports on<br />
business trends and processes of particular importance for <strong>Evonik</strong>. Further, the Chairman of<br />
the Supervisory Board was kept constantly informed of all significant business matters.<br />
Fiscal <strong>2009</strong> was dominated by the global financial and economic crisis, which also had a<br />
substantial impact on <strong>Evonik</strong>. A central element of our discussions was the extensive costcutting<br />
and efficiency enhancement program (“On Track”) adopted by the Executive Board<br />
to counter the crisis. With the support of the workforce, it was possible to protect <strong>Evonik</strong>’s<br />
financial leeway in difficult business conditions.<br />
Following a thorough analysis, the Executive Board presented us with proposals for the<br />
future strategic focus of the <strong>Evonik</strong> Group. These were discussed in detail by the Supervisory<br />
Board at its meeting on December 16, <strong>2009</strong> and unanimously approved.<br />
The outcome is that the Group is to be developed into a global leader in specialty chemicals<br />
with a focus on growth areas that benefit especially from the global megatrends resource<br />
efficiency, health and nutrition, and globalization of technologies. In future, the Energy and<br />
Real Estate Business Areas will be operated as largely independent business entities.<br />
Other key issues discussed included:<br />
• the acquisition of the Eli Lilly site in Tippecanoe (USA)<br />
• the divestment of the AlzChem Group in Trostberg (Germany)<br />
• the erection of a monosilane/AEROSIL® complex (Japan)<br />
• the ramp-up of the production of lithium-ion battery cells in Kamenz (Germany)<br />
• extension of production capacity for methionine (Belgium, USA)<br />
• the STE<strong>AG</strong> 2013 project for the strategic alignment of the Energy Business Area<br />
• the “AYAS” project: development and construction of a hard-coal power plant (Turkey)<br />
• the issue of a €750 million bond with a maturity of five years.<br />
The work of the Supervisory Board was prepared and supported by seven meetings of the<br />
Executive Committee, four meetings of the Finance and Investment Committee and four<br />
meetings of the Audit Committee.<br />
The Supervisory Board also discussed in detail the personnel changes on the Executive<br />
Board of the <strong>Evonik</strong> Group and the reduction in the size of the Corporate Center. Key aspects<br />
included:<br />
• ending the term of office of Heinz-Joachim Wagner as a member of the Executive Board<br />
of <strong>Evonik</strong> <strong>Industries</strong> <strong>AG</strong> in connection with his resignation as of April 30, <strong>2009</strong><br />
• ending the term of office of Ulrich Weber as a member of the Executive Board and Chief<br />
Human Resources Officer of <strong>Evonik</strong> <strong>Industries</strong> <strong>AG</strong> in connection with his resignation as of<br />
June 30, <strong>2009</strong><br />
• the appointment of Ralf Blauth as a member of the Executive Board and Chief Human<br />
Resources Officer of <strong>Evonik</strong> <strong>Industries</strong> <strong>AG</strong> for the period from July 1, <strong>2009</strong> through<br />
June 30, 2012.<br />
Auditor’s report<br />
<strong>Report</strong> of the Supervisory Board<br />
<strong>Annual</strong> <strong>Report</strong> <strong>2009</strong> <strong>Evonik</strong> <strong>Industries</strong> 165
166<br />
<strong>Annual</strong> <strong>Report</strong> <strong>2009</strong> <strong>Evonik</strong> <strong>Industries</strong><br />
PricewaterhouseCoopers Aktiengesellschaft Wirtschaftsprüfungsgesellschaft, Düsseldorf<br />
(Germany) has audited the financial statements of <strong>Evonik</strong> <strong>Industries</strong> <strong>AG</strong> as of December 31,<br />
<strong>2009</strong> prepared in accordance with the German Commercial Code (HGB), the consolidated<br />
financial statements for the <strong>Evonik</strong> Group prepared using the International Financial <strong>Report</strong>ing<br />
Standards (IFRS), as permitted by Section 315 a Paragraph 3 of the German Commercial<br />
Code (HGB), and the combined management report for <strong>Evonik</strong> <strong>Industries</strong> <strong>AG</strong> and the <strong>Evonik</strong><br />
Group, and has endorsed them with an unqualified opinion pursuant to Section 322 of the<br />
German Commercial Code (HGB). The auditors also included the company’s risk management<br />
in the annual audit on the basis of a voluntary request from the Supervisory Board.<br />
The auditors outlined the main findings of their audit at the meeting of the Audit Committee<br />
on March 18, 2010 and the full meeting of the Supervisory Board on March 24, 2010.<br />
Following a thorough examination of the annual financial statements for the company, consolidated<br />
financial statements for the Group and the combined management report, the Supervisory<br />
Board raises no objections to the report and concurs with the auditors’ findings. The<br />
Supervisory Board therefore endorses the annual financial statements for <strong>Evonik</strong> <strong>Industries</strong> <strong>AG</strong><br />
and the consolidated financial statements for the <strong>Evonik</strong> Group. The annual financial statements<br />
for <strong>2009</strong> are thus adopted.<br />
The Board of Management has prepared a report on relations with affiliated companies.<br />
This was examined by the auditors, who have issued the following unqualified opinion in<br />
accordance with Section 313 of the German Stock Corporation Act:<br />
“In accordance with our professional audit and judgment, we confirm that<br />
1. the facts contained in the report are correct<br />
2. the company’s expenditures in connection with the legal transactions contained in the<br />
report were not unreasonably high or compensation was received for any disadvantages.”<br />
The auditors outlined the main findings of their audit at the meeting of the Audit Committee<br />
on March 18, 2010 and the full meeting of the Supervisory Board on March 24, 2010. The<br />
Supervisory Board also examined the report on the affiliated companies for completeness and<br />
correctness. This examination found that the Executive Board has, with the necessary care,<br />
• identified the affiliated companies<br />
• taken the necessary precautions to identify<br />
a) the transactions undertaken by the company during the past fiscal year with the controlling<br />
company or companies affiliated with it or at the instigation of or in the interests<br />
of these companies, further<br />
b) other action taken or not taken at the instigation of or in the interests of these companies<br />
during the past fiscal year<br />
• and has included these actions in their entirety in the report on affiliated companies and<br />
established that no reportable activities were undertaken, nor were any actions omitted.
Start Management report Consolidated financial statements Supplementary information<br />
In its examination of the transactions outlined in the report, the Supervisory Board established<br />
that, under the circumstances known at the time they were undertaken, the company’s<br />
expenditures in connection with these transactions were not unreasonably high. On the basis<br />
of random samples, it obtained an explanation of how the relevant activities and the remuneration<br />
therefor were determined, particularly in the case of transactions of material significance.<br />
The Audit Committee discussed the report in advance and gave the Supervisory Board a<br />
detailed report on the outcome of its meeting. The Supervisory Board has no objections to<br />
raise to the final declaration made by the Executive Board in its report on relations with affiliated<br />
companies and concurs with the auditors’ findings.<br />
Mr. Gebhard Gaßner stepped down from the Supervisory Board effective June 30, <strong>2009</strong>.<br />
We would like to thank him for his dedicated and constructive collaboration. Dr. Wilfried<br />
Robers has been appointed as his successor on the Supervisory Board.<br />
The Supervisory Board would like to thank the Executive Board, Works Councils and all<br />
employees of <strong>Evonik</strong> <strong>Industries</strong> <strong>AG</strong> and its affiliated companies for their achievements in what<br />
was a very difficult year.<br />
The Supervisory Board expressly thanks all members of the workforce for their commitment<br />
and their willingness to support <strong>Evonik</strong>, including their personal contribution to the cut-backs.<br />
Our special thanks go to the Executive Board for its key role in countering the crisis and in the<br />
strategic refocusing of the Group.<br />
Essen, March 2010<br />
The Supervisory Board<br />
Wilhelm Bonse-Geuking, Chairman<br />
<strong>Report</strong> of the Supervisory Board<br />
<strong>Annual</strong> <strong>Report</strong> <strong>2009</strong> <strong>Evonik</strong> <strong>Industries</strong> 167
168<br />
<strong>Annual</strong> <strong>Report</strong> <strong>2009</strong> <strong>Evonik</strong> <strong>Industries</strong><br />
Further information on<br />
corporate officers<br />
Supervisory Board of <strong>Evonik</strong> <strong>Industries</strong> <strong>AG</strong><br />
Wilhelm Bonse-Geuking, Essen<br />
Chairman<br />
Chairman of the Executive Board<br />
of R<strong>AG</strong>-Stiftung<br />
a) Deutsche BP <strong>AG</strong> (Chair)<br />
R<strong>AG</strong> Aktiengesellschaft (Chair)<br />
R<strong>AG</strong> Deutsche Steinkohle <strong>AG</strong> (Chair)<br />
b) HDI-Gerling <strong>AG</strong><br />
NRW Commerzbank <strong>AG</strong><br />
Werner Bischoff, Monheim<br />
Deputy Chairman<br />
Former member of the National Executive<br />
of the Mining, Chemical and Energy Industrial<br />
Union (IG BCE)<br />
a) Continental <strong>AG</strong><br />
<strong>Evonik</strong> Degussa GmbH<br />
RWE <strong>AG</strong><br />
RWE Dea <strong>AG</strong><br />
RWE Power <strong>AG</strong><br />
Günter Adam, Freigericht<br />
Deputy Chairman of the Group Works<br />
Council of <strong>Evonik</strong> <strong>Industries</strong> <strong>AG</strong><br />
Chairman of the Central Works Council<br />
of <strong>Evonik</strong> Degussa GmbH<br />
a) <strong>Evonik</strong> Degussa GmbH<br />
Dr. Peter Bettermann, Weinheim<br />
Spokesman for the management of<br />
Freudenberg & Co. KG<br />
a) BAT (Germany) GmbH (Chair)<br />
TAKKT <strong>AG</strong><br />
b) Wilh. Werhahn KG<br />
Dr. Hans Michael Gaul, Düsseldorf<br />
a) EWE Aktiengesellschaft<br />
HSBC Trinkaus & Burkhardt <strong>AG</strong><br />
IVG Immobilien <strong>AG</strong><br />
Siemens <strong>AG</strong><br />
VNG – Verbundnetz Gas <strong>AG</strong><br />
Volkswagen <strong>AG</strong><br />
Ursel Gelhorn, Essen<br />
Deputy Chairman of the Group Works<br />
Council of <strong>Evonik</strong> Steag GmbH<br />
Stephan Gemkow, Overath<br />
Member of the Board of Management of<br />
Deutsche Lufthansa <strong>AG</strong><br />
a) Delvag Luftfahrtversicherungs-<strong>AG</strong> (Chair)<br />
GfK SE<br />
LSG Lufthansa Service Holding <strong>AG</strong><br />
(Chair)<br />
Lufthansa AirPlus Servicekarten GmbH<br />
(Chair)<br />
Lufthansa Cargo <strong>AG</strong> (Chair)<br />
Lufthansa Systems <strong>AG</strong> (Chair)<br />
Lufthansa Technik <strong>AG</strong> (Chair)<br />
b) Amadeus IT Group S.A.<br />
JetBlue Airways Corporation<br />
WAM Acquisition S.A.<br />
Ralf Giesen, Hanover<br />
Secretary to the Board of the Mining,<br />
Chemical and Energy Industrial Union<br />
(IG BCE)<br />
a) Altana <strong>AG</strong><br />
Ralf Hermann, Herten<br />
Chairman of the Group Works Council<br />
of <strong>Evonik</strong> <strong>Industries</strong> <strong>AG</strong><br />
Chairman of the Group Works Council<br />
of <strong>Evonik</strong> Degussa GmbH<br />
a) <strong>Evonik</strong> Degussa GmbH<br />
b) R<strong>AG</strong>-Stiftung<br />
Prof. Wolfgang A. Herrmann, Freising<br />
President of Munich Technical University<br />
a) E.ON Bayern <strong>AG</strong><br />
b) Bayerische Forschungsallianz GmbH<br />
Steve Koltes, Küsnacht<br />
Managing Director of CVC Capital Partners<br />
Luxembourg, S.à.r.l.<br />
b) DSI International S.à.r.l.<br />
Elster Group S.à.r.l.<br />
Flint Group Holdings S.à.r.l.<br />
Rainer Kumlehn, Hochheim<br />
District Secretary of the Hesse-Thuringia<br />
Section of the Mining, Chemical and Energy<br />
Industrial Union (IG BCE)<br />
a) <strong>Evonik</strong> Degussa GmbH<br />
Goodyear Dunlop Tires Germany GmbH<br />
Hoechst GmbH
Start Management report Consolidated financial statements Supplementary information<br />
Dr. Siegfried Luther, Gütersloh<br />
Former CFO of Bertelsmann <strong>AG</strong><br />
a) Infineon Technologies <strong>AG</strong><br />
WestLB <strong>AG</strong><br />
Wintershall Holding <strong>AG</strong><br />
b) Compagnie Nationale à Portefeuille S.A.<br />
RTL S.A.<br />
Jürgen Nöding, Duisburg<br />
Chairman of the Central Works Council<br />
of <strong>Evonik</strong> Services GmbH<br />
a) <strong>Evonik</strong> Services GmbH<br />
Konrad Oelze, Essen<br />
Deputy Chairman of the Group Works<br />
Council of <strong>Evonik</strong> Degussa GmbH<br />
a) <strong>Evonik</strong> Goldschmidt GmbH<br />
b) Die Vorsorge Sterbekasse der Werksangehörigen<br />
der Degussa <strong>AG</strong> VVaG<br />
Dr. Wilfried Robers, Gescher<br />
from July 21, <strong>2009</strong><br />
Chairman of the Group Senior Staff<br />
Committee of <strong>Evonik</strong> <strong>Industries</strong> <strong>AG</strong><br />
Chairman of the Group Senior Staff<br />
Committee of <strong>Evonik</strong> Degussa GmbH<br />
b) Pensionskasse Degussa VVaG<br />
Rainer Schankweiler, Essen<br />
Deputy Chairman of the Working Group of<br />
the Works Councils of <strong>Evonik</strong> Immobilien<br />
GmbH<br />
Christian Strenger, Frankfurt am Main<br />
Former spokesperson for the management<br />
of DWS Investment GmbH<br />
a) DWS Investment GmbH<br />
Fraport <strong>AG</strong><br />
b) The Germany Funds (Chair)<br />
Dr. Volker Trautz, Rotterdam<br />
Former Chairman of the Management<br />
Board of LyondellBasell Holdings B.V.<br />
Dr. Christian Wildmoser, Savigny<br />
Managing Director of CVC Capital Partners<br />
Switzerland GmbH<br />
b) Flint Group Holdings S.à.r.l.<br />
Members who left the Supervisory Board<br />
during <strong>2009</strong>:<br />
Gebhard Gaßner<br />
until June 30, <strong>2009</strong><br />
Executive Board of <strong>Evonik</strong> <strong>Industries</strong> <strong>AG</strong><br />
Dr. Klaus Engel, Mülheim a. d. Ruhr<br />
Chairman<br />
a) <strong>Evonik</strong> Degussa GmbH (Chair)<br />
<strong>Evonik</strong> Steag GmbH (Chair)<br />
b) <strong>Evonik</strong> Immobilien GmbH<br />
<strong>Evonik</strong> Wohnen GmbH<br />
Ralf Blauth, Marl<br />
from July 1, <strong>2009</strong><br />
a) <strong>Evonik</strong> Services GmbH<br />
<strong>Evonik</strong> Steag GmbH<br />
Industriepark Wolfgang GmbH<br />
Infracor GmbH (Chair)<br />
b) <strong>Evonik</strong> Immobilien GmbH (Chair)<br />
<strong>Evonik</strong> Wohnen GmbH (Chair)<br />
Pensionskasse Degussa VVaG (Chair)<br />
R<strong>AG</strong> BILDUNG GmbH<br />
THS GmbH<br />
Dr. Wolfgang Colberg, Ratingen<br />
from April 1, <strong>2009</strong><br />
a) <strong>Evonik</strong> Degussa GmbH<br />
<strong>Evonik</strong> Services GmbH (Chair)<br />
<strong>Evonik</strong> Steag GmbH<br />
Roto Frank <strong>AG</strong><br />
b) <strong>Evonik</strong> Immobilien GmbH<br />
<strong>Evonik</strong> Wohnen GmbH<br />
Pernod Ricard SA<br />
Members who left the Executive Board<br />
during <strong>2009</strong>:<br />
Heinz-Joachim Wagner, Bad Nauheim<br />
until April 30, <strong>2009</strong><br />
Ulrich Weber, Krefeld<br />
until June 30, <strong>2009</strong><br />
a) Membership of other statutory supervisory boards.<br />
b) Membership of comparable German and foreign supervisory bodies of business enterprises.<br />
Further information on<br />
corporate officers<br />
<strong>Annual</strong> <strong>Report</strong> <strong>2009</strong> <strong>Evonik</strong> <strong>Industries</strong> 169
Major shareholdings<br />
170<br />
I. Consolidated subsidiaries<br />
Chemicals Business Area<br />
Germany<br />
<strong>Annual</strong> <strong>Report</strong> <strong>2009</strong> <strong>Evonik</strong> <strong>Industries</strong><br />
Equity1)<br />
<strong>Evonik</strong>’s stake including shareholdings<br />
pursuant to Section 16 German Stock<br />
Corporation Act (AktG)<br />
in € million Direct % Indirect % Total %<br />
1. <strong>Evonik</strong> Degussa GmbH, Essen 2,739 94.90 5.10 100.00<br />
2. <strong>Evonik</strong> Goldschmidt GmbH, Essen 127 100.00 100.00<br />
3. <strong>Evonik</strong> Litarion GmbH, Kamenz 8 100.00 100.00<br />
4. <strong>Evonik</strong> Oxeno GmbH, Marl 39 100.00 100.00<br />
5. <strong>Evonik</strong> Röhm GmbH, Darmstadt 168 100.00 100.00<br />
6. <strong>Evonik</strong> RohMax Additives GmbH, Darmstadt 31 100.00 100.00<br />
7. <strong>Evonik</strong> Stockhausen GmbH, Krefeld 127 100.00 100.00<br />
8. Infracor GmbH, Marl 66 100.00 100.00<br />
Other countries<br />
9. Degussa Engineered Carbons L.P., Parsippany (NJ, US) −11 100.00 100.00<br />
10. <strong>Evonik</strong> Cyro LLC, Parsippany (NJ, US) 23 100.00 100.00<br />
11. <strong>Evonik</strong> Amalgamation Ltd.<br />
(formerly Degussa Amalgamation Ltd.) Milton Keynes (UK) 467 100.00 100.00<br />
12. <strong>Evonik</strong> Degussa (China) Co. Ltd., Beijing (CN) 48 100.00 100.00<br />
13. <strong>Evonik</strong> Degussa Antwerpen N.V., Antwerp (BE) 152 99.99 99.99<br />
14. <strong>Evonik</strong> Degussa Brasil Ltda., São Paulo (BR) 128 100.00 100.00<br />
15. <strong>Evonik</strong> Degussa Canada Inc., Burlington (CA) 45 100.00 100.00<br />
16. <strong>Evonik</strong> Degussa Corporation, Parsippany (NJ, US) 1,486 100.00 100.00<br />
17. <strong>Evonik</strong> Degussa Japan Co. Ltd., Tokyo (JP) 80 100.00 100.00<br />
18. <strong>Evonik</strong> Degussa UK Holdings Ltd., London (UK) 474 100.00 100.00<br />
19. <strong>Evonik</strong> Goldschmidt Chemical Corporation, Delaware<br />
(formerly Hopewell) (VA, US) 11 100.00 100.00<br />
20. <strong>Evonik</strong> Monosilane Japan Co. Ltd., Tokyo (JP) 7 100.00 100.00<br />
21. <strong>Evonik</strong> RohMax USA Inc., Horsham (PA, US) 19 100.00 100.00<br />
22. <strong>Evonik</strong> Stockhausen LLC, Greensboro (NC, US) 0 100.00 100.00<br />
23. <strong>Evonik</strong> Speciality Organics Ltd.<br />
(formerly Laporte Speciality Organics Ltd.), Milton Keynes (UK) 356 100.00 100.00<br />
24. Nippon Aerosil Co. Ltd., Tokyo (JP) 49 80.00 80.00<br />
Energy Business Area<br />
Germany<br />
25. <strong>Evonik</strong> Steag GmbH, Essen 674 5.10 94.90 100.00<br />
26. <strong>Evonik</strong> Energy Services GmbH, Essen 8 100.00 100.00<br />
27. <strong>Evonik</strong> Fernwärme GmbH, Essen 21 100.00 100.00<br />
28. <strong>Evonik</strong> New Energies GmbH, Saarbrücken 66 100.00 100.00<br />
29. <strong>Evonik</strong> Power Saar GmbH, Saarbrücken 11 100.00 100.00<br />
30. <strong>Evonik</strong> Power Minerals GmbH, Dinslaken 34 100.00 100.00<br />
31. <strong>Evonik</strong> Trading GmbH, Essen 35 100.00 100.00<br />
32. RVG GmbH, Essen 1 51.00 51.00<br />
33. <strong>Evonik</strong>-EVN Walsum 10 Kraftwerksgesellschaft mbH, Essen 123 51.00 51.00<br />
34. STE <strong>AG</strong>-Raffinerie-Kraftwerk-Sachsen-Anhalt GmbH, Spergau (formerly Essen) 2 100.00 100.00<br />
Other countries<br />
35. Compañia Eléctrica de Sochagota S.A.E.S.P., Tunja (CO) 52 51.00 51.00<br />
36. Iskenderun Enerji Üretim ve Ticaret A.S., Ankara (TR) 1,012 51.00 51.00<br />
37. SFW Energia Sp. z o.o., Gliwice (PL) 14 100.00 100.00<br />
38. STE <strong>AG</strong> State Power Inc., Makati City (PH) 160 51.00 51.00
Start Management report Consolidated financial statements Supplementary information<br />
Real Estate Business Area<br />
Germany<br />
Equity1)<br />
Major shareholdings<br />
<strong>Evonik</strong>’s stake including shareholdings<br />
pursuant to Section 16 German Stock<br />
Corporation Act (AktG)<br />
in € million Direct % Indirect % Total %<br />
39. <strong>Evonik</strong> Immobilien GmbH, Essen 334 100.00 100.00<br />
40. Aachener Bergmannssiedlungsgesellschaft mbH, Hückelhoven 25 100.00 100.00<br />
41. Bauverein Glückauf GmbH, Ahlen 11 94.90 94.90<br />
42. EBV GmbH, Hückelhoven 78 100.00 100.00<br />
43. <strong>Evonik</strong> Wohnen GmbH, Essen 3 100.00 100.00<br />
44. Heinrich Schäfermeyer GmbH, Hückelhoven 10 100.00 100.00<br />
45. Lünener Wohnungs- und Siedlungsgesellschaft mbH, Lünen 28 100.00 100.00<br />
46. Rhein Lippe Wohnen GmbH, Duisburg 98 100.00 100.00<br />
47. Siedlung Niederrhein GmbH, Dinslaken 43 100.00 100.00<br />
48. Walsum Immobilien GmbH, Duisburg 25 100.00 100.00<br />
49. Wohnbau Auguste Victoria GmbH, Marl 35 100.00 100.00<br />
50. Wohnbau Westfalen GmbH, Dortmund 80 100.00 100.00<br />
51. Wohnungsbaugesellschaft mbH “Glückauf“, Moers 44 100.00 100.00<br />
Other companies<br />
Germany<br />
52. <strong>Evonik</strong> Services GmbH, Essen 0 100.00 100.00<br />
53. <strong>Evonik</strong> Projekt-Beteiligungs-GmbH & Co. KG, Essen 344 99.00 99.00<br />
54. RBV Verwaltungs-GmbH, Essen 240 100.00 100.00<br />
II. Joint ventures (recognized at equity)<br />
Energy Business Area<br />
Germany<br />
55. REG Raffinerie-Energie GmbH & Co. oHG<br />
(formerly REG Raffinerie-Energie oHG), Cologne 14 80.00 80.00<br />
Other countries<br />
56. Ayas Enerji Üretim ve Ticaret A.S., Ankara (TR) 16 51.00 51.00<br />
Real Estate Business Area<br />
Germany<br />
57. THS GmbH, Essen 182 50.00 50.00<br />
III. Associated companies (recognized at equity)<br />
Chemicals Business Area<br />
Germany<br />
58. JSSi GmbH, Freiberg 25 51.00 51.00<br />
59. Kommanditgesellschaft Deutsche Gasrußwerke GmbH & Co., Dortmund 8 54.35 54.35<br />
Energy Business Area<br />
Germany<br />
60. Fernwärmeversorgung Niederrhein GmbH, Dinslaken 44 26.00 26.00<br />
61. Gichtgaskraftwerk Dillingen GmbH & Co. KG, Dillingen 12 49.90 49.90<br />
62. Kraftwerk Bexbach Verwaltungsgesellschaft mbH, Bexbach 24 33.33 33.33<br />
Other countries<br />
63. ARKAD Deniz Tasimaciligi A.S., Istanbul (TR) 23 49.00 49.00<br />
1) Foreign currency amounts are translated at the closing rate on the reporting date.<br />
<strong>Annual</strong> <strong>Report</strong> <strong>2009</strong> <strong>Evonik</strong> <strong>Industries</strong> 171
Market positions<br />
Chemicals Business Area<br />
Product Application<br />
172<br />
<strong>Annual</strong> <strong>Report</strong> <strong>2009</strong> <strong>Evonik</strong> <strong>Industries</strong><br />
Global<br />
ranking<br />
Capacity in<br />
metric tons p.a.<br />
Industrial Chemicals<br />
Alcoholates Catalysts for biodiesel, pharmaceuticals, agrochemicals<br />
and other applications 1 >150,000<br />
Cyanuric chloride Crop protection and industrial applications (e.g. optical brighteners) 1 132,000<br />
Hydrogen peroxide Bleaching of pulp and textiles, oxidation agent for the chemical industry 2 600,000<br />
2-propylheptanol Plasticizers 2 60,000<br />
Butene-1 Co-monomer for polyolefins 11) 200,000<br />
Isononanol Plasticizers 2 340,000<br />
Inorganic Materials<br />
Organosilanes, chlorosilanes Rubber, silicone rubber, paints and coatings, adhesives and sealants, building<br />
protection materials, pharmaceuticals, cosmetics, optical fibers, photovoltaics 12) 270,000<br />
Fumed silicas, fumed metal oxides Silicone rubber, paints and coatings, adhesives, sealants and plastics,<br />
pharmaceuticals, cosmetics, high-temperature insulation, electronics 1<br />
Precipitated silicas Reinforcement of rubber, consumer products 1<br />
Matting agents Additives for the coatings and printing inks industry 2<br />
470,000<br />
Carbon blacks Tires, rubber goods, pigments 2 1,400,000<br />
Health & Nutrition<br />
Exclusive synthesis of fine chemicals Intermediates and active substances for pharmaceutical and agrochemical<br />
applications 3 3)<br />
Precious metal powder catalysts Life sciences and fine chemicals 1 3)<br />
Amino acids Pharmaceutical intermediates and infusion solutions 3 3)<br />
DL-methionine Animal nutrition 1 350,000<br />
Threonine Animal nutrition 2 30,000<br />
Tryptophan Animal nutrition 2 3)<br />
Consumer Specialties<br />
Superabsorbents Diapers, feminine hygiene products, incontinence products,<br />
technical applications 1 460,000<br />
Organically modified silicones Additives for polyurethane foams, coatings and inks, cosmetics;<br />
radiation-cured separation coatings 1–2 80,000<br />
Fat chemistry, quaternary derivatives Fabric softeners 1 3)<br />
Amphoteric surfactants Shampoos, shower gels 1 3)<br />
Ceramides, phytosphingosines Cosmetics 1 3)<br />
Skin cremes Professional skin protection 2–3 3)<br />
Coatings & Additives<br />
Colorants (pigment dispersions) Decorative and industrial colorants 1–2 3)<br />
Polyester resins Can and coil coating 1 31,000<br />
Isophorone chemistry Environment-friendly coating systems, high-performance composites 1 3)<br />
Pharmaceutical polymers Coatings for drugs 2 3)<br />
Oil additives Viscosity index improvers 2 3)<br />
Thermoplastic and reactive<br />
methacrylate resins<br />
Binders for paints and coatings<br />
1 3)<br />
Performance Polymers<br />
Polyamide 12 High-performance specialty polymer applications<br />
(e.g. automotive, medical, sport) 1 3)<br />
Methylmethacrylate (MMA) Dispersions, coatings, plastics 2 580,000<br />
Methacrylate specialty momomers Dispersions, coatings, additives, adhesives, optical lenses 1 3)<br />
Methacrylate polymers (PMMA<br />
molding compounds)<br />
Construction materials for the automotive and electrical/electronics<br />
industries, medical technology 2 240,000<br />
Acrylic glass Construction industry, illuminated signboards, aviation/aerospace applications 1 150,000
Start Management report Consolidated financial statements Supplementary information<br />
Energy Business Area<br />
Activity<br />
Power Germany<br />
Energy generation from fossil fuels<br />
thereof power generation from hard coal<br />
Renewables<br />
Energy generation from renewable resources (biomass, geothermal energy, mine gas)<br />
and contracting<br />
Power Minerals<br />
Market positions<br />
Ranking<br />
Germany <strong>Annual</strong> volume<br />
5<br />
2<br />
Electricity: 17,435 GWhel<br />
Heat: 11,364 TJ<br />
16,284 GWhel<br />
1–3 Electricity: 1,509 GWhel<br />
Heat: 1,608 GWhth<br />
Disposal and reprocessing of power plant residues such as fly ash, gypsum,<br />
slag-tap granulate and furnace bottom ash 1 3,000,000 metric tons<br />
Power Other Countries<br />
Power generation in<br />
• Colombia<br />
• Mindanao (Philippines)<br />
• Turkey<br />
Real Estate Business Area<br />
Activity<br />
Ranking<br />
Other countries<br />
9<br />
3<br />
3<br />
Ranking<br />
Germany<br />
828 GWh<br />
1,497 GWh<br />
10,066 GWh<br />
No. of<br />
residential units<br />
Letting of residential units, mainly to private households 7 approx. 60,000<br />
1) Freely traded volumes.<br />
2) Chlorosilanes: freely traded volumes. Overall assessment —market position differs depending on application.<br />
3) No data available.<br />
<strong>Annual</strong> <strong>Report</strong> <strong>2009</strong> <strong>Evonik</strong> <strong>Industries</strong> 173
174<br />
<strong>Annual</strong> <strong>Report</strong> <strong>2009</strong> <strong>Evonik</strong> <strong>Industries</strong><br />
Useful information for travelers<br />
General<br />
Here are some basic facts and figures<br />
about this annual report:<br />
Dimensions (B x H): 189 x 315 cm<br />
Weight: approx. 800 g<br />
Paper type: Galaxi Keramik<br />
Paper weight: inner pages 135 g, inner<br />
wrapper 200 g, cover 300 g<br />
Key terms<br />
Geothermal energy<br />
Geothermal energy, the heat stored beneath<br />
the Earth’s surface, can be used to heat<br />
buildings. If the source is close to the surface,<br />
it can be used directly or fed into the<br />
district heating grid. Deeper sources first<br />
have to brought to the surface. Moreover,<br />
power plants can utilize heat from several<br />
thousand meters below the Earth’s surface<br />
to generate electricity.<br />
Monomers<br />
Monomers are simple molecules with a low<br />
molecular weight that can react with each<br />
other to form polymers<br />
PEEK<br />
Polyetheretherketones (PEEK) are partially<br />
crystalline high-performance polymers with<br />
outstanding mechanical properties and very<br />
good temperature resistance. In view of<br />
their exceptional mechanical, thermal and<br />
chemical properties, they are mainly used<br />
as components and functional parts in automotive<br />
engineering, aviation, electronics and<br />
medical appliances.<br />
Polymers /oligomers<br />
Long-chain, short-chain or crosslinked macromolecules<br />
produced from smaller molecules<br />
(e.g. monomers).<br />
Polymethylmethacrylate (PMMA)<br />
Colorless plastic (acrylic glass) that can be<br />
colored. Properties: high transparency, good<br />
moldability, extremely good stability to<br />
weathering. Applications: construction,<br />
automotive engineering, optics, optoelectronics,<br />
household and designer goods,<br />
exhibition stands, illuminated signboards,<br />
lamps. Best-known brand: PLEXIGLAS�.<br />
Supply form: thermoplastic molding compounds,<br />
cast or extruded components<br />
(sheet, film, tubes, rods).<br />
Polyurethane (PUR)<br />
Polymers with excellent thermal and sound<br />
insulating properties and a very broad spectrum<br />
of applications. Flexible foamed PUR<br />
is used for cushions, mattresses and interior<br />
trims. Rigid PUR is used in automotive engineering,<br />
construction and furniture.<br />
Power plant efficiency<br />
This is a measure of energy efficiency. It<br />
indicates the proportion of the energy<br />
input that is converted into power. The<br />
higher the efficiency of a power plant, the<br />
more effectively the fuel is used. The efficiency<br />
of advanced hard-coal power plants<br />
can exceed 45 percent.<br />
Reserve generating capacity<br />
Reserve capacity is required to adjust the<br />
supply of power to changes in demand and<br />
supply, i.e. to maintain alternating current at<br />
a constant frequency. The need to raise or<br />
lower the amount of power sourced from<br />
reserve capacity may result from an increase<br />
or decrease in either demand or supply. For<br />
example, fluctuations in supply may be<br />
caused by an unexpectedly high amount of<br />
wind power being fed into the grid or temporary<br />
shutdown of a power plant. Alternatively,<br />
demand may differ from the forecast<br />
level.<br />
Silanes<br />
A group of chemical compounds made up<br />
of silicon and, normally, hydrogen. If they<br />
contain chlorine, such compounds are<br />
known as chlorosilanes. Silanes are used to<br />
produce high-purity silicon for integrated<br />
circuits and solar cells and as raw materils<br />
for high-purity silicoin dioxide for fiber<br />
optics. Chlorosilanes can also be used to<br />
produce fumed silicas for a wide variety of<br />
applications.
Start Management report Consolidated financial statements Supplementary information<br />
Superabsorbents<br />
Crosslinked polymers that are insoluble in<br />
water and can absorb and store large quantities<br />
of liquid through a mechanism that<br />
causes them to swell and form hydrogen<br />
gels. The liquid is not released even under<br />
pressure.<br />
Vacancy rate<br />
The number of residential units that are<br />
vacant as a percentage of the total real<br />
estate portfolio.<br />
Typical quotes<br />
“The sun is our guide through this annual<br />
report. It is the source of a vast array of new<br />
developments that help improve energy<br />
efficiency.” (page 1)<br />
“<strong>Evonik</strong> <strong>Industries</strong> has the capability to play<br />
a leading role in the growing area of resource<br />
efficiency—through its core competencies,<br />
targeted research and pioneering technologies.“<br />
(page 1)<br />
“We offer powerful ideas: sustainable solutions<br />
that exploit the power of sunlight.”<br />
(page 4)<br />
“Our aim is to develop <strong>Evonik</strong> from a conglomerate<br />
into a global leader in specialty<br />
chemicals. In the future the Energy and Real<br />
Estate Business Areas will operate as largely<br />
independent entities within the Group.”<br />
(page 5)<br />
“<strong>Evonik</strong>’s financial performance in <strong>2009</strong><br />
was rewarded by the capital markets.”<br />
(page 8)<br />
“We have the courage and imagination to<br />
move away from trodden paths in order to<br />
solve problems for our customers.” (page 17)<br />
1) Top 5 sites in each region based on number of employees.<br />
<strong>Evonik</strong>’s largest sites1)<br />
Germany<br />
Marl 6,499<br />
Essen 3,266<br />
Wolfgang 2,459<br />
Darmstadt 1,503<br />
Wesseling 1,220<br />
Other European countries<br />
Antwerp 981<br />
Zurich 260<br />
Ham 253<br />
Slovenská Ľupča 170<br />
Gramatneusiedl 169<br />
North America<br />
Mobile, AL 673<br />
Lafayette, IN 657<br />
Parsippany, NJ 415<br />
Greensboro, NC 271<br />
Hopewell, VA 235<br />
Central and South America<br />
São Paulo 168<br />
Sochagota 127<br />
Barra do Riacho 54<br />
Americana 42<br />
Paulínia 38<br />
Asia<br />
Shanghai 765<br />
Dalian 758<br />
Yingkou 638<br />
Nanping 350<br />
Nanning 347<br />
Other / Rest of world<br />
Port Elizabeth 80<br />
Dandenong 64<br />
Morrinsville 27<br />
Umbogintwini (Durban) 27<br />
Midrand 25<br />
Useful information for travelers<br />
<strong>Annual</strong> <strong>Report</strong> <strong>2009</strong> <strong>Evonik</strong> <strong>Industries</strong> 175
Credits<br />
Published by<br />
<strong>Evonik</strong> <strong>Industries</strong> <strong>AG</strong><br />
Rellinghauser Straße 1 –11<br />
45128 Essen<br />
Germany<br />
www.evonik.com<br />
Contact<br />
Communications/Board Office<br />
phone +49 201 177-3899<br />
fax +49 201 177-2911<br />
info@evonik.com<br />
Creditor Relations<br />
phone +49 201 177-2222<br />
fax +49 201 177-3205<br />
creditor-relations@evonik.com<br />
Concept, layout, typesetting and production<br />
XEO – Energy for Brands, Düsseldorf (Germany)<br />
Photographs<br />
© bildstelle/MCPHOTO<br />
Karsten Bootmann<br />
Wolfgang A. Danzmaier B. A. © www.fotolia.de<br />
Matthias Dietze/dieKLEINERT<br />
Jochen Eckel<br />
Getty Images Deutschland GmbH<br />
iStockphoto<br />
Jörg Kritzer Fotos<br />
mauritius images GmbH<br />
Andreas Teichmann Fotografie<br />
XEO – Energy for Brands<br />
Printing<br />
Laupenmühlen Druck GmbH & Co. KG, Bochum (Germany)<br />
<strong>Evonik</strong> <strong>Industries</strong> is a worldwide manufacturer of PMMA products sold under the<br />
PLEXIGLAS� trademark on the European, Asian, African and Australian continents<br />
and under the trademark ACRYLITE� in the Americas.<br />
176<br />
<strong>Annual</strong> <strong>Report</strong> <strong>2009</strong> <strong>Evonik</strong> <strong>Industries</strong>
<strong>Evonik</strong> <strong>Industries</strong> <strong>AG</strong><br />
Rellinghauser Straße 1–11<br />
45128 Essen<br />
Germany<br />
www. evonik.com