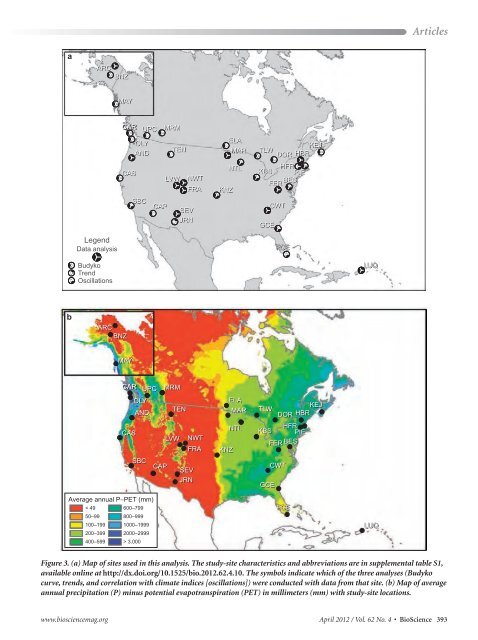
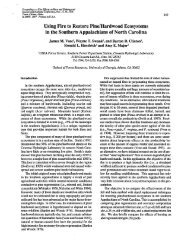
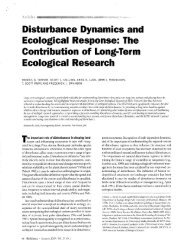
a b ARC BNZ Legend Data analysis Budyko Trend Oscillations MAY CAR CAR CAR CAS ARC BNZ MAY CAR CAR CAR CAS UPC OLY AND SBC CAP OLY UPC AND SBC CAP Average annual P−PET (mm) < 49 600–799 50–99 800–999 100–199 1000–1999 200–399 2000–2999 400–599 > 3.000 MRM TEN LVW NWT FRA MRM SEV JRN TEN LVW NWT FRA SEV JRN ELA MAR KNZ KNZ NTL ELA MAR NTL KEJ TLW DOR HBR HFR KBS PIE BES FER BES FER Articles www.biosciencemag.org April 2012 / Vol. 62 No. 4 • BioScience 393 GCE TLW GCE CWT FCE DOR HFR KBS PIE FER BES CWT FCE KEJ HBR Figure 3. (a) Map <strong>of</strong> sites used in this analysis. The study-site characteristics and abbreviations are in supplemental table S1, available online at http://dx.doi.org/10.1525/bio.2012.62.4.10. The symbols indicate which <strong>of</strong> the three analyses (Budyko curve, trends, and correlation with climate indices [oscillations]) were conducted with data from that site. (b) Map <strong>of</strong> average annual precipitation (P) minus potential evapotranspiration (PET) in millimeters (mm) with study-site locations. LUQ LUQ
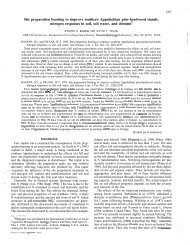
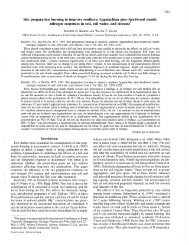
Articles Figure 4. Mean annual temperature, mean annual precipitation, and biomes <strong>of</strong> the study sites. The studysite abbreviations are in supplemental table S1, available online at http://dx.doi.org/10.1525/bio.2012.62.4.10. Data for the MCM site are not shown. Abbreviations: °C, degrees Celsius; mm, millimeters. and potential vegetation may differ because <strong>of</strong> disturbance (table S1). In our analyses, we examined three questions, using successively more-stringent requirements <strong>of</strong> data sets and interpreted these results in the light <strong>of</strong> ecological and social factors: (1) How is potential evapotranspiration (PET) related to actual evapotranspiration (AET) at each site, and how do these relationships compare with the theoretical Budyko curve (n = 30 sites)? (2) How is streamflow correlated with climate indices (e.g., the El Niño–Southern Oscillation [ENSO], the Pacific Decadal Oscillation [PDO], the North Atlantic Oscillation [NAO]; n = 21 sites)? (3) How have temperature, precipitation, and streamflow changed over time (n = 19 sites)? Energy- and water-balance relationships to observed water use The values <strong>of</strong> T, P, and Q from 30 sites with matched T, P, and Q (table S1, figure 3) were used to calculate PET and AET (i.e., P – Q). These values were plotted on the Budyko curve (Budyko 1974), which displays the relationship between PET and AET, each indexed by P (figure 5a). Thirty <strong>of</strong> the 35 sites had data on T, P, Q, and basin area for a common 10-year period (1993–2002), although a slightly adjusted period was used for 10 <strong>of</strong> the sites (figure 5b). PET was calculated from T (after Hamon 1963) on the basis <strong>of</strong> the number <strong>of</strong> daylight hours, mean monthly temperature, and the saturated vapor pressure. Annual PET was calculated as a sum <strong>of</strong> monthly values. The Budyko curve assumes that the water balance is Q = P – ET (evapotranspiration), with no significant losses to or gains from groundwater, and that the basins are at steady state, unaffected by vegetation dynamics (Donohue et al. 2007). The distribution <strong>of</strong> study basins on the Budyko curve reveals that observed water use in ecosystems in small basins deviated systematically from its expected dependence on energy and water balances. As was expected, observed ecosystem water use (AET ÷ P) was positively correlated to energy and water inputs to evapotranspiration (PET ÷ P) in sites with a water surplus (P ÷ PET) and insensitive to increases in energy at sites with a water deficit (P ÷ PET), following the theoretical Budyko curve (figure 5b). However, only 7 <strong>of</strong> 30 sites (ARC, DOR, FRA, HBR, KEJ, KNZ, and OLY) fell on the Budyko curve, where observed water use (AET ÷ P) was equal to predicted water use (PET ÷ P) (fi gure 5b). Of the 19 sites with a moisture surplus (P ÷ PET) that did not fall on the Budkyo curve, 14 were above it, with higher than expected evapotranspiration (AET ÷ P > PET ÷ P). Of the five sites with moisture deficits (P < PET), four fell below the Budyko curve, with lower than expected evapotranspiration (AET ÷ P < PET ÷ P) (figure 5b). This result may indicate that ecosystems evaporate, transpire, and store more water than would be expected on the basis <strong>of</strong> temperature and day length at wet sites and less than would be expected at dry sites. Ecosystem structure (e.g., rooting depth, leaf area) and processes (e.g., adaptations to water deficits) may produce lower streamflow in wet sites and higher streamflow in dry sites than would be predicted from energy and water balances alone. However, other factors may also explain the departures <strong>of</strong> the sites from the theoretical Budyko curve. For instance, the PET value estimated from climate-station T records may not represent PET over entire basins, especially in mountain sites (e.g., AND, NWT, LVW). AET ÷ P is also considerably overestimated from P – Q in basins in which the groundwater recharge bypasses the stream gauge (Graham et al. 2010, Verry et al. 2011). When the annual values <strong>of</strong> T, P, and Q are plotted on the Budkyo curve, the interannual variation <strong>of</strong> AET relative to PET varies among biomes (figure 5c, 5d). Variation in AET ÷ P was less than in PET ÷ P at the desert sites (CAP, SEV) and at forested sites (AND, CAS, CWT, FER, HBR, MAR, NTL) (figure 5d). In contrast, at alpine sites (LVW, NWT), the interannual variation in AET ÷ P was large relative to the variation in PET ÷ P. This behavior <strong>of</strong> sites relative to the Budyko curve implies that ecosystems are capable <strong>of</strong> adjusting AET to compensate for climate variability at desert, grassland, and forest sites, but less so at alpine sites. Ecosystems have more-similar rates <strong>of</strong> net primary productivity per unit precipitation in dry than in wet years (Huxman et al. 2004). Comparisons <strong>of</strong> long-term AET and PET from study basins to the theoretical Budyko curve (figure 5) suggest that AET varies in a narrower range than would be expected from energy and water balances alone, which underscores the importance <strong>of</strong> ecosystem process effects on streamflow. 394 BioScience • April 2012 / Vol. 62 No. 4 www.biosciencemag.org