biology join - Coweeta LTER - University of Georgia
biology join - Coweeta LTER - University of Georgia
biology join - Coweeta LTER - University of Georgia

Create successful ePaper yourself
Turn your PDF publications into a flip-book with our unique Google optimized e-Paper software.
Articles<br />
Proportion change per year<br />
relative to the mean daily flow<br />
Proportion change per year<br />
relative to the mean daily flow<br />
Proportion change per year<br />
relative to the mean daily flow<br />
Proportion change per year<br />
relative to the mean daily flow<br />
Proportion change per year<br />
relative to the mean daily flow<br />
a b<br />
CAP – Sycamore Creek – 1961–2010<br />
SEV – Jemez River – 1954–2010<br />
.10<br />
.015<br />
.05<br />
.00<br />
.01<br />
.005<br />
.00<br />
−.05<br />
−.005<br />
−.01<br />
O N D J F M A M J J A S O<br />
−.01<br />
O N D J F M A M J J A S O<br />
Month<br />
Month<br />
c JRN – Rio Ruidoso – 1950–2010<br />
d SBC – San Jose Creek – 1950–2010<br />
.015<br />
.08<br />
.01<br />
.06<br />
.005<br />
.04<br />
.00<br />
.02<br />
−.005<br />
.00<br />
−.01<br />
−.02<br />
−.015<br />
O N D J F M A M J J A S O<br />
−.04<br />
O N D J F M A M J J A S O<br />
Month<br />
Month<br />
e GCE – Ohoopee River – 1950–2009<br />
f ARC – Kuparuk River – 1971–2010<br />
.02<br />
.20<br />
.01<br />
.15<br />
.10<br />
.00<br />
.05<br />
−.01<br />
.00<br />
−.05<br />
−.02<br />
−.10<br />
−.03<br />
O N D J F M A M J J A S O<br />
−.15<br />
O N D J F M A M J J A S O<br />
Month<br />
Month<br />
g<br />
NWT – Green Lake 4 – 1981–2008<br />
FRA – East Saint Louis – 1976–2005<br />
.10<br />
.04<br />
.05<br />
.03<br />
.02<br />
.00<br />
.01<br />
−.05<br />
.00<br />
−.01<br />
−.10<br />
−.02<br />
−.15<br />
O N D J F M A M J J A S O<br />
−.03<br />
O N D J F M A M J J A S O<br />
Month<br />
Month<br />
i LVW – Loch Vale out let – 1984–2010<br />
j<br />
CWT – WS18 – 1950–2009<br />
.10<br />
.015<br />
.001<br />
.05<br />
.005<br />
.00<br />
.000<br />
−.005<br />
−.05<br />
−.010<br />
−.10<br />
O N D J F M A M J J A S O<br />
−.015<br />
O N D J F M A M J J A S O<br />
Month<br />
Month<br />
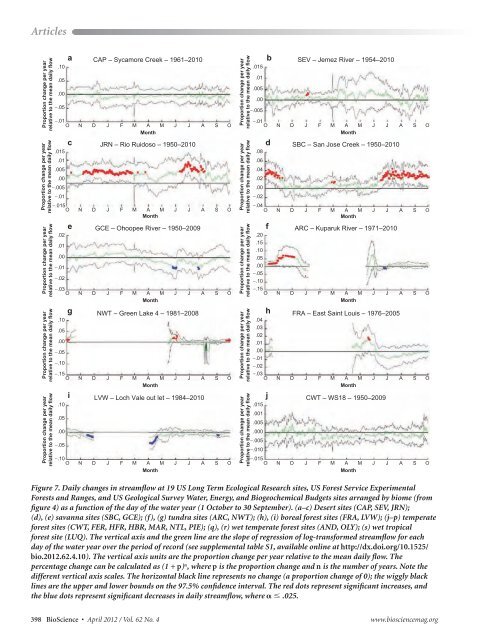
Figure 7. Daily changes in streamflow at 19 US Long Term Ecological Research sites, US Forest Service Experimental<br />
Forests and Ranges, and US Geological Survey Water, Energy, and Biogeochemical Budgets sites arranged by biome (from<br />
figure 4) as a function <strong>of</strong> the day <strong>of</strong> the water year (1 October to 30 September). (a–c) Desert sites (CAP, SEV, JRN);<br />
(d), (e) savanna sites (SBC, GCE); (f), (g) tundra sites (ARC, NWT); (h), (i) boreal forest sites (FRA, LVW); (j–p) temperate<br />
forest sites (CWT, FER, HFR, HBR, MAR, NTL, PIE); (q), (r) wet temperate forest sites (AND, OLY); (s) wet tropical<br />
forest site (LUQ). The vertical axis and the green line are the slope <strong>of</strong> regression <strong>of</strong> log-transformed streamflow for each<br />
day <strong>of</strong> the water year over the period <strong>of</strong> record (see supplemental table S1, available online at http://dx.doi.org/10.1525/<br />
bio.2012.62.4.10). The vertical axis units are the proportion change per year relative to the mean daily flow. The<br />
percentage change can be calculated as (1 + p) n , where p is the proportion change and n is the number <strong>of</strong> years. Note the<br />
different vertical axis scales. The horizontal black line represents no change (a proportion change <strong>of</strong> 0); the wiggly black<br />
lines are the upper and lower bounds on the 97.5% confidence interval. The red dots represent significant increases, and<br />
the blue dots represent significant decreases in daily streamflow, where a � .025.<br />
398 BioScience • April 2012 / Vol. 62 No. 4 www.biosciencemag.org<br />
Proportion change per year<br />
relative to the mean daily flow<br />
Proportion change per year<br />
relative to the mean daily flow<br />
Proportion change per year<br />
relative to the mean daily flow<br />
Proportion change per year<br />
relative to the mean daily flow<br />
Proportion change per year<br />
relative to the mean daily flow<br />
h