biology join - Coweeta LTER - University of Georgia
biology join - Coweeta LTER - University of Georgia
biology join - Coweeta LTER - University of Georgia

Create successful ePaper yourself
Turn your PDF publications into a flip-book with our unique Google optimized e-Paper software.
Articles<br />
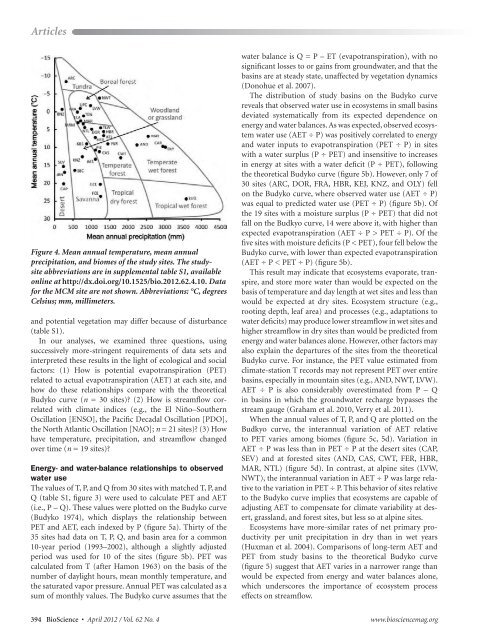
Figure 4. Mean annual temperature, mean annual<br />
precipitation, and biomes <strong>of</strong> the study sites. The studysite<br />
abbreviations are in supplemental table S1, available<br />
online at http://dx.doi.org/10.1525/bio.2012.62.4.10. Data<br />
for the MCM site are not shown. Abbreviations: °C, degrees<br />
Celsius; mm, millimeters.<br />
and potential vegetation may differ because <strong>of</strong> disturbance<br />
(table S1).<br />
In our analyses, we examined three questions, using<br />
successively more-stringent requirements <strong>of</strong> data sets and<br />
interpreted these results in the light <strong>of</strong> ecological and social<br />
factors: (1) How is potential evapotranspiration (PET)<br />
related to actual evapotranspiration (AET) at each site, and<br />
how do these relationships compare with the theoretical<br />
Budyko curve (n = 30 sites)? (2) How is streamflow correlated<br />
with climate indices (e.g., the El Niño–Southern<br />
Oscillation [ENSO], the Pacific Decadal Oscillation [PDO],<br />
the North Atlantic Oscillation [NAO]; n = 21 sites)? (3) How<br />
have temperature, precipitation, and streamflow changed<br />
over time (n = 19 sites)?<br />
Energy- and water-balance relationships to observed<br />
water use<br />
The values <strong>of</strong> T, P, and Q from 30 sites with matched T, P, and<br />
Q (table S1, figure 3) were used to calculate PET and AET<br />
(i.e., P – Q). These values were plotted on the Budyko curve<br />
(Budyko 1974), which displays the relationship between<br />
PET and AET, each indexed by P (figure 5a). Thirty <strong>of</strong> the<br />
35 sites had data on T, P, Q, and basin area for a common<br />
10-year period (1993–2002), although a slightly adjusted<br />
period was used for 10 <strong>of</strong> the sites (figure 5b). PET was<br />
calculated from T (after Hamon 1963) on the basis <strong>of</strong> the<br />
number <strong>of</strong> daylight hours, mean monthly temperature, and<br />
the saturated vapor pressure. Annual PET was calculated as a<br />
sum <strong>of</strong> monthly values. The Budyko curve assumes that the<br />
water balance is Q = P – ET (evapotranspiration), with no<br />
significant losses to or gains from groundwater, and that the<br />
basins are at steady state, unaffected by vegetation dynamics<br />
(Donohue et al. 2007).<br />
The distribution <strong>of</strong> study basins on the Budyko curve<br />
reveals that observed water use in ecosystems in small basins<br />
deviated systematically from its expected dependence on<br />
energy and water balances. As was expected, observed ecosystem<br />
water use (AET ÷ P) was positively correlated to energy<br />
and water inputs to evapotranspiration (PET ÷ P) in sites<br />
with a water surplus (P ÷ PET) and insensitive to increases<br />
in energy at sites with a water deficit (P ÷ PET), following<br />
the theoretical Budyko curve (figure 5b). However, only 7 <strong>of</strong><br />
30 sites (ARC, DOR, FRA, HBR, KEJ, KNZ, and OLY) fell<br />
on the Budyko curve, where observed water use (AET ÷ P)<br />
was equal to predicted water use (PET ÷ P) (fi gure 5b). Of<br />
the 19 sites with a moisture surplus (P ÷ PET) that did not<br />
fall on the Budkyo curve, 14 were above it, with higher than<br />
expected evapotranspiration (AET ÷ P > PET ÷ P). Of the<br />
five sites with moisture deficits (P < PET), four fell below the<br />
Budyko curve, with lower than expected evapotranspiration<br />
(AET ÷ P < PET ÷ P) (figure 5b).<br />
This result may indicate that ecosystems evaporate, transpire,<br />
and store more water than would be expected on the<br />
basis <strong>of</strong> temperature and day length at wet sites and less than<br />
would be expected at dry sites. Ecosystem structure (e.g.,<br />
rooting depth, leaf area) and processes (e.g., adaptations to<br />
water deficits) may produce lower streamflow in wet sites and<br />
higher streamflow in dry sites than would be predicted from<br />
energy and water balances alone. However, other factors may<br />
also explain the departures <strong>of</strong> the sites from the theoretical<br />
Budyko curve. For instance, the PET value estimated from<br />
climate-station T records may not represent PET over entire<br />
basins, especially in mountain sites (e.g., AND, NWT, LVW).<br />
AET ÷ P is also considerably overestimated from P – Q<br />
in basins in which the groundwater recharge bypasses the<br />
stream gauge (Graham et al. 2010, Verry et al. 2011).<br />
When the annual values <strong>of</strong> T, P, and Q are plotted on the<br />
Budkyo curve, the interannual variation <strong>of</strong> AET relative<br />
to PET varies among biomes (figure 5c, 5d). Variation in<br />
AET ÷ P was less than in PET ÷ P at the desert sites (CAP,<br />
SEV) and at forested sites (AND, CAS, CWT, FER, HBR,<br />
MAR, NTL) (figure 5d). In contrast, at alpine sites (LVW,<br />
NWT), the interannual variation in AET ÷ P was large relative<br />
to the variation in PET ÷ P. This behavior <strong>of</strong> sites relative<br />
to the Budyko curve implies that ecosystems are capable <strong>of</strong><br />
adjusting AET to compensate for climate variability at desert,<br />
grassland, and forest sites, but less so at alpine sites.<br />
Ecosystems have more-similar rates <strong>of</strong> net primary productivity<br />
per unit precipitation in dry than in wet years<br />
(Huxman et al. 2004). Comparisons <strong>of</strong> long-term AET and<br />
PET from study basins to the theoretical Budyko curve<br />
(figure 5) suggest that AET varies in a narrower range than<br />
would be expected from energy and water balances alone,<br />
which underscores the importance <strong>of</strong> ecosystem process<br />
effects on streamflow.<br />
394 BioScience • April 2012 / Vol. 62 No. 4 www.biosciencemag.org