biology join - Coweeta LTER - University of Georgia
biology join - Coweeta LTER - University of Georgia
biology join - Coweeta LTER - University of Georgia

You also want an ePaper? Increase the reach of your titles
YUMPU automatically turns print PDFs into web optimized ePapers that Google loves.
Proportion change per year<br />
relative to the mean daily flow<br />
Proportion change per year<br />
relative to the mean daily flow<br />
Proportion change per year<br />
relative to the mean daily flow<br />
Proportion change per year<br />
relative to the mean daily flow<br />
k<br />
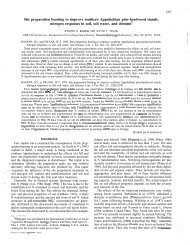
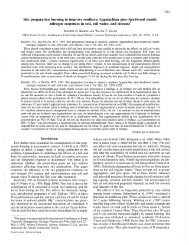
increased in the summer (figure 7k). Winter streamflow<br />
increased at three temperate forest sites in New England (HFR,<br />
HBR, PIE) and declined at one (NTL) (figure 7l, 7m, 7o, 7p).<br />
In addition, streamflow increased in March and decreased<br />
in April at HBR (figure 7m), and it increased in March and<br />
declined in summer at MAR (figure 7n). At wet temperate forest<br />
sites in Oregon (AND, OLY), streamflow declined in spring<br />
(figure 7q, 7r). Streamflow did not change at any time <strong>of</strong> year<br />
at a wet tropical forest site in Puerto Rico (LUQ) (figure 7s).<br />
PIE – Ipswich River – 1938–2010<br />
Articles<br />
.08<br />
FER – WS4 – 1952–2007<br />
.06<br />
HFR – Swift River – 1964–2010<br />
.06<br />
.04<br />
.04<br />
.02<br />
.02<br />
.00<br />
.00<br />
−.02<br />
−.02<br />
−.04<br />
−.04<br />
O N D J F M A M J J A S O<br />
−.06<br />
O N D J F M A M J J A S O<br />
Month<br />
Month<br />
m<br />
−.02<br />
O N D J F M A<br />
Month<br />
M J J A S O<br />
Social, ecological, and climate factors influencing<br />
streamflow trends<br />
Multiple social and ecological factors may explain the<br />
streamflow trends at long-term headwater basin sites, even<br />
though humans do not directly affect most <strong>of</strong> these sites<br />
( figure 2). Economic development, population growth, and<br />
the use <strong>of</strong> fossil-fuel resources have increased atmospheric<br />
carbon dioxide, warmed the Earth, contributed to more-<br />
intense precipitation events, and increased evapotranspiration<br />
www.biosciencemag.org April 2012 / Vol. 62 No. 4 • BioScience 399<br />
Proportion change per year<br />
relative to the mean daily flow<br />
Proportion change per year<br />
relative to the mean daily flow<br />
.02<br />
AND – WS2 – 1958–2009<br />
.03<br />
OLY – Hoko River near Sekiu – 1962–2009<br />
.01<br />
.02<br />
.00<br />
.01<br />
.00<br />
−.01<br />
−.01<br />
−.02<br />
−.02<br />
−.03<br />
O N D J F M A M J J A S O<br />
−.03<br />
O N D J F M A M J J A S O<br />
Month<br />
Month<br />
Proportion change per year<br />
relative to the mean daily flow<br />
.04<br />
.02<br />
.00<br />
−.02<br />
−.04<br />
Proportion change per year<br />
relative to the mean daily flow<br />
Proportion change per year<br />
relative to the mean daily flow<br />
.04<br />
HBR – WS3 – 1958–2007<br />
.10<br />
MAR – S2 – 1961–2009<br />
.03<br />
.05<br />
.02<br />
.01<br />
.00<br />
.00<br />
−.05<br />
−.01<br />
−.10<br />
−.02<br />
O N D J F M A M J J A S O<br />
−.15<br />
O N D J F M A M J J A S O<br />
Month<br />
Month<br />
.01<br />
.00<br />
−.01<br />
−.02<br />
−.03<br />
−.04<br />
−.05<br />
−.06<br />
o<br />
O N D J F M A M J J A S O<br />
Month<br />
Figure 7. (Continued)<br />
NTL – Trout River near Trout Lake – 1990–2010<br />
.03<br />
.02<br />
.01<br />
.00<br />
−.01<br />
q r<br />
s<br />
LUQ – Espiritu Santo – 1975–2009<br />
−.06<br />
O N D J F M A<br />
Month<br />
M J J A S O<br />
l<br />
n<br />
p