biology join - Coweeta LTER - University of Georgia
biology join - Coweeta LTER - University of Georgia
biology join - Coweeta LTER - University of Georgia

Create successful ePaper yourself
Turn your PDF publications into a flip-book with our unique Google optimized e-Paper software.
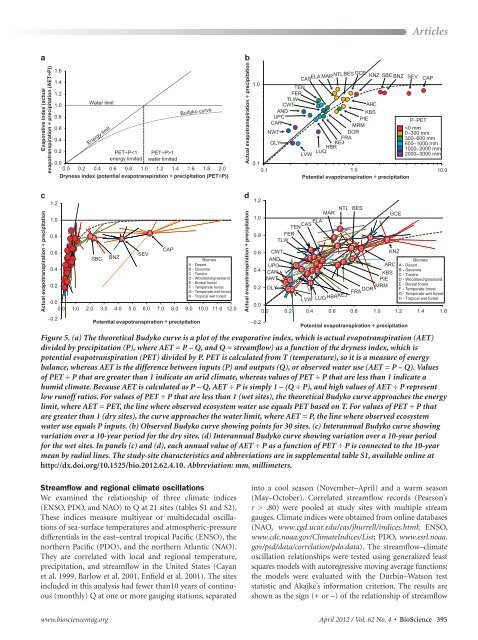
a<br />
Evaporative index (actual<br />
evapotranspiration ÷ precipitation (AET÷P))<br />
c<br />
Actual evapotranspiration ÷ precipitation<br />
1.6<br />
1.4<br />
1.2<br />
1.0<br />
0.8<br />
0.6<br />
0.4<br />
Water limit<br />
Energy limit<br />
Budyko curve<br />
0.2<br />
PET÷P1<br />
0.0<br />
energy limited water limited<br />
0.0 0.2 0.4 0.6 0.8 1.0 1.2 1.4 1.6 1.8 2.0<br />
Dryness index (potential evapotranspiration ÷ precipitation (PET÷P))<br />
1.2<br />
1.0<br />
0.8<br />
0.6<br />
0.4<br />
0.2<br />
−0.2<br />
BA<br />
SBC<br />
BNZ<br />
A<br />
SEV<br />
CAP<br />
0.0<br />
0.0 1.0 2.0 3.0 4.0 5.0 6.0 7.0 8.0 9.0 10.0 11.0 12.0<br />
Potential evapotranspiration ÷ precipitation<br />
Streamflow and regional climate oscillations<br />
We examined the relationship <strong>of</strong> three climate indices<br />
(ENSO, PDO, and NAO) to Q at 21 sites (tables S1 and S2).<br />
These indices measure multiyear or multidecadal oscillations<br />
<strong>of</strong> sea-surface temperatures and atmospheric-pressure<br />
differentials in the east–central tropical Pacific (ENSO), the<br />
northern Pacific (PDO), and the northern Atlantic (NAO).<br />
They are correlated with local and regional temperature,<br />
precipitation, and streamflow in the United States (Cayan<br />
et al. 1999, Barlow et al. 2001, Enfield et al. 2001). The sites<br />
included in this analysis had fewer than10 years <strong>of</strong> continuous<br />
(monthly) Q at one or more gauging stations, separated<br />
A<br />
Actual evapotranspiration ÷ precipitation<br />
Actual evapotranspiration ÷ precipitation<br />
ELA MARNTLBES<br />
GCE<br />
CAS<br />
TEN<br />
FER<br />
TLW<br />
CWT<br />
ARC<br />
AND<br />
UPC<br />
CAR<br />
KBS<br />
PIE<br />
MRM<br />
NWT<br />
DOR<br />
FRA<br />
OLY<br />
LVW<br />
KEJ<br />
HBR<br />
LUQ<br />
KNZ SBC BNZ<br />
Articles<br />
into a cool season (November–April) and a warm season<br />
(May–October). Correlated streamflow records (Pearson’s<br />
r > .80) were pooled at study sites with multiple stream<br />
gauges. Climate indices were obtained from online databases<br />
(NAO, www.cgd.ucar.edu/cas/jhurrell/indices.html; ENSO,<br />
www.cdc.noaa.gov/ClimateIndices/List; PDO, www.esrl.noaa.<br />
gov/psd/data/correlation/pdo.data). The streamflow–climate<br />
oscillation relationships were tested using generalized least<br />
squares models with autoregressive moving average functions;<br />
the models were evaluated with the Durbin–Watson test<br />
statistic and Akaike’s information criterion. The results are<br />
shown as the sign (+ or –) <strong>of</strong> the relationship <strong>of</strong> streamflow<br />
www.biosciencemag.org April 2012 / Vol. 62 No. 4 • BioScience 395<br />
b<br />
d<br />
1.0<br />
SEV<br />
P−PET<br />
CAP<br />