biology join - Coweeta LTER - University of Georgia
biology join - Coweeta LTER - University of Georgia
biology join - Coweeta LTER - University of Georgia

Create successful ePaper yourself
Turn your PDF publications into a flip-book with our unique Google optimized e-Paper software.
Annual precipitation (mm)<br />
4000<br />
3500<br />
3000<br />
2500<br />
2000<br />
1500<br />
1000<br />
500<br />
a<br />
0<br />
−15.0 −10.0 −5.0 0.0 5.0 10.0 15.0 20.0 25.0<br />
Minimum daily temperature (°C)<br />
1950 est<br />
1960 est<br />
1970 est<br />
1980 est<br />
1990 est<br />
2010 est<br />
(NTL, for which the record began in 1990). Mean annual<br />
precipitation increased significantly at LUQ and NWT. The<br />
first day <strong>of</strong> spring (defined as the last day <strong>of</strong> freezing temperature)<br />
moved earlier by between 0.31 and 1.98 days per<br />
year—that is, by more than 15 days in 50 years—at eight<br />
sites (AND, ARC, CWT, FER, FRA, HBR, LUQ, MAR, NWT)<br />
(Hatcher 2011).<br />
Run<strong>of</strong>f ratios (Q:P) changed at 8 <strong>of</strong> 19 sites (figure 6b).<br />
Tundra and boreal forest sites with ice and permafrost (LVW,<br />
NWT) experienced increases in run<strong>of</strong>f ratios, and so did<br />
temperate deciduous forest sites in the northeastern United<br />
States (HBR, HFR, PIE), which have a seasonal snowpack. An<br />
increase in run<strong>of</strong>f ratio means either that AET has decreased,<br />
or that there is a net addition <strong>of</strong> water to the system, such as<br />
from melting ice or interbasin water transfers. The observed<br />
increases in run<strong>of</strong>f ratios at LVW and NWT may be associated<br />
with the melt <strong>of</strong> ice, snow, and permafrost in response<br />
to warming temperatures during seasons in which these<br />
ecosystems are dormant (not taking up water). However,<br />
warming did not result in increased run<strong>of</strong>f ratios at other<br />
sites with permafrost (ARC, which has a short record) or<br />
seasonal snowpacks (e.g., AND, FRA, MAR, NTL). Run<strong>of</strong>f<br />
Articles<br />
1950 est<br />
1960 est<br />
1970 est<br />
1980 est<br />
1990 est<br />
2010 est<br />
.1<br />
0<br />
A CAP<br />
−10.0 −5.0 0.0 5.0 10.0 15.0 20.0 25.0 30.0 35.0<br />
ratios did not change at most other sites, which mostly lack<br />
significant snow and ice (Hatcher 2011).<br />
Streamflow changes vary according to the season and differ<br />
among various biomes (figure 7). At undisturbed desert<br />
sites in Arizona (CAP) and New Mexico (SEV), streamflow<br />
did not change at any time <strong>of</strong> year (figure 7a, 7b). However,<br />
in a desert mountain basin northeast <strong>of</strong> JRN (New Mexico)<br />
and in a semiarid mountain basin near SBC (southern<br />
California) containing residential and urban development,<br />
streamflow increased during low-flow periods (figure 7c,<br />
7d). In a large basin in coastal <strong>Georgia</strong> containing agriculture<br />
and forest plantations (GCE), streamflow declined in<br />
early and late summer (figure 7e).<br />
At tundra sites on the North Slope <strong>of</strong> Alaska and in the<br />
Rocky Mountains (ARC, NWT; figure 7f, 7g), streamflow<br />
increased in early spring and late fall, during time periods<br />
adjacent to freezing periods. Streamflow increased in spring<br />
at boreal forest sites in the Rocky Mountains (FRA, LVW;<br />
figure 7h, 7i). At a temperate forest site in western North<br />
Carolina (CWT), where seasonal snowpacks do not form,<br />
streamflow did not change at any time <strong>of</strong> year (figure 7j), but<br />
at a temperate forest site in West Virginia (FER), streamflow<br />
www.biosciencemag.org April 2012 / Vol. 62 No. 4 • BioScience 397<br />
Run<strong>of</strong>f ratio (discharge:precipitation)<br />
1<br />
.9<br />
.8<br />
.7<br />
.6<br />
.5<br />
.4<br />
.3<br />
.2<br />
b<br />
Maximum daily temperature (°C)<br />
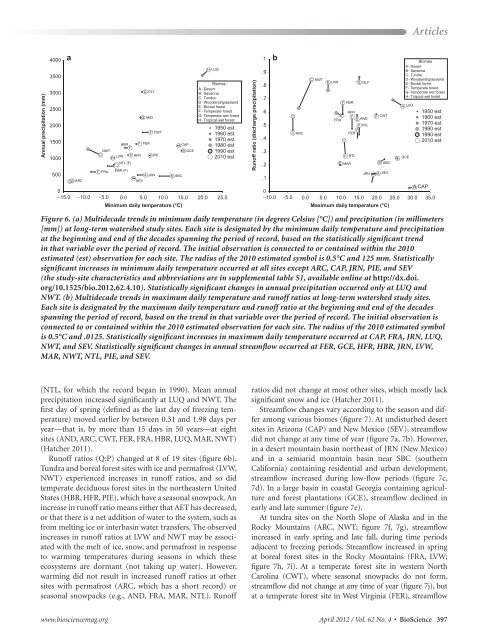
Figure 6. (a) Multidecade trends in minimum daily temperature (in degrees Celsius [°C]) and precipitation (in millimeters<br />
[mm]) at long-term watershed study sites. Each site is designated by the minimum daily temperature and precipitation<br />
at the beginning and end <strong>of</strong> the decades spanning the period <strong>of</strong> record, based on the statistically significant trend<br />
in that variable over the period <strong>of</strong> record. The initial observation is connected to or contained within the 2010<br />
estimated (est) observation for each site. The radius <strong>of</strong> the 2010 estimated symbol is 0.5°C and 125 mm. Statistically<br />
significant increases in minimum daily temperature occurred at all sites except ARC, CAP, JRN, PIE, and SEV<br />
(the study-site characteristics and abbreviations are in supplemental table S1, available online at http://dx.doi.<br />
org/10.1525/bio.2012.62.4.10). Statistically significant changes in annual precipitation occurred only at LUQ and<br />
NWT. (b) Multidecade trends in maximum daily temperature and run<strong>of</strong>f ratios at long-term watershed study sites.<br />
Each site is designated by the maximum daily temperature and run<strong>of</strong>f ratio at the beginning and end <strong>of</strong> the decades<br />
spanning the period <strong>of</strong> record, based on the trend in that variable over the period <strong>of</strong> record. The initial observation is<br />
connected to or contained within the 2010 estimated observation for each site. The radius <strong>of</strong> the 2010 estimated symbol<br />
is 0.5°C and .0125. Statistically significant increases in maximum daily temperature occurred at CAP, FRA, JRN, LUQ,<br />
NWT, and SEV. Statistically significant changes in annual streamflow occurred at FER, GCE, HFR, HBR, JRN, LVW,<br />
MAR, NWT, NTL, PIE, and SEV.