Beeline AR 2005 - VimpelCom
Beeline AR 2005 - VimpelCom
Beeline AR 2005 - VimpelCom

Create successful ePaper yourself
Turn your PDF publications into a flip-book with our unique Google optimized e-Paper software.
Management’s Discussion and Analysis of Financial Condition<br />
72 and Results of Operations<br />
<strong>VimpelCom</strong><br />
Management’s Discussion and Analysis of Financial Condition<br />
ВымпелКом<br />
Annual Report <strong>2005</strong> and Results of Operations<br />
Годовой отчет <strong>2005</strong> 73<br />
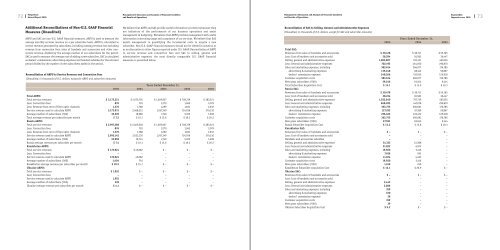
Additional Reconciliations of Non-U.S. GAAP Financial<br />
Measures (Unaudited)<br />
<strong>AR</strong>PU and SAC are non-U.S. GAAP financial measures. <strong>AR</strong>PU is used to measure the<br />
average monthly services revenue on a per subscriber basis. <strong>AR</strong>PU is calculated as<br />
service revenue generated by subscribers, including roaming revenue, but excluding<br />
revenue from connection fees, sales of handsets and accessories and other nonservice<br />
revenue, divided by the average number of our subscribers for the period.<br />
SAC is used to measure the average cost of adding a new subscriber. SAC is calculated<br />
as dealers’ commissions, advertising expenses and handset subsidies for the relevant<br />
period divided by the number of new subscribers added in the period.<br />
Reconciliation of <strong>AR</strong>PU to Service Revenue and Connection Fees<br />
(Unaudited, in thousands of U.S. dollars, except for <strong>AR</strong>PU and subscriber amounts)<br />
We believe that <strong>AR</strong>PU and SAC provide useful information to investors because they<br />
are indicators of the performance of our business operations and assist<br />
management in budgeting. We believe that <strong>AR</strong>PU provides management with useful<br />
information concerning usage and acceptance of our services. We believe that SAC<br />
assists management in quantifying the incremental costs to acquire a new<br />
subscriber. Non-U.S. GAAP financial measures should not be viewed in isolation or<br />
as an alternative to other figures reported under U.S. GAAP. Reconciliation of <strong>AR</strong>PU<br />
to service revenue and connection fees and SAC to selling, general and<br />
administrative expenses, the most directly comparable U.S. GAAP financial<br />
measures, is presented below.<br />
Years Ended December 31,<br />
<strong>2005</strong> 2004 2003 2002 2001<br />
Total <strong>AR</strong>PU:<br />
Total service revenues $ 3,175,221 $ 2,070,720 $ 1,269,927 $ 728,729 $ 383,321<br />
Less: Connection fees 876 720 1,279 1,962 2,079<br />
Less: Revenue from rent of fiber optic channels 1,370 1,788 1,299 1,831 2,032<br />
Service revenue used to calculate <strong>AR</strong>PU 3,172,975 2,068,212 1,267,349 724,936 379,210<br />
Average number of subscribers (‘000) 35,393 16,986 7,749 3,305 1,208<br />
Total average revenue per subscriber per month $ 7.5 $ 10.1 $ 13.6 $ 18.3 $ 26.2<br />
Russia <strong>AR</strong>PU:<br />
Total service revenues $ 2,997,388 $ 2,025,638 $ 1,269,927 $ 728,729 $ 383,321<br />
Less: Connection fees 876 720 1,279 1,962 2,079<br />
Less: Revenue from rent of fiber optic channels 1,370 1,788 1,299 1,831 2,032<br />
Service revenue used to calculate <strong>AR</strong>PU 2,995,142 2,023,130 1,267,349 724,936 379,210<br />
Average number of subscribers (‘000) 33,958 16,734 7,749 3,305 1,208<br />
Russia average revenue per subscriber per month $ 7.4 $ 10.1 $ 13.6 $ 18.3 $ 26.2<br />
Kazakhstan <strong>AR</strong>PU:<br />
Total service revenues $ 176,924 $ 45,082 $ – $ – $ –<br />
Less: Connection fees – – – – –<br />
Service revenue used to calculate <strong>AR</strong>PU 176,924 45,082 – – –<br />
Average number of subscribers (‘000) 1,404 716 – – –<br />
Kazakhstan average revenue per subscriber per month $ 10.5 $ 15.7 $ – $ – $ –<br />
Ukraine <strong>AR</strong>PU:<br />
Total service revenues $ 1,952 $ – $ – $ – $ –<br />
Less: Connection fees – – – – –<br />
Service revenue used to calculate <strong>AR</strong>PU 1,952 – – – –<br />
Average number of subscribers (‘000) 239 – – – –<br />
Ukraine average revenue per subscriber per month $ 4.1 $ – $ – $ – $ –<br />
Reconciliation of SAC to Selling, General and Administrative Expenses<br />
(Unaudited, in thousands of U.S. dollars, except for SAC and subscriber amounts)<br />
Years Ended December 31,<br />
<strong>2005</strong> 2004 2003<br />
Total SAC:<br />
Revenues from sales of handsets and accessories $ 30,478 $ 38,711 $ 55,765<br />
Less: Cost of handsets and accessories sold 28,294 30,583 36,447<br />
Selling, general and administrative expenses 1,085,807 720,127 467,655<br />
Less: General and administrative expenses 702,193 454,050 290,870<br />
Sales and marketing expenses, including 383,614 266,077 176,785<br />
advertising & marketing expenses 135,248 68,142 50,867<br />
dealers’ commission expense 248,366 197,935 125,918<br />
Customer acquisition costs 383,614 266,077 176,785<br />
New gross subscribers (‘000) 29,246 19,204 9,144<br />
Total Subscriber Acquisition Cost $ 13.1 $ 13.9 $ 19.3<br />
Russia SAC:<br />
Revenues from sales of handsets and accessories $ 30,478 $ 38,711 $ 55,765<br />
Less: Cost of handsets and accessories sold 28,234 30,583 36,447<br />
Selling, general and administrative expenses 1,032,040 707,739 467,655<br />
Less: General and administrative expenses 668,285 447,078 290,870<br />
Sales and marketing expenses, including 363,755 260,661 176,785<br />
advertising & marketing expenses 127,292 67,189 50,867<br />
dealers’ commission expense 236,463 193,472 125,918<br />
Customer acquisition costs 363,755 260,661 176,785<br />
New gross subscribers (‘000) 27,591 18,945 9,144<br />
Russia Subscriber Acquisition Cost $ 13.2 $ 13.8 $ 19.3<br />
Kazakhstan SAC:<br />
Revenues from sales of handsets and accessories $ – $ – $ –<br />
Less: Cost of handsets and accessories sold – – –<br />
Handsets and accessories subsidies – – –<br />
Selling, general and administrative expenses 51,322 12,388 –<br />
Less: General and administrative expenses 31,822 6,972 –<br />
Sales and marketing expenses, including 19,500 5,416 –<br />
advertising & marketing expenses 7,626 953 –<br />
dealers’ commission expense 11,874 4,463 –<br />
Customer acquisition costs 19,500 5,416 –<br />
New gross subscribers (‘000) 1,616 259 –<br />
Kazakhstan Subscriber Acquisition Cost $ 12.1 $ 20.9 $ –<br />
Ukraine SAC:<br />
Revenues from sales of handsets and accessories $ – $ – $ –<br />
Less: Cost of handsets and accessories sold – – –<br />
Selling, general and administrative expenses 2,445 – –<br />
Less: General and administrative expenses 2,086 – –<br />
Sales and marketing expenses, including 359 – –<br />
advertising & marketing expenses 330 – –<br />
dealers’ commission expense 29 – –<br />
Customer acquisition costs 359 – –<br />
New gross subscribers (‘000) 39 – –<br />
Ukraine Subscriber Acquisition Cost $ 9.2 $ – $ –