Beeline AR 2005 - VimpelCom
Beeline AR 2005 - VimpelCom
Beeline AR 2005 - VimpelCom

You also want an ePaper? Increase the reach of your titles
YUMPU automatically turns print PDFs into web optimized ePapers that Google loves.
Notes to Consolidated Financial Statements<br />
100 <strong>VimpelCom</strong><br />
Notes to Consolidated Financial Statements<br />
ВымпелКом<br />
Annual Report <strong>2005</strong> Годовой отчет <strong>2005</strong> 101<br />
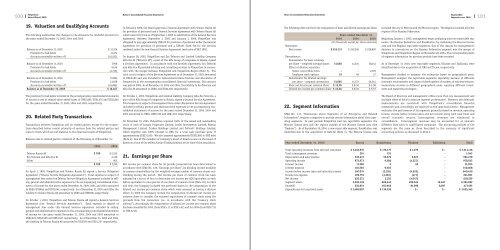
19. Valuation and Qualifying Accounts<br />
The following summarizes the changes in the allowance for doubtful accounts for<br />
the years ended December 31, <strong>2005</strong>, 2004 and 2003:<br />
Balance as of December 31, 2002 $ 12,916<br />
Provision for bad debts 11,074<br />
Accounts receivable written off (16,032)<br />
Balance as of December 31, 2003 7,958<br />
Provision for bad debts 9,636<br />
Accounts receivable written off (4,710)<br />
Balance as of December 31, 2004 12,884<br />
Provision for bad debts 13,668<br />
Accounts receivable written off (10,085)<br />
Balance as of December 31, <strong>2005</strong> $ 16,467<br />
The provision for bad debts included in the accompanying consolidated statements<br />
of income is net of related value-added taxes of US$2,085, US$1,470 and US$1,846<br />
for the years ended December 31, <strong>2005</strong>, 2004 and 2003, respectively.<br />
20. Related Party Transactions<br />
Transactions between <strong>VimpelCom</strong> and its related parties, except for the transactions<br />
described below, consist primarily of services from the related parties and<br />
loans to them, which are not material to the financial results of <strong>VimpelCom</strong>.<br />
Balances due to related parties consisted of the following as of December 31:<br />
<strong>2005</strong> 2004<br />
Telenor Russia AS $709 $ 2,255<br />
Eco Telecom and Alfa-Eco M - 4,130<br />
Other - 905<br />
$ 709 $ 7,290<br />
On April 1, 1999, <strong>VimpelCom</strong> and Telenor Russia AS signed a Service Obligation<br />
Agreement (“Telenor Service Obligation Agreement”). Total expense in respect of<br />
management fees under the Telenor Service Obligation Agreement included in selling,<br />
general and administrative expenses in the accompanying consolidated statements<br />
of income for the years ended December 31, <strong>2005</strong>, 2004 and 2003 amounted<br />
to US$0, US$966 and US$1,041, respectively. As of December 31, <strong>2005</strong> and 2004, the<br />
liability to Telenor Russia AS amounted to US$0 and US$918, respectively.<br />
On October 1, 2003, <strong>VimpelCom</strong> and Telenor Russia AS signed a General Services<br />
Agreement (the “General Services Agreement”). Total expense in respect of<br />
management fees under this General Services Agreement included in selling,<br />
general and administrative expenses in the accompanying consolidated statements<br />
of income for the years ended December 31, <strong>2005</strong>, 2004 and 2003 amounted to<br />
US$2,625, US$3,500 and US$1,167, respectively. As of December 31, <strong>2005</strong> and 2004,<br />
the liability to Telenor Russia AS amounted to US$709 and US$1,337 respectively.<br />
In February 2006, the Board approved a General Agreement with Telenor Russia AS<br />
for provision of personnel and a General Services Agreement with Telenor Russia AS<br />
which came into force as of September 1, <strong>2005</strong> in substitution of the General Services<br />
Agreement. Between September 1, <strong>2005</strong> and January 1, 2006, <strong>VimpelCom</strong> was<br />
obligated to pay approximately US$472 for provision of personnel under the General<br />
Agreement for provision of personnel and a US$167 fixed fee for the services<br />
rendered under the new General Services Agreement (exclusive of VAT 18%).<br />
On August 28, 2003, <strong>VimpelCom</strong> and Eco Telecom and Limited Liability Company<br />
Alfa-Eco M (“Alfa-Eco M”), a part of the Alfa Group of companies in Russia, signed<br />
a Services Agreement. In accordance with the Services Agreement, Eco Telecom<br />
and Alfa-Eco M provided advising and consulting services to <strong>VimpelCom</strong> in connection<br />
with the merger between <strong>VimpelCom</strong> and <strong>VimpelCom</strong>-Region (Note 5). The<br />
total cost in respect of the Services Agreement as of December 31, 2003 amounted<br />
to US$3,500 and was included in telecommunications licenses and allocations of<br />
frequencies in the accompanying consolidated financial statements. This amount<br />
was paid in <strong>2005</strong>. As of December 31, <strong>2005</strong> and 2004, the liability to Eco Telecom and<br />
Alfa-Eco M amounted to US$0, and US$4,130, respectively.<br />
On October 1, 2003, <strong>VimpelCom</strong> and Limited Liability Company Alfa-Eco Telecom, a<br />
part of the Alfa Group of companies in Russia, signed a General Service Agreement.<br />
Total expense in respect of management fees under this General Service Agreement<br />
included in selling, general and administrative expenses in the accompanying consolidated<br />
statements of income for the years ended December 31, <strong>2005</strong>, 2004 and<br />
2003 amounted to US$0, US$2,333 and US$1,167, respectively.<br />
On November 10, <strong>2005</strong>, <strong>VimpelCom</strong> acquired 100% of the issued and outstanding<br />
stock of each of Crayola Properties Limited, Cradel Investments Limited, Wintop<br />
Management Limited, Crisden Holdings Limited and Cellcroft Holdings Limited,<br />
which together own 100% interest in URS, for a total cash purchase price of<br />
approximately US$231,200. We also assumed approximately US$22,800 in URS debt<br />
(Note 4). One of the members of Company’s board of directors was on the board of<br />
directors of one of the sellers, Karino Trading Limited, at the time of the acquisition.<br />
21. Earnings per Share<br />
Net income per common share for all periods presented has been determined in<br />
accordance with SFAS No. 128, “Earnings per Share”, by dividing income available<br />
to common shareholders by the weighted-average number of common shares outstanding<br />
during the period. Net income per share of common stock has been<br />
adjusted by a factor of four to determine net income per ADS equivalent as each<br />
ADS is equivalent to one-quarter of one share of common stock (Note 16). In 2003<br />
and 2004 the Company included the preferred shares in the computation of the<br />
diluted net income per common share which were assessed as having a dilutive<br />
effect. In <strong>2005</strong> the Company revised the computation of diluted net income per<br />
common share to consider the assumed repurchases of common stock using the<br />
proceeds from the conversion (i.e. in accordance with the “treasury stock<br />
method”). Accordingly the computation of diluted net income per common share<br />
has been amended for 2003 (from US$ 5.11 to US$ 5.67) and for 2004 (from US$ 7.35<br />
to US$ 8.49).<br />
The following table sets forth the computation of basic and diluted earnings per share:<br />
Years ended December 31,<br />
<strong>2005</strong> 2004 2003<br />
(In thousands, except per share amounts)<br />
Numerator:<br />
Net income $615,131 $ 350,396 $ 228,809<br />
Denominator:<br />
Denominator for basic earnings<br />
per share – weighted average shares 51,066 41,224 38,241<br />
Effect of dilutive securities:<br />
Senior convertible notes – – 2,076<br />
Employee stock options 19 48 27<br />
Denominator for diluted earnings<br />
per share – assumed conversions 51,085 41,272 40,344<br />
Basic net income per common share $ 12.05 $ 8.50 $ 5.98<br />
Diluted net income per common share $ 12.04 $ 8.49 $ 5.67<br />
22. Segment Information<br />
SFAS No. 131, “Disclosures about Segments of an Enterprise and Related<br />
Information”, requires companies to provide certain information about their operating<br />
segments. In past periods <strong>VimpelCom</strong> had two reportable segments: the<br />
Moscow license area and the regions outside of the Moscow license area (the<br />
“Regions”). As of September 30, 2004, a new reportable segment, Kazakhstan, was<br />
identified due to the acquisition of KaR-Tel (Note 4). The Moscow license area<br />
included the city of Moscow and the Moscow region. The Regions included all other<br />
regions of the Russian Federation.<br />
Beginning January 1, <strong>2005</strong>, management began analyzing only two reportable segments,<br />
the Russian Federation and Kazakhstan, by combining the Moscow license<br />
area and the Regions reportable segments. One of the reasons for management’s<br />
decision to concentrate on the Russian Federation segment was the merger of<br />
<strong>VimpelCom</strong> and <strong>VimpelCom</strong>-Region on November 26, 2004. The corresponding items<br />
of segment information for previous periods have been restated.<br />
As of December 31, <strong>2005</strong>, new reportable segments, Ukraine and Tajikistan, were<br />
identified due to the acquisition of URS and Tacom, respectively.<br />
Management decided to organize the enterprise based on geographical areas.<br />
Management analyzes the reportable segments separately because of different<br />
economic environments and stages of development of markets of wireless telecommunications<br />
services in different geographical areas, requiring different investment<br />
and marketing strategies.<br />
The Board of Directors and management utilize more than one measurement and<br />
multiple views of data to measure segment performance. However, the dominant<br />
measurements are consistent with <strong>VimpelCom</strong>’s consolidated financial<br />
statements and, accordingly, are reported on the same basis herein. Management<br />
evaluates the performance of its segments primarily based on revenue, operating<br />
income, income before income taxes and net income along with cash flows and<br />
overall economic returns. Intersegment revenues are eliminated in<br />
consolidation. Intersegment revenues may be accounted for at amounts<br />
different from sales to unaffiliated companies. The accounting policies of the<br />
segments are the same as those described in the summary of significant<br />
accounting policies, as discussed in Note 2.<br />
Year ended December 31, <strong>2005</strong>: Russia Kazakhstan Ukraine Tajikistan Total<br />
Total operating revenues from external customers $ 3,032,976 $ 176,172 $ 1,970 $ - $ 3,211,118<br />
Total intersegment revenues 291 752 - - 1,043<br />
Depreciation and amortization 535,372 55,079 2,827 - 593,278<br />
Operating income 972,673 9,586 (4,227) - 978,032<br />
Interest income 11,260 5 40 - 11,305<br />
Interest expense 140,565 9,503 - - 150,068<br />
Income before income taxes and minority interest 847,074 (2,126) (4,518) - 840,430<br />
Income tax expense 226,753 (4,381) (471) - 221,901<br />
Net income 620,321 2,255 (4,047) - 618,529<br />
Segment assets 5,383,139 668,443 296,643 16,467 6,364,692<br />
Goodwill 230,851 155,948 81,999 8,697 477,495<br />
Expenditures for long-lived assets $ 1,498,807 $ 136,538 $ - $ - $ 1,635,345