Beeline AR 2005 - VimpelCom
Beeline AR 2005 - VimpelCom
Beeline AR 2005 - VimpelCom

Create successful ePaper yourself
Turn your PDF publications into a flip-book with our unique Google optimized e-Paper software.
Notes to Consolidated Financial Statements<br />
102 <strong>VimpelCom</strong><br />
Notes to Consolidated Financial Statements<br />
ВымпелКом<br />
Annual Report <strong>2005</strong> Годовой отчет <strong>2005</strong> 103<br />
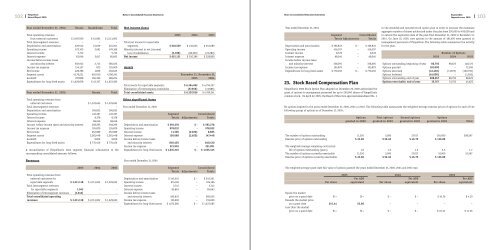
Year ended December 31, 2004: Russia Kazakhstan Total<br />
Total operating revenues<br />
from external customers $ 2,067,920 $ 45,082 $ 2,113,002<br />
Total intersegment revenues – – –<br />
Depreciation and amortization 329,542 15,659 345,201<br />
Operating income 672,105 2,061 674,166<br />
Interest income 5,712 – 5,712<br />
Interest expense 83,046 2,617 85,663<br />
Income before income taxes<br />
and minority interest 582,912 2,713 585,625<br />
Income tax expense 154,127 873 155,000<br />
Net income 428,786 1,839 430,625<br />
Segment assets 4,178,221 602,020 4,780,241<br />
Goodwill 207,808 160,396 368,204<br />
Expenditures for long-lived assets $ 1,629,878 $ 42,707 $ 1,672,585<br />
Year ended December 31, 2003: Russia Total<br />
Total operating revenues from<br />
external customers $ 1,329,653 $ 1,329,653<br />
Total intersegment revenues – –<br />
Depreciation and amortization 196,833 196,833<br />
Operating income 416,397 416,397<br />
Interest income 8,378 8,378<br />
Interest expense 68,246 68,246<br />
Income before income taxes and minority interest 358,295 358,295<br />
Income tax expense 105,879 105,879<br />
Net income 252,089 252,089<br />
Segment assets 2,281,448 2,281,448<br />
Goodwill 9,816 9,816<br />
Expenditures for long-lived assets $ 770,456 $ 770,456<br />
A reconciliation of <strong>VimpelCom</strong>’s total segment financial information to the<br />
corresponding consolidated amounts follows:<br />
Revenues<br />
<strong>2005</strong> 2004 2003<br />
Total operating revenues from<br />
external customers for<br />
reportable segments $ 3,211,118 $ 2,113,002 $ 1,329,653<br />
Total intersegment revenues<br />
for reportable segments 1,043 - -<br />
Elimination of intersegment revenues (1,043) - -<br />
Total consolidated operating<br />
revenues $ 3,211,118 $ 2,113,002 $ 1,329,653<br />
Net income (loss)<br />
<strong>2005</strong> 2004 2003<br />
Total net income for reportable<br />
segments $ 618,529 $ 430,625 $ 252,089<br />
Minority interest in net (income)<br />
loss of subsidiaries (3,398) (80,229) (23,280)<br />
Net income $ 615,131 $ 350,396 $ 228,809<br />
Assets<br />
December 31, December 31,<br />
<strong>2005</strong> 2004<br />
Total assets for reportable segments $ 6,364,692 $ 4,794,227<br />
Elimination of intercompany receivables (57,656) (13,986)<br />
Total consolidated assets $ 6,307,036 $ 4,780,241<br />
Other significant items<br />
Year ended December 31, <strong>2005</strong><br />
Segment Consolidated<br />
Totals Adjustments Totals<br />
Depreciation and amortization $593,278 $- $593,278<br />
Operating income 978,032 - 978,032<br />
Interest income 11,305 (2,620) 8,685<br />
Interest expense 150,068 (2,620) 147,448<br />
Income before income taxes<br />
and minority interest 840,430 - 840,430<br />
Income tax expense 221,901 - 221,901<br />
Expenditures for long-lived assets $ 1,635,345 $ - $ 1,635,345<br />
Year ended December 31, 2004<br />
Segment Consolidated<br />
Totals Adjustments Totals<br />
Depreciation and amortization $ 345,201 $ – $ 345,201<br />
Operating income 674,166 – 674,166<br />
Interest income 5,712 – 5,712<br />
Interest expense 85,663 – 85,663<br />
Income before income taxes<br />
and minority interest 585,625 – 585,625<br />
Income tax expense 155,000 – 155,000<br />
Expenditures for long-lived assets $ 1,672,585 $ – $ 1,672,585<br />
Year ended December 31, 2003<br />
Segment Consolidated<br />
Totals Adjustments Totals<br />
Depreciation and amortization $ 196,833 $ – $ 196,833<br />
Operating income 416,397 – 416,397<br />
Interest income 8,378 – 8,378<br />
Interest expense 68,246 – 68,246<br />
Income before income taxes<br />
and minority interest 358,295 – 358,295<br />
Income tax expense 105,879 – 105,879<br />
Expenditures for long-lived assets $ 770,456 $ – $ 770,456<br />
23. Stock Based Compensation Plan<br />
<strong>VimpelCom</strong>’s 2000 Stock Option Plan adopted on December 20, 2000 authorized the<br />
grant of options to management personnel for up to 250,000 shares of <strong>VimpelCom</strong>’s<br />
common stock. On April 22, <strong>2005</strong>, the Board of Directors approved Amendment No. 1<br />
to the amended and restated stock option plan in order to increase the maximum<br />
aggregate number of shares authorized under the plan from 250,000 to 450,000 and<br />
to extend the expiration date of the plan from December 31, 2006 to December 31,<br />
2015. On June 22, <strong>2005</strong>, new options in the amount of 181,000 were granted to<br />
management personnel of <strong>VimpelCom</strong>. The following table summarizes the activity<br />
for the plan.<br />
Number of Options<br />
<strong>2005</strong> 2004 2003<br />
Options outstanding, beginning of year 86,750 98,625 148,375<br />
Options granted 181,000 – 72,500<br />
Options exercised (43,483) (11,875) (120,750)<br />
Options forfeited (16,000) – (1,500)<br />
Options outstanding, end of year 208,267 86,750 98,625<br />
Options exercisable, end of year 35,767 51,750 44,625<br />
No options expired in the years ended December 31, <strong>2005</strong>, 2004 or 2003. The following table summarizes the weighted-average exercise prices of options for each of the<br />
following groups of options as of December 31, <strong>2005</strong>:<br />
Options First options Second options Options<br />
granted in 2000 granted in 2003 granted in 2003 granted in <strong>2005</strong> Total<br />
The number of options outstanding 11,250 5,000 27,017 165,000 208,267<br />
Exercise price of options outstanding $ 23.60 $ 52.40 $ 46.70 $ 136.89<br />
The weighted-average remaining contractual<br />
life of options outstanding (years) 1.0 1.0 1.0 3.5 1.7<br />
The number of options currently exercisable 11,250 5,000 27,017 10,000 53,267<br />
Exercise price of options currently exercisable $ 23.60 $ 52.40 $ 46.70 $ 136.89<br />
The weighted average grant-date fair value of options granted the years ended December 31, <strong>2005</strong>, 2004 and 2003 was:<br />
<strong>2005</strong> 2004 2003<br />
Per ADS Per ADS Per ADS<br />
Per share equivalent Per share equivalent Per share equivalent<br />
Equals the market<br />
price on a grant date $– $– $ – $ – $ 16.76 $ 4.19<br />
Exceeds the market price<br />
on a grant date 215.44 53.86 – – – –<br />
Less than the market<br />
price on a grant date $– $– $ – $ – $ 45.42 $ 11.36