

PhD Thesis Emmanuel Obeng Bekoe - Cranfield University
PhD Thesis Emmanuel Obeng Bekoe - Cranfield University
PhD Thesis Emmanuel Obeng Bekoe - Cranfield University

You also want an ePaper? Increase the reach of your titles
YUMPU automatically turns print PDFs into web optimized ePapers that Google loves.
143<br />
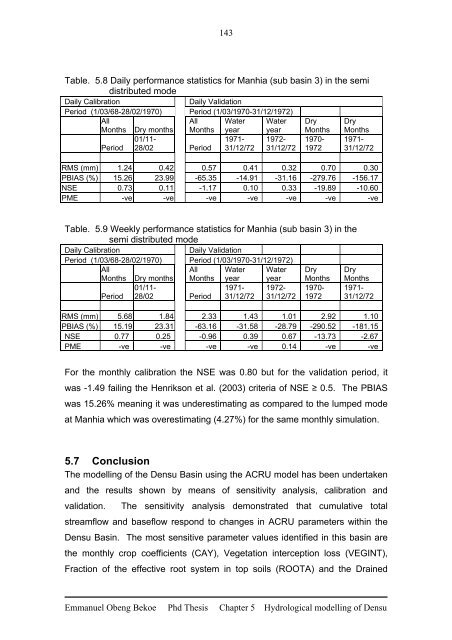
Table. 5.8 Daily performance statistics for Manhia (sub basin 3) in the semi<br />
distributed mode<br />
Daily Calibration Daily Validation<br />
Period (1/03/68-28/02/1970) Period (1/03/1970-31/12/1972)<br />
All<br />
All Water Water Dry Dry<br />
Months Dry months Months year year Months Months<br />
01/11-<br />
1971- 1972- 1970- 1971-<br />
Period 28/02 Period 31/12/72 31/12/72 1972 31/12/72<br />
RMS (mm) 1.24 0.42 0.57 0.41 0.32 0.70 0.30<br />
PBIAS (%) 15.26 23.99 -65.35 -14.91 -31.16 -279.76 -156.17<br />
NSE 0.73 0.11 -1.17 0.10 0.33 -19.89 -10.60<br />
PME -ve -ve -ve -ve -ve -ve -ve<br />
Table. 5.9 Weekly performance statistics for Manhia (sub basin 3) in the<br />
semi distributed mode<br />
Daily Calibration Daily Validation<br />
Period (1/03/68-28/02/1970) Period (1/03/1970-31/12/1972)<br />
All<br />
All Water Water Dry Dry<br />
Months Dry months Months year year Months Months<br />
01/11-<br />
1971- 1972- 1970- 1971-<br />
Period 28/02 Period 31/12/72 31/12/72 1972 31/12/72<br />
RMS (mm) 5.68 1.84 2.33 1.43 1.01 2.92 1.10<br />
PBIAS (%) 15.19 23.31 -63.16 -31.58 -28.79 -290.52 -181.15<br />
NSE 0.77 0.25 -0.96 0.39 0.67 -13.73 -2.67<br />
PME -ve -ve -ve -ve 0.14 -ve -ve<br />
For the monthly calibration the NSE was 0.80 but for the validation period, it<br />
was -1.49 failing the Henrikson et al. (2003) criteria of NSE ≥ 0.5. The PBIAS<br />
was 15.26% meaning it was underestimating as compared to the lumped mode<br />
at Manhia which was overestimating (4.27%) for the same monthly simulation.<br />
5.7 Conclusion<br />
The modelling of the Densu Basin using the ACRU model has been undertaken<br />
and the results shown by means of sensitivity analysis, calibration and<br />
validation. The sensitivity analysis demonstrated that cumulative total<br />
streamflow and baseflow respond to changes in ACRU parameters within the<br />
Densu Basin. The most sensitive parameter values identified in this basin are<br />
the monthly crop coefficients (CAY), Vegetation interception loss (VEGINT),<br />
Fraction of the effective root system in top soils (ROOTA) and the Drained<br />
<strong>Emmanuel</strong> <strong>Obeng</strong> <strong>Bekoe</strong> Phd <strong>Thesis</strong> Chapter 5 Hydrological modelling of Densu


