

PhD Thesis Emmanuel Obeng Bekoe - Cranfield University
PhD Thesis Emmanuel Obeng Bekoe - Cranfield University
PhD Thesis Emmanuel Obeng Bekoe - Cranfield University

You also want an ePaper? Increase the reach of your titles
YUMPU automatically turns print PDFs into web optimized ePapers that Google loves.
Monthly Means of Actual<br />
Evapotranspiration (mm)<br />
168<br />
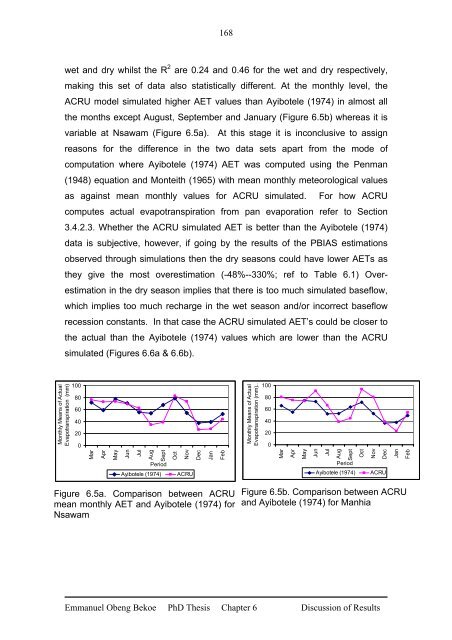
wet and dry whilst the R 2 are 0.24 and 0.46 for the wet and dry respectively,<br />
making this set of data also statistically different. At the monthly level, the<br />
ACRU model simulated higher AET values than Ayibotele (1974) in almost all<br />
the months except August, September and January (Figure 6.5b) whereas it is<br />
variable at Nsawam (Figure 6.5a). At this stage it is inconclusive to assign<br />
reasons for the difference in the two data sets apart from the mode of<br />
computation where Ayibotele (1974) AET was computed using the Penman<br />
(1948) equation and Monteith (1965) with mean monthly meteorological values<br />
as against mean monthly values for ACRU simulated. For how ACRU<br />
computes actual evapotranspiration from pan evaporation refer to Section<br />
3.4.2.3. Whether the ACRU simulated AET is better than the Ayibotele (1974)<br />
data is subjective, however, if going by the results of the PBIAS estimations<br />
observed through simulations then the dry seasons could have lower AETs as<br />
they give the most overestimation (-48%--330%; ref to Table 6.1) Overestimation<br />
in the dry season implies that there is too much simulated baseflow,<br />
which implies too much recharge in the wet season and/or incorrect baseflow<br />
recession constants. In that case the ACRU simulated AET’s could be closer to<br />
the actual than the Ayibotele (1974) values which are lower than the ACRU<br />
simulated (Figures 6.6a & 6.6b).<br />
100<br />
80<br />
60<br />
40<br />
20<br />
0<br />
Mar<br />
Apr<br />
May<br />
Jun<br />
Jul<br />
Aug<br />
Sept<br />
Oct<br />
Nov<br />
Period<br />
Ayibotele (1974) ACRU<br />
Figure 6.5a. Comparison between ACRU<br />
mean monthly AET and Ayibotele (1974) for<br />
Nsawam<br />
Dec<br />
Jan<br />
Feb<br />
<strong>Emmanuel</strong> <strong>Obeng</strong> <strong>Bekoe</strong> <strong>PhD</strong> <strong>Thesis</strong> Chapter 6 Discussion of Results<br />
Monthly Means of Actual<br />
Evapotranspiration (mm)..<br />
100<br />
80<br />
60<br />
40<br />
20<br />
0<br />
Mar<br />
Apr<br />
May<br />
Jun<br />
Jul<br />
Aug<br />
Sept<br />
Oct<br />
Nov<br />
Dec<br />
Period<br />
Ayibotele (1974) ACRU<br />
Figure 6.5b. Comparison between ACRU<br />
and Ayibotele (1974) for Manhia<br />
Jan<br />
Feb


