

PhD Thesis Emmanuel Obeng Bekoe - Cranfield University
PhD Thesis Emmanuel Obeng Bekoe - Cranfield University
PhD Thesis Emmanuel Obeng Bekoe - Cranfield University

You also want an ePaper? Increase the reach of your titles
YUMPU automatically turns print PDFs into web optimized ePapers that Google loves.
147<br />
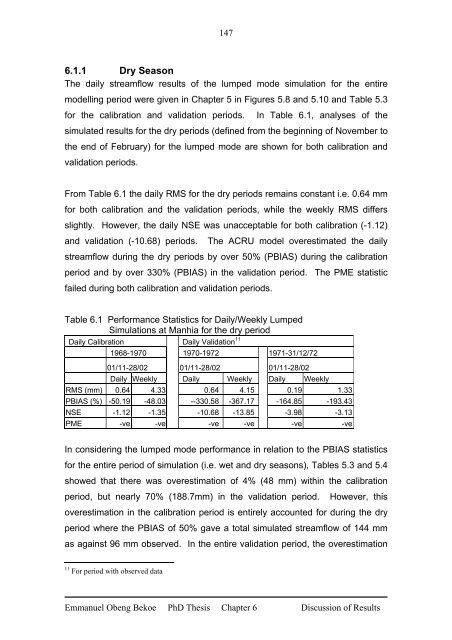
6.1.1 Dry Season<br />
The daily streamflow results of the lumped mode simulation for the entire<br />
modelling period were given in Chapter 5 in Figures 5.8 and 5.10 and Table 5.3<br />
for the calibration and validation periods. In Table 6.1, analyses of the<br />
simulated results for the dry periods (defined from the beginning of November to<br />
the end of February) for the lumped mode are shown for both calibration and<br />
validation periods.<br />
From Table 6.1 the daily RMS for the dry periods remains constant i.e. 0.64 mm<br />
for both calibration and the validation periods, while the weekly RMS differs<br />
slightly. However, the daily NSE was unacceptable for both calibration (-1.12)<br />
and validation (-10.68) periods. The ACRU model overestimated the daily<br />
streamflow during the dry periods by over 50% (PBIAS) during the calibration<br />
period and by over 330% (PBIAS) in the validation period. The PME statistic<br />
failed during both calibration and validation periods.<br />
Table 6.1 Performance Statistics for Daily/Weekly Lumped<br />
Simulations at Manhia for the dry period<br />
Daily Calibration Daily Validation 11<br />
1968-1970 1970-1972 1971-31/12/72<br />
01/11-28/02 01/11-28/02 01/11-28/02<br />
Daily Weekly Daily Weekly Daily Weekly<br />
RMS (mm) 0.64 4.33 0.64 4.15 0.19 1.33<br />
PBIAS (%) -50.19 -48.03 --330.58 -367.17 -164.85 -193.43<br />
NSE -1.12 -1.35 -10.68 -13.85 -3.98 -3.13<br />
PME -ve -ve -ve -ve -ve -ve<br />
In considering the lumped mode performance in relation to the PBIAS statistics<br />
for the entire period of simulation (i.e. wet and dry seasons), Tables 5.3 and 5.4<br />
showed that there was overestimation of 4% (48 mm) within the calibration<br />
period, but nearly 70% (188.7mm) in the validation period. However, this<br />
overestimation in the calibration period is entirely accounted for during the dry<br />
period where the PBIAS of 50% gave a total simulated streamflow of 144 mm<br />
as against 96 mm observed. In the entire validation period, the overestimation<br />
11 For period with observed data<br />
<strong>Emmanuel</strong> <strong>Obeng</strong> <strong>Bekoe</strong> <strong>PhD</strong> <strong>Thesis</strong> Chapter 6 Discussion of Results


