

PhD Thesis Emmanuel Obeng Bekoe - Cranfield University
PhD Thesis Emmanuel Obeng Bekoe - Cranfield University
PhD Thesis Emmanuel Obeng Bekoe - Cranfield University

Create successful ePaper yourself
Turn your PDF publications into a flip-book with our unique Google optimized e-Paper software.
76<br />
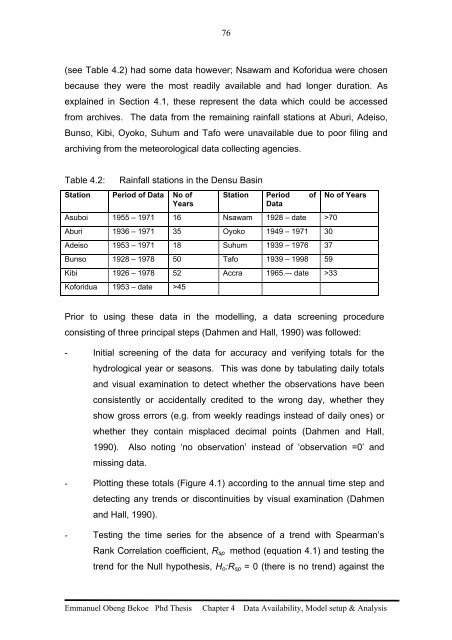
(see Table 4.2) had some data however; Nsawam and Koforidua were chosen<br />
because they were the most readily available and had longer duration. As<br />
explained in Section 4.1, these represent the data which could be accessed<br />
from archives. The data from the remaining rainfall stations at Aburi, Adeiso,<br />
Bunso, Kibi, Oyoko, Suhum and Tafo were unavailable due to poor filing and<br />
archiving from the meteorological data collecting agencies.<br />
Table 4.2: Rainfall stations in the Densu Basin<br />
Station Period of Data No of<br />
Years<br />
Station Period of<br />
Data<br />
Asuboi 1955 – 1971 16 Nsawam 1928 – date >70<br />
Aburi 1936 – 1971 35 Oyoko 1949 – 1971 30<br />
Adeiso 1953 – 1971 18 Suhum 1939 – 1976 37<br />
Bunso 1928 – 1978 50 Tafo 1939 – 1998 59<br />
Kibi 1926 – 1978 52 Accra 1965.–- date >33<br />
Koforidua 1953 – date >45<br />
No of Years<br />
Prior to using these data in the modelling, a data screening procedure<br />
consisting of three principal steps (Dahmen and Hall, 1990) was followed:<br />
- Initial screening of the data for accuracy and verifying totals for the<br />
hydrological year or seasons. This was done by tabulating daily totals<br />
and visual examination to detect whether the observations have been<br />
consistently or accidentally credited to the wrong day, whether they<br />
show gross errors (e.g. from weekly readings instead of daily ones) or<br />
whether they contain misplaced decimal points (Dahmen and Hall,<br />
1990). Also noting ‘no observation’ instead of ‘observation =0’ and<br />
missing data.<br />
- Plotting these totals (Figure 4.1) according to the annual time step and<br />
detecting any trends or discontinuities by visual examination (Dahmen<br />
and Hall, 1990).<br />
- Testing the time series for the absence of a trend with Spearman’s<br />
Rank Correlation coefficient, Rsp method (equation 4.1) and testing the<br />
trend for the Null hypothesis, Ho:Rsp = 0 (there is no trend) against the<br />
<strong>Emmanuel</strong> <strong>Obeng</strong> <strong>Bekoe</strong> Phd <strong>Thesis</strong> Chapter 4 Data Availability, Model setup & Analysis


