The Road to Hemispheric Cooperation: Beyond the Cartagena
The Road to Hemispheric Cooperation: Beyond the Cartagena
The Road to Hemispheric Cooperation: Beyond the Cartagena

Create successful ePaper yourself
Turn your PDF publications into a flip-book with our unique Google optimized e-Paper software.
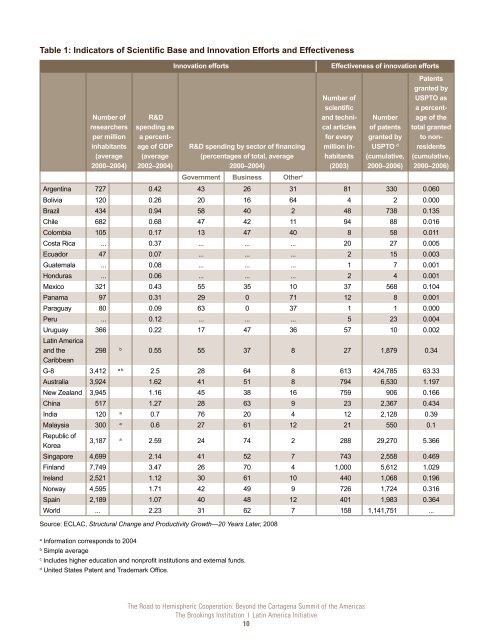
Table 1: Indica<strong>to</strong>rs of Scientific Base and Innovation Efforts and Effectiveness<br />
Number of<br />
researchers<br />
per million<br />
inhabitants<br />
(average<br />
2000–2004)<br />
R&D<br />
spending as<br />
a percentage<br />
of GDP<br />
(average<br />
2002–2004)<br />
Innovation efforts Effectiveness of innovation efforts<br />
R&D spending by sec<strong>to</strong>r of financing<br />
(percentages of <strong>to</strong>tal, average<br />
2000–2004)<br />
Government Business O<strong>the</strong>r c<br />
Number of<br />
scientific<br />
and technical<br />
articles<br />
for every<br />
million inhabitants<br />
(2003)<br />
<strong>The</strong> <strong>Road</strong> <strong>to</strong> <strong>Hemispheric</strong> <strong>Cooperation</strong>: <strong>Beyond</strong> <strong>the</strong> <strong>Cartagena</strong> Summit of <strong>the</strong> Americas<br />
<strong>The</strong> Brookings Institution ❘ Latin America Initiative<br />
10<br />
Number<br />
of patents<br />
granted by<br />
USPTO d<br />
(cumulative,<br />
2000–2006)<br />
Patents<br />
granted by<br />
USPTO as<br />
a percentage<br />
of <strong>the</strong><br />
<strong>to</strong>tal granted<br />
<strong>to</strong> nonresidents<br />
(cumulative,<br />
2000–2006)<br />
Argentina 727 0.42 43 26 31 81 330 0.060<br />
Bolivia 120 0.26 20 16 64 4 2 0.000<br />
Brazil 434 0.94 58 40 2 48 738 0.135<br />
Chile 682 0.68 47 42 11 94 88 0.016<br />
Colombia 105 0.17 13 47 40 8 58 0.011<br />
Costa Rica ... 0.37 ... ... ... 20 27 0.005<br />
Ecuador 47 0.07 ... ... ... 2 15 0.003<br />
Guatemala ... 0.08 ... ... ... 1 7 0.001<br />
Honduras ... 0.06 ... ... ... 2 4 0.001<br />
Mexico 321 0.43 55 35 10 37 568 0.104<br />
Panama 97 0.31 29 0 71 12 8 0.001<br />
Paraguay 80 0.09 63 0 37 1 1 0.000<br />
Peru ... 0.12 ... ... ... 5 23 0.004<br />
Uruguay 366 0.22 17 47 36 57 10 0.002<br />
Latin America<br />
and <strong>the</strong><br />
Caribbean<br />
298 b 0.55 55 37 8 27 1,879 0.34<br />
G-8 3,412 a b 2.5 28 64 8 613 424,785 63.33<br />
Australia 3,924 1.62 41 51 8 794 6,530 1.197<br />
New Zealand 3,945 1.16 45 38 16 759 906 0.166<br />
China 517 1.27 28 63 9 23 2,367 0.434<br />
India 120 a 0.7 76 20 4 12 2,128 0.39<br />
Malaysia 300 a 0.6 27 61 12 21 550 0.1<br />
Republic of<br />
Korea<br />
3,187 a 2.59 24 74 2 288 29,270 5.366<br />
Singapore 4,699 2.14 41 52 7 743 2,558 0.469<br />
Finland 7,749 3.47 26 70 4 1,000 5,612 1.029<br />
Ireland 2,521 1.12 30 61 10 440 1,068 0.196<br />
Norway 4,595 1.71 42 49 9 726 1,724 0.316<br />
Spain 2,189 1.07 40 48 12 401 1,983 0.364<br />
World ... 2.23 31 62 7 158 1,141,751 ...<br />
Source: ECLAC, Structural Change and Productivity Growth—20 Years Later, 2008<br />
a Information corresponds <strong>to</strong> 2004<br />
b Simple average<br />
c Includes higher education and nonprofit institutions and external funds.<br />
d United States Patent and Trademark Office.