The Road to Hemispheric Cooperation: Beyond the Cartagena
The Road to Hemispheric Cooperation: Beyond the Cartagena
The Road to Hemispheric Cooperation: Beyond the Cartagena

Create successful ePaper yourself
Turn your PDF publications into a flip-book with our unique Google optimized e-Paper software.
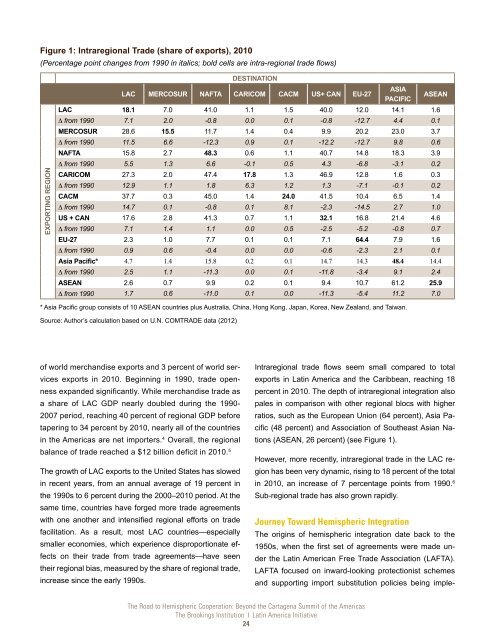
Figure 1: Intraregional Trade (share of exports), 2010<br />
(Percentage point changes from 1990 in italics; bold cells are intra-regional trade flows)<br />
EXPORTING REGION<br />
LAC MERCOSUR NAFTA<br />
DESTINATION<br />
CARICOM CACM US+ CAN EU-27<br />
ASIA<br />
PACIFIC<br />
ASEAN<br />
LAC 18.1 7.0 41.0 1.1 1.5 40.0 12.0 14.1 1.6<br />
∆ from 1990 7.1 2.0 -0.8 0.0 0.1 -0.8 -12.7 4.4 0.1<br />
MERCOSUR 28.6 15.5 11.7 1.4 0.4 9.9 20.2 23.0 3.7<br />
∆ from 1990 11.5 6.6 -12.3 0.9 0.1 -12.2 -12.7 9.8 0.6<br />
NAFTA 15.8 2.7 48.3 0.6 1.1 40.7 14.8 18.3 3.9<br />
∆ from 1990 5.5 1.3 6.6 -0.1 0.5 4.3 -6.8 -3.1 0.2<br />
CARICOM 27.3 2.0 47.4 17.8 1.3 46.9 12.8 1.6 0.3<br />
∆ from 1990 12.9 1.1 1.8 6.3 1.2 1.3 -7.1 -0.1 0.2<br />
CACM 37.7 0.3 45.0 1.4 24.0 41.5 10.4 6.5 1.4<br />
∆ from 1990 14.7 0.1 -0.8 0.1 8.1 -2.3 -14.5 2.7 1.0<br />
US + CAN 17.6 2.8 41.3 0.7 1.1 32.1 16.8 21.4 4.6<br />
∆ from 1990 7.1 1.4 1.1 0.0 0.5 -2.5 -5.2 -0.8 0.7<br />
EU-27 2.3 1.0 7.7 0.1 0.1 7.1 64.4 7.9 1.6<br />
∆ from 1990 0.9 0.6 -0.4 0.0 0.0 -0.6 -2.3 2.1 0.1<br />
Asia Pacific* 4.7 1.4 15.8 0.2 0.1 14.7 14.3 48.4 14.4<br />
∆ from 1990 2.5 1.1 -11.3 0.0 0.1 -11.8 -3.4 9.1 2.4<br />
ASEAN 2.6 0.7 9.9 0.2 0.1 9.4 10.7 61.2 25.9<br />
∆ from 1990 1.7 0.6 -11.0 0.1 0.0 -11.3 -5.4 11.2 7.0<br />
* Asia Pacific group consists of 10 ASEAN countries plus Australia, China, Hong Kong, Japan, Korea, New Zealand, and Taiwan.<br />
Source: Author’s calculation based on U.N. COMTRADE data (2012)<br />
of world merchandise exports and 3 percent of world services<br />
exports in 2010. Beginning in 1990, trade openness<br />
expanded significantly. While merchandise trade as<br />
a share of LAC GDP nearly doubled during <strong>the</strong> 1990-<br />
2007 period, reaching 40 percent of regional GDP before<br />
tapering <strong>to</strong> 34 percent by 2010, nearly all of <strong>the</strong> countries<br />
in <strong>the</strong> Americas are net importers. 4 Overall, <strong>the</strong> regional<br />
balance of trade reached a $12 billion deficit in 2010. 5<br />
<strong>The</strong> growth of LAC exports <strong>to</strong> <strong>the</strong> United States has slowed<br />
in recent years, from an annual average of 19 percent in<br />
<strong>the</strong> 1990s <strong>to</strong> 6 percent during <strong>the</strong> 2000–2010 period. At <strong>the</strong><br />
same time, countries have forged more trade agreements<br />
with one ano<strong>the</strong>r and intensified regional efforts on trade<br />
facilitation. As a result, most LAC countries—especially<br />
smaller economies, which experience disproportionate effects<br />
on <strong>the</strong>ir trade from trade agreements—have seen<br />
<strong>the</strong>ir regional bias, measured by <strong>the</strong> share of regional trade,<br />
increase since <strong>the</strong> early 1990s.<br />
Intraregional trade flows seem small compared <strong>to</strong> <strong>to</strong>tal<br />
exports in Latin America and <strong>the</strong> Caribbean, reaching 18<br />
percent in 2010. <strong>The</strong> depth of intraregional integration also<br />
pales in comparison with o<strong>the</strong>r regional blocs with higher<br />
ratios, such as <strong>the</strong> European Union (64 percent), Asia Pacific<br />
(48 percent) and Association of Sou<strong>the</strong>ast Asian Nations<br />
(ASEAN, 26 percent) (see Figure 1).<br />
However, more recently, intraregional trade in <strong>the</strong> LAC region<br />
has been very dynamic, rising <strong>to</strong> 18 percent of <strong>the</strong> <strong>to</strong>tal<br />
in 2010, an increase of 7 percentage points from 1990. 6<br />
Sub-regional trade has also grown rapidly.<br />
Journey Toward <strong>Hemispheric</strong> Integration<br />
<strong>The</strong> origins of hemispheric integration date back <strong>to</strong> <strong>the</strong><br />
1950s, when <strong>the</strong> first set of agreements were made under<br />
<strong>the</strong> Latin American Free Trade Association (LAFTA).<br />
LAFTA focused on inward-looking protectionist schemes<br />
and supporting import substitution policies being imple-<br />
<strong>The</strong> <strong>Road</strong> <strong>to</strong> <strong>Hemispheric</strong> <strong>Cooperation</strong>: <strong>Beyond</strong> <strong>the</strong> <strong>Cartagena</strong> Summit of <strong>the</strong> Americas<br />
<strong>The</strong> Brookings Institution ❘ Latin America Initiative<br />
24