How Do Corporate Venture Capitalists Create Value for ...
How Do Corporate Venture Capitalists Create Value for ...
How Do Corporate Venture Capitalists Create Value for ...

Create successful ePaper yourself
Turn your PDF publications into a flip-book with our unique Google optimized e-Paper software.
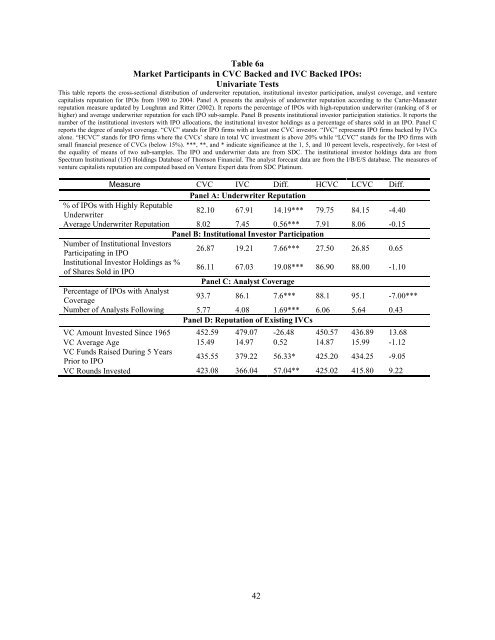
Table 6a<br />
Market Participants in CVC Backed and IVC Backed IPOs:<br />
Univariate Tests<br />
This table reports the cross-sectional distribution of underwriter reputation, institutional investor participation, analyst coverage, and venture<br />
capitalists reputation <strong>for</strong> IPOs from 1980 to 2004. Panel A presents the analysis of underwriter reputation according to the Carter-Manaster<br />
reputation measure updated by Loughran and Ritter (2002). It reports the percentage of IPOs with high-reputation underwriter (ranking of 8 or<br />
higher) and average underwriter reputation <strong>for</strong> each IPO sub-sample. Panel B presents institutional investor participation statistics. It reports the<br />
number of the institutional investors with IPO allocations, the institutional investor holdings as a percentage of shares sold in an IPO. Panel C<br />
reports the degree of analyst coverage. “CVC” stands <strong>for</strong> IPO firms with at least one CVC investor. “IVC” represents IPO firms backed by IVCs<br />
alone. “HCVC” stands <strong>for</strong> IPO firms where the CVCs’ share in total VC investment is above 20% while “LCVC” stands <strong>for</strong> the IPO firms with<br />
small financial presence of CVCs (below 15%). ***, **, and * indicate significance at the 1, 5, and 10 percent levels, respectively, <strong>for</strong> t-test of<br />
the equality of means of two sub-samples. The IPO and underwriter data are from SDC. The institutional investor holdings data are from<br />
Spectrum Institutional (13f) Holdings Database of Thomson Financial. The analyst <strong>for</strong>ecast data are from the I/B/E/S database. The measures of<br />
venture capitalists reputation are computed based on <strong>Venture</strong> Expert data from SDC Platinum.<br />
Measure CVC IVC Diff. HCVC LCVC Diff.<br />
Panel A: Underwriter Reputation<br />
% of IPOs with Highly Reputable<br />
Underwriter<br />
82.10 67.91 14.19*** 79.75 84.15 -4.40<br />
Average Underwriter Reputation 8.02 7.45 0.56*** 7.91 8.06 -0.15<br />
Panel B: Institutional Investor Participation<br />
Number of Institutional Investors<br />
Participating in IPO<br />
26.87 19.21 7.66*** 27.50 26.85 0.65<br />
Institutional Investor Holdings as %<br />
of Shares Sold in IPO<br />
86.11 67.03 19.08*** 86.90 88.00 -1.10<br />
Panel C: Analyst Coverage<br />
Percentage of IPOs with Analyst<br />
Coverage<br />
93.7 86.1 7.6*** 88.1 95.1 -7.00***<br />
Number of Analysts Following 5.77 4.08 1.69*** 6.06 5.64 0.43<br />
Panel D: Reputation of Existing IVCs<br />
VC Amount Invested Since 1965 452.59 479.07 -26.48 450.57 436.89 13.68<br />
VC Average Age 15.49 14.97 0.52 14.87 15.99 -1.12<br />
VC Funds Raised During 5 Years<br />
Prior to IPO<br />
435.55 379.22 56.33* 425.20 434.25 -9.05<br />
VC Rounds Invested 423.08 366.04 57.04** 425.02 415.80 9.22<br />
42