How Do Corporate Venture Capitalists Create Value for ...
How Do Corporate Venture Capitalists Create Value for ...
How Do Corporate Venture Capitalists Create Value for ...

Create successful ePaper yourself
Turn your PDF publications into a flip-book with our unique Google optimized e-Paper software.
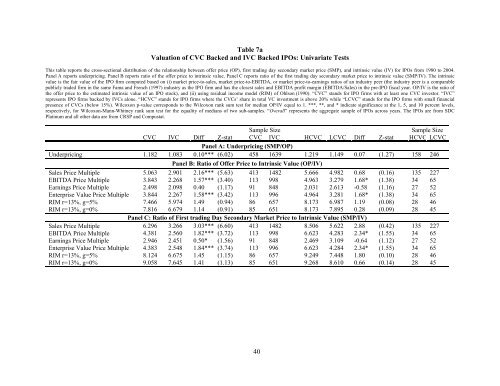
Table 7a<br />
Valuation of CVC Backed and IVC Backed IPOs: Univariate Tests<br />
This table reports the cross-sectional distribution of the relationship between offer price (OP), first trading day secondary market price (SMP), and intrinsic value (IV) <strong>for</strong> IPOs from 1980 to 2004.<br />
Panel A reports underpricing. Panel B reports ratio of the offer price to intrinsic value. Panel C reports ratio of the first trading day secondary market price to intrinsic value (SMP/IV). The intrinsic<br />
value is the fair value of the IPO firm computed based on (i) market price-to-sales, market price-to-EBITDA, or market price-to-earnings ratios of an industry peer (the industry peer is a comparable<br />
publicly traded firm in the same Fama and French (1997) industry as the IPO firm and has the closest sales and EBITDA profit margin (EBITDA/Sales) in the pre-IPO fiscal year. OP/IV is the ratio of<br />
the offer price to the estimated intrinsic value of an IPO stock), and (ii) using residual income model (RIM) of Ohlson (1990). “CVC” stands <strong>for</strong> IPO firms with at least one CVC investor. “IVC”<br />
represents IPO firms backed by IVCs alone. “HCVC” stands <strong>for</strong> IPO firms where the CVCs’ share in total VC investment is above 20% while “LCVC” stands <strong>for</strong> the IPO firms with small financial<br />
presence of CVCs (below 15%). Wilcoxon p-value corresponds to the Wilcoxon rank sum test <strong>for</strong> median OP/IV equal to 1. ***, **, and * indicate significance at the 1, 5, and 10 percent levels,<br />
respectively, <strong>for</strong> Wilcoxon-Mann-Whitney rank sum test <strong>for</strong> the equality of medians of two sub-samples. “Overall” represents the aggregate sample of IPOs across years. The IPOs are from SDC<br />
Platinum and all other data are from CRSP and Compustat.<br />
Sample Size Sample Size<br />
CVC IVC Diff Z-stat CVC IVC HCVC LCVC Diff Z-stat HCVC LCVC<br />
Panel A: Underpricing (SMP/OP)<br />
Underpricing 1.182 1.083 0.10*** (6.02) 458 1639 1.219 1.149 0.07 (1.27) 158 246<br />
Panel B: Ratio of Offer Price to Intrinsic <strong>Value</strong> (OP/IV)<br />
Sales Price Multiple 5.063 2.901 2.16*** (5.63) 413 1482 5.666 4.982 0.68 (0.16) 135 227<br />
EBITDA Price Multiple 3.843 2.268 1.57*** (3.40) 113 998 4.963 3.279 1.68* (1.38) 34 65<br />
Earnings Price Multiple 2.498 2.098 0.40 (1.17) 91 848 2.031 2.613 -0.58 (1.16) 27 52<br />
Enterprise <strong>Value</strong> Price Multiple 3.844 2.267 1.58*** (3.42) 113 996 4.964 3.281 1.68* (1.38) 34 65<br />
RIM r=13%, g=5% 7.466 5.974 1.49 (0.94) 86 657 8.173 6.987 1.19 (0.08) 28 46<br />
RIM r=13%, g=0% 7.816 6.679 1.14 (0.91) 85 651 8.173 7.895 0.28 (0.09) 28 45<br />
Panel C: Ratio of First trading Day Secondary Market Price to Intrinsic <strong>Value</strong> (SMP/IV)<br />
Sales Price Multiple 6.296 3.266 3.03*** (6.60) 413 1482 8.506 5.622 2.88 (0.42) 135 227<br />
EBITDA Price Multiple 4.381 2.560 1.82*** (3.72) 113 998 6.623 4.283 2.34* (1.55) 34 65<br />
Earnings Price Multiple 2.946 2.451 0.50* (1.56) 91 848 2.469 3.109 -0.64 (1.12) 27 52<br />
Enterprise <strong>Value</strong> Price Multiple 4.383 2.548 1.84*** (3.74) 113 996 6.623 4.284 2.34* (1.55) 34 65<br />
RIM r=13%, g=5% 8.124 6.675 1.45 (1.15) 86 657 9.249 7.448 1.80 (0.10) 28 46<br />
RIM r=13%, g=0% 9.058 7.645 1.41 (1.13) 85 651 9.268 8.610 0.66 (0.14) 28 45<br />
40