How Do Corporate Venture Capitalists Create Value for ...
How Do Corporate Venture Capitalists Create Value for ...
How Do Corporate Venture Capitalists Create Value for ...

Create successful ePaper yourself
Turn your PDF publications into a flip-book with our unique Google optimized e-Paper software.
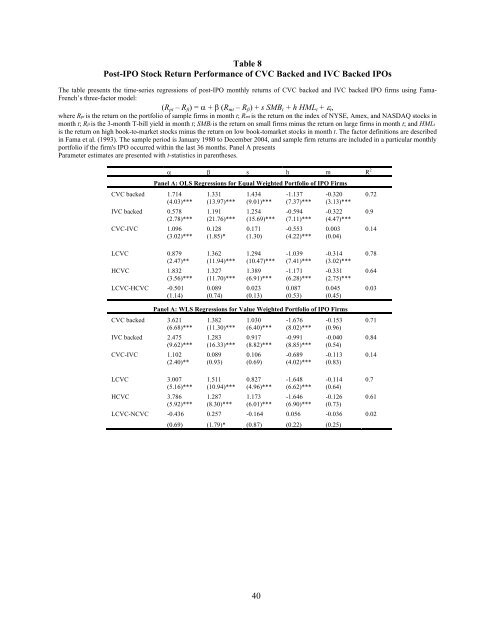
Table 8<br />
Post-IPO Stock Return Per<strong>for</strong>mance of CVC Backed and IVC Backed IPOs<br />
The table presents the time-series regressions of post-IPO monthly returns of CVC backed and IVC backed IPO firms using Fama-<br />
French’s three-factor model:<br />
(Rpt – Rft) = α + β (Rmt – Rft) + s SMBt + h HMLt + εt,<br />
where Rpt is the return on the portfolio of sample firms in month t; Rmt is the return on the index of NYSE, Amex, and NASDAQ stocks in<br />
month t; Rft is the 3-month T-bill yield in month t; SMBt is the return on small firms minus the return on large firms in month t; and HMLt<br />
is the return on high book-to-market stocks minus the return on low book-tomarket stocks in month t. The factor definitions are described<br />
in Fama et al. (1993). The sample period is January 1980 to December 2004, and sample firm returns are included in a particular monthly<br />
portfolio if the firm's IPO occurred within the last 36 months. Panel A presents<br />
Parameter estimates are presented with t-statistics in parentheses.<br />
α β s h m R 2<br />
Panel A: OLS Regressions <strong>for</strong> Equal Weighted Portfolio of IPO Firms<br />
CVC backed 1.714 1.331 1.434 -1.137 -0.320 0.72<br />
(4.03)*** (13.97)*** (9.01)*** (7.37)*** (3.13)***<br />
IVC backed 0.578 1.191 1.254 -0.594 -0.322 0.9<br />
(2.78)*** (21.76)*** (15.69)*** (7.11)*** (4.47)***<br />
CVC-IVC 1.096 0.128 0.171 -0.553 0.003 0.14<br />
(3.02)*** (1.85)* (1.30) (4.22)*** (0.04)<br />
LCVC 0.879 1.362 1.294 -1.039 -0.314 0.78<br />
(2.47)** (11.94)*** (10.47)*** (7.41)*** (3.02)***<br />
HCVC 1.832 1.327 1.389 -1.171 -0.331 0.64<br />
(3.56)*** (11.70)*** (6.91)*** (6.28)*** (2.75)***<br />
LCVC-HCVC -0.501 0.089 0.023 0.087 0.045 0.03<br />
(1.14) (0.74) (0.13) (0.53) (0.45)<br />
Panel A: WLS Regressions <strong>for</strong> <strong>Value</strong> Weighted Portfolio of IPO Firms<br />
CVC backed 3.621 1.382 1.030 -1.676 -0.153 0.71<br />
(6.68)*** (11.30)*** (6.40)*** (8.02)*** (0.96)<br />
IVC backed 2.475 1.283 0.917 -0.991 -0.040 0.84<br />
(9.62)*** (16.33)*** (8.82)*** (8.85)*** (0.54)<br />
CVC-IVC 1.102 0.089 0.106 -0.689 -0.113 0.14<br />
(2.40)** (0.93) (0.69) (4.02)*** (0.83)<br />
LCVC 3.007 1.511 0.827 -1.648 -0.114 0.7<br />
(5.16)*** (10.94)*** (4.96)*** (6.62)*** (0.64)<br />
HCVC 3.786 1.287 1.173 -1.646 -0.126 0.61<br />
(5.92)*** (8.30)*** (6.01)*** (6.90)*** (0.73)<br />
LCVC-NCVC -0.436 0.257 -0.164 0.056 -0.036 0.02<br />
(0.69) (1.79)* (0.87) (0.22) (0.25)<br />
40