SOLWEIG 1.0 – Modelling spatial variations of 3D radiant fluxes and ...
SOLWEIG 1.0 – Modelling spatial variations of 3D radiant fluxes and ...
SOLWEIG 1.0 – Modelling spatial variations of 3D radiant fluxes and ...

Create successful ePaper yourself
Turn your PDF publications into a flip-book with our unique Google optimized e-Paper software.
706 Int J Biometeorol (2008) 52:697<strong>–</strong>713<br />
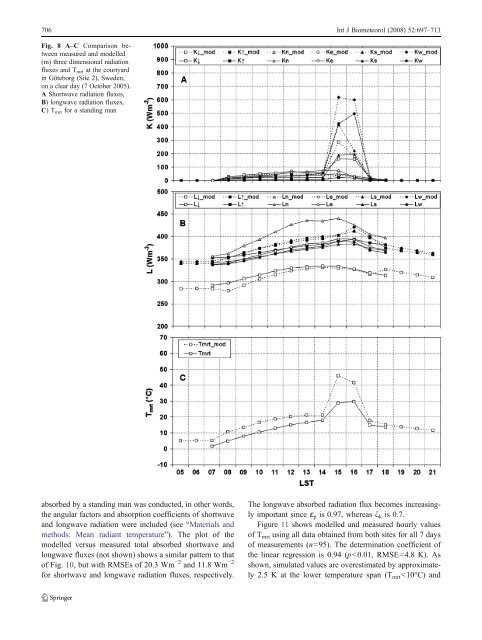
Fig. 8 A<strong>–</strong>C Comparison between<br />
measured <strong>and</strong> modelled<br />
(m) three dimensional radiation<br />
<strong>fluxes</strong> <strong>and</strong> T mrt at the courtyard<br />
in Göteborg (Site 2), Sweden,<br />
on a clear day (7 October 2005).<br />
A Shortwave radiation <strong>fluxes</strong>,<br />
B) longwave radiation <strong>fluxes</strong>,<br />
C) T mrt for a st<strong>and</strong>ing man<br />
absorbed by a st<strong>and</strong>ing man was conducted, in other words,<br />
the angular factors <strong>and</strong> absorption coefficients <strong>of</strong> shortwave<br />
<strong>and</strong> longwave radiation were included (see “Materials <strong>and</strong><br />
methods: Mean <strong>radiant</strong> temperature”). The plot <strong>of</strong> the<br />
modelled versus measured total absorbed shortwave <strong>and</strong><br />
longwave <strong>fluxes</strong> (not shown) shows a similar pattern to that<br />
<strong>of</strong> Fig. 10, but with RMSEs <strong>of</strong> 20.3 Wm −2 <strong>and</strong> 11.8 Wm −2<br />
for shortwave <strong>and</strong> longwave radiation <strong>fluxes</strong>, respectively.<br />
The longwave absorbed radiation flux becomes increasingly<br />
important since ɛ p is 0.97, whereas ζ k is 0.7.<br />
Figure 11 shows modelled <strong>and</strong> measured hourly values<br />
<strong>of</strong> Tmrt using all data obtained from both sites for all 7 days<br />
<strong>of</strong> measurements (n=95). The determination coefficient <strong>of</strong><br />
the linear regression is 0.94 (p