708 Int J Biometeorol (2008) 52:697<strong>–</strong>713
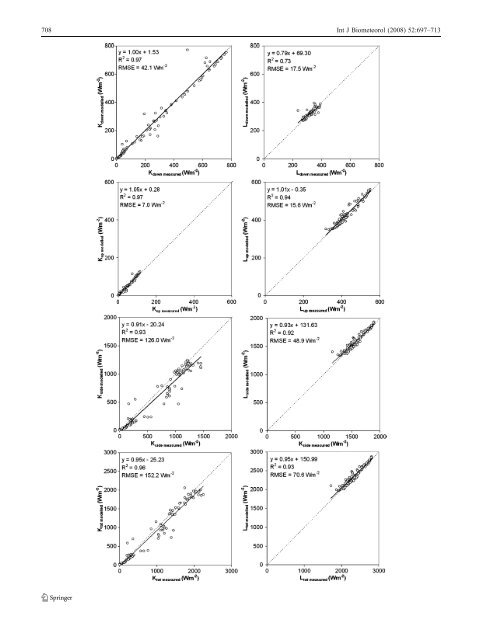
Int J Biometeorol (2008) 52:697<strong>–</strong>713 709 Fig. 10 Modelled versus measured hourly data <strong>of</strong> all the shortwave (n=92) <strong>and</strong> longwave (n=96) <strong>fluxes</strong> at two sites, one large square <strong>and</strong> one small courtyard, in Göteborg Sweden variation <strong>of</strong> T mrt at ground level for a part <strong>of</strong> the model domain. The example is taken from an afternoon occasion during a clear autumn day (1500 hours LST, 11 October 2005). The air temperature for the modelled hour was 19.5°C <strong>and</strong> the global radiation was 274 Wm −2 at the weather station located 1 km west <strong>of</strong> Site 1. The first obvious features are the shadow patterns, which are essential for the <strong>spatial</strong> estimation <strong>of</strong> Tmrt: sunlit areas, show considerably higher values <strong>of</strong> Tmrt. The red areas are exposed to direct sunlight, while the blue areas are in shade. Another clear feature is that Tmrt is relatively high close to a building wall (e.g. Fig. 12a) <strong>and</strong> decreases as the distance from the buildings increases (e.g. Fig. 12b). This is evident in both shadowed <strong>and</strong> sunlit areas. One can also observe that the areas that shift from being exposed to sunlight to becoming shadowed or vice versa experience a slower rise/drop in temperature, Tmrt, than areas that have been exposed to sunlight or in shade for more than 1 h. This is illustrated by the letters c, d, e <strong>and</strong> f in Fig. 12. The area around c, which just became exposed to the sun, reflects lower values <strong>of</strong> Tmrt in comparison to that around d, which has been in direct sunlight for more than 1 h. The area around e, which consequently just became shadowed, shows higher values <strong>of</strong> T mrt in comparison to f, which has been in the shade for more than 1 h. Due to the fact that <strong>SOLWEIG</strong> model simulates all longwave <strong>fluxes</strong> from the four cardinal points similarly, façades facing north have the same surface temperature as those facing south, which is not the case in a practical situation. This may be illustrated at letter g in Fig. 11, which signifies a small, shadowed yard surrounded by buildings. The Tmrt value at g is relative constant within the yard. In reality, T mrt is probably higher near the walls facing north <strong>and</strong> east. Direct sunlight reaching parts <strong>of</strong> these two walls will increase the surface temperature <strong>and</strong> consequently, the longwave irradiance originating from these two walls. Discussion In this section, the <strong>SOLWEIG</strong> <strong>1.0</strong> model is compared with other models that could be used to estimate radiation <strong>fluxes</strong> <strong>and</strong> Tmrt. Model performance <strong>and</strong> sensitivity <strong>of</strong> <strong>SOLWEIG</strong> <strong>1.0</strong> is also discussed. Model intercomparison Compared to other available models, the technique <strong>of</strong> estimating the three-dimensional radiation <strong>fluxes</strong> used in the <strong>SOLWEIG</strong> model appears to improve the accuracy <strong>of</strong> T mrt. This is especially evident for high sun zenith angles, since the radiation <strong>fluxes</strong> are not only considered for horizontal surfaces, but also from the four cardinal points. Thorsson et al. (2007) validated the RayMan 1.2 model <strong>and</strong> found that it underestimates Tmrt significantly at high sun zenith angles. The average differences between measured <strong>and</strong> modelled T mrt at Site 1 using RayMan 1.2 for 11 October 2005 <strong>and</strong> 26 July 2006 were 10.1 K <strong>and</strong> 6.8 K, respectively. The corresponding values for the <strong>SOLWEIG</strong> <strong>1.0</strong> model at the same location <strong>and</strong> dates were 1.7 K <strong>and</strong> 2.3 K. So far, the ENVI-met model has not been tested in the city <strong>of</strong> Göteborg. However, Ali-Toudert (2005) compared the T mrt modelled by ENVI-met to measured values <strong>of</strong> Tmrt throughout the diurnal cycle for a street canyon (H/ W=1) in Freiburg (Germany). She found that ENIV-met was well able to represent the trends <strong>of</strong> Tmrt with its two contrasting periods (day <strong>and</strong> night). However, the values that were returned by the ENVI-met model were significantly overestimated during the morning hours by up to 15 K <strong>and</strong> underestimated from noon <strong>and</strong> throughout the night by up to 7 K (Ali-Toudert 2005, p. 154). Model performance The current <strong>SOLWEIG</strong> <strong>1.0</strong> model estimates <strong>spatial</strong> <strong>variations</strong> <strong>of</strong> Tmrt relatively well for most <strong>of</strong> the different urban geometries <strong>and</strong> weather conditions used in the current validation dataset. Below, the performance <strong>and</strong> some limitations <strong>of</strong> the <strong>SOLWEIG</strong> <strong>1.0</strong> model are discussed. Fig. 11 Modelled versus measured hourly data <strong>of</strong> T mrt (n=95). The regression line is valid for data from Site 1 <strong>and</strong> Site 2 combined