
You also want an ePaper? Increase the reach of your titles
YUMPU automatically turns print PDFs into web optimized ePapers that Google loves.
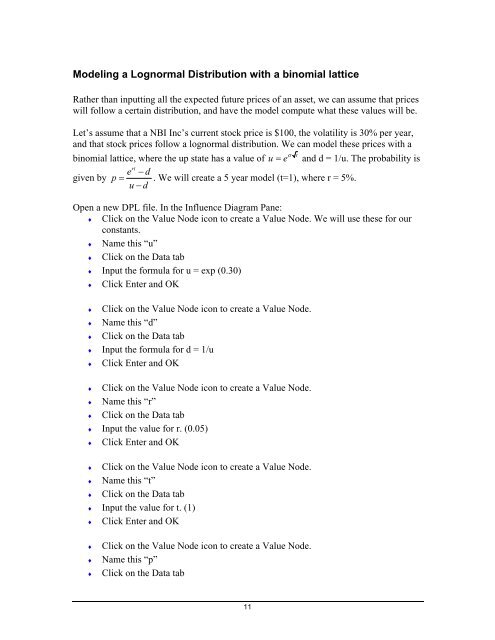
Modeling a Lognormal Distribution with a binomial lattice<br />
Rather than inputting all the expected future prices of an asset, we can assume that prices<br />
will follow a certain distribution, and have the model compute what these values will be.<br />
Let’s assume that a NBI Inc’s current stock price is $100, the volatility is 30% per year,<br />
and that stock prices follow a lognormal distribution. We can model these prices with a<br />
t<br />
binomial lattice, where the up state has a value of u e σ<br />
= and d = 1/u. The probability is<br />
rt<br />
e − d<br />
given by p = . We will create a 5 year model (t=1), where r = 5%.<br />
u−d Open a new <strong>DPL</strong> file. In the Influence Diagram Pane:<br />
♦ Click on the Value Node icon to create a Value Node. We will use these for our<br />
constants.<br />
♦ Name this “u”<br />
♦ Click on the Data tab<br />
♦ Input the formula for u = exp (0.30)<br />
♦ Click Enter and OK<br />
♦ Click on the Value Node icon to create a Value Node.<br />
♦ Name this “d”<br />
♦ Click on the Data tab<br />
♦ Input the formula for d = 1/u<br />
♦ Click Enter and OK<br />
♦ Click on the Value Node icon to create a Value Node.<br />
♦ Name this “r”<br />
♦ Click on the Data<br />
tab<br />
♦ Input the value for r. (0.05)<br />
♦ Click Enter and OK<br />
♦ Click on the Value Node icon to create a Value Node.<br />
♦ Name this “t”<br />
♦ Click on the Data<br />
tab<br />
)<br />
♦ Input the value for t. (1<br />
♦ Click Enter and OK<br />
♦ Click on the Value Node icon to create a Value Node.<br />
♦ Name this “p”<br />
♦ Click on the Data<br />
tab<br />
11