
Create successful ePaper yourself
Turn your PDF publications into a flip-book with our unique Google optimized e-Paper software.
♦ The three uncertain outcomes (Low, Nominal, High) have the same original value<br />
of $15. We will now change that to $10, $15 and $25<br />
respectively, to cover the<br />
range of possible oil prices for the problem, while maintaining the default<br />
probabilities for now.<br />
♦ Let’s assume that there is also uncertainty over the level of the reserves. Although<br />
the reserves are estimated to be 90MM Bbl it could be as low as 50 or as high<br />
as<br />
200M.<br />
♦ Right click on the Reserves node. Click on “Change Node Type” and choose<br />
“Chance” to change this node into a Chance node.<br />
♦ When the Node Definition window appears, click OK. You will see that the shape<br />
of this node in the Influence Diagram pane has changed to a circle.<br />
♦ Double click on the Reserves node again. The Data window will appear.<br />
♦ The three uncertain outcomes (Low, Nominal, High) still have the same original<br />
value of 90. We will now change that to 50, 90 and $200 respectively and click<br />
OK.<br />
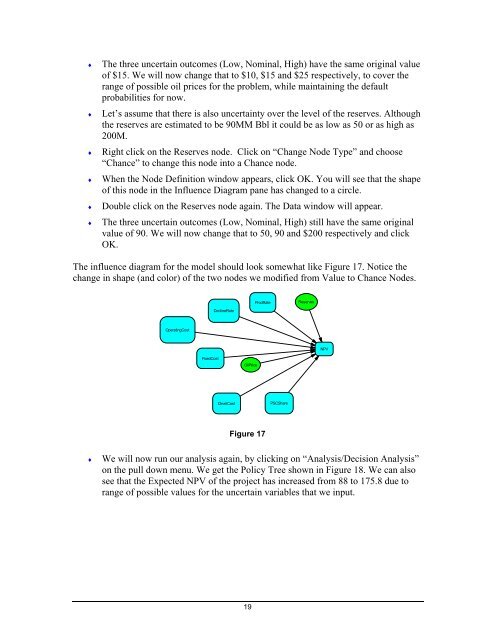
The influence diagram for the model should look somewhat like Figure 17. Notice the<br />
change in shape (and color) of the two nodes we modified from Value to Chance Nodes.<br />
OperatingCost<br />
FixedCost<br />
DeclineRate<br />
DevelCost<br />
OilPrice<br />
ProdRate<br />
Figure 17<br />
PSCShare<br />
♦ We will now run our analysis again, by clicking on “Analysis/Decision Analysis”<br />
on the pull down menu. We get the Policy Tree shown in Figure 18. We can also<br />
see that the Expected NPV of the project has increased from 88 to 175.8 due to<br />
range of possible values for the uncertain variables that we input.<br />
19<br />
Reserves<br />
NPV