

The Kolb Learning Style Inventory—Version 3.1 2005 - Whitewater ...
The Kolb Learning Style Inventory—Version 3.1 2005 - Whitewater ...
The Kolb Learning Style Inventory—Version 3.1 2005 - Whitewater ...

You also want an ePaper? Increase the reach of your titles
YUMPU automatically turns print PDFs into web optimized ePapers that Google loves.
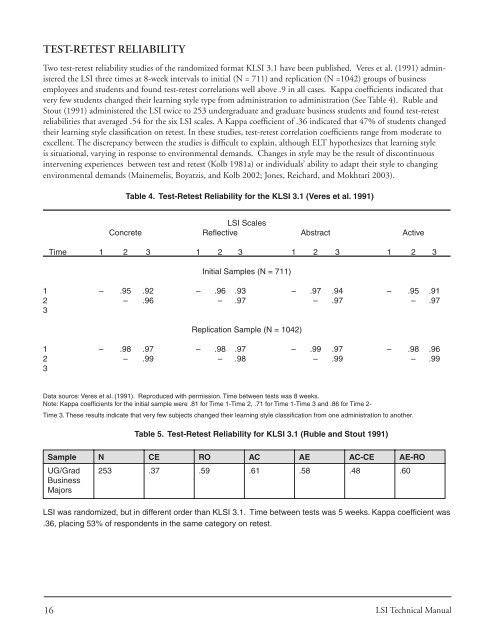
TEST-RETEST RELIABILITY<br />
Two test-retest reliability studies of the randomized format KLSI <strong>3.1</strong> have been published. Veres et al. (1991) administered<br />
the LSI three times at 8-week intervals to initial (N = 711) and replication (N =1042) groups of business<br />
employees and students and found test-retest correlations well above .9 in all cases. Kappa coeffi cients indicated that<br />
very few students changed their learning style type from administration to administration (See Table 4). Ruble and<br />
Stout (1991) administered the LSI twice to 253 undergraduate and graduate business students and found test-retest<br />
reliabilities that averaged .54 for the six LSI scales. A Kappa coeffi cient of .36 indicated that 47% of students changed<br />
their learning style classifi cation on retest. In these studies, test-retest correlation coeffi cients range from moderate to<br />
excellent. <strong>The</strong> discrepancy between the studies is diffi cult to explain, although ELT hypothesizes that learning style<br />
is situational, varying in response to environmental demands. Changes in style may be the result of discontinuous<br />
intervening experiences between test and retest (<strong>Kolb</strong> 1981a) or individuals’ ability to adapt their style to changing<br />
environmental demands (Mainemelis, Boyatzis, and <strong>Kolb</strong> 2002; Jones, Reichard, and Mokhtari 2003).<br />
Table 4. Test-Retest Reliability for the KLSI <strong>3.1</strong> (Veres et al. 1991)<br />
LSI Scales<br />
Concrete Refl ective Abstract Active<br />
Time 1 2 3 1 2 3 1 2 3 1 2 3<br />
Initial Samples (N = 711)<br />
1 – .95 .92 – .96 .93 – .97 .94 – .95 .91<br />
2 – .96 – .97 – .97 – .97<br />
3<br />
Replication Sample (N = 1042)<br />
1 – .98 .97 – .98 .97 – .99 .97 – .98 .96<br />
2 – .99 – .98 – .99 – .99<br />
3<br />
Data source: Veres et al. (1991). Reproduced with permission. Time between tests was 8 weeks.<br />
Note: Kappa coeffi cients for the initial sample were .81 for Time 1-Time 2, .71 for Time 1-Time 3 and .86 for Time 2-<br />
Time 3. <strong>The</strong>se results indicate that very few subjects changed their learning style classifi cation from one administration to another.<br />
Table 5. Test-Retest Reliability for KLSI <strong>3.1</strong> (Ruble and Stout 1991)<br />
Sample N CE RO AC AE AC-CE AE-RO<br />
UG/Grad<br />
Business<br />
Majors<br />
253 .37 .59 .61 .58 .48 .60<br />
LSI was randomized, but in different order than KLSI <strong>3.1</strong>. Time between tests was 5 weeks. Kappa coeffi cient was<br />
.36, placing 53% of respondents in the same category on retest.<br />
16 LSI Technical Manual