Landbauforschung vTI Agriculture and Forestry ... - 1. Januar 2008
Landbauforschung vTI Agriculture and Forestry ... - 1. Januar 2008
Landbauforschung vTI Agriculture and Forestry ... - 1. Januar 2008
Create successful ePaper yourself
Turn your PDF publications into a flip-book with our unique Google optimized e-Paper software.
U. Dämmgen, J. Schulz, H. Kleine Klausing, N. J. Hutchings, H.-D. Haenel, C. Rösemann / <strong>L<strong>and</strong>bauforschung</strong> - <strong>vTI</strong><br />
<strong>Agriculture</strong> <strong>and</strong> <strong>Forestry</strong> Research 3 2012 (62)83-96<br />
The national overall MCR for pigs is calculated as<br />
weighted mean for sows (with litter), weaners, finishing<br />
pigs <strong>and</strong> boars.<br />
4 Results<br />
4.1 National mean methane emission factors <strong>and</strong> methane<br />
conversion ratios<br />
For the years 1994, 2001 <strong>and</strong> 2007, full census data (animal<br />
numbers <strong>and</strong> farm structure survey data) were available.<br />
For the feeding regimes put into practice in the respective<br />
region <strong>and</strong> year, the CH 4 emission factors (emissions per<br />
place <strong>and</strong> year) <strong>and</strong> CH 4 conversion ratios (MCR) were calculated<br />
for the four st<strong>and</strong>ard animals, see Chapter 3.2. The<br />
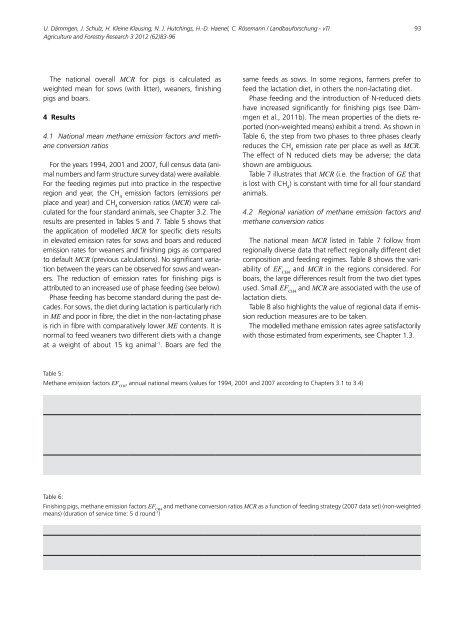
results are presented in Tables 5 <strong>and</strong> 7. Table 5 shows that<br />
the application of modelled MCR for specific diets results<br />
in elevated emission rates for sows <strong>and</strong> boars <strong>and</strong> reduced<br />
emission rates for weaners <strong>and</strong> finishing pigs as compared<br />
to default MCR (previous calculations). No significant variation<br />
between the years can be observed for sows <strong>and</strong> weaners.<br />
The reduction of emission rates for finishing pigs is<br />
attributed to an increased use of phase feeding (see below).<br />
Phase feeding has become st<strong>and</strong>ard during the past decades.<br />
For sows, the diet during lactation is particularly rich<br />
in ME <strong>and</strong> poor in fibre, the diet in the non-lactating phase<br />
is rich in fibre with comparatively lower ME contents. It is<br />
normal to feed weaners two different diets with a change<br />
at a weight of about 15 kg animal -1 . Boars are fed the<br />
same feeds as sows. In some regions, farmers prefer to<br />
feed the lactation diet, in others the non-lactating diet.<br />
Phase feeding <strong>and</strong> the introduction of N-reduced diets<br />
have increased significantly for finishing pigs (see Dämmgen<br />
et al., 2011b). The mean properties of the diets reported<br />
(non-weighted means) exhibit a trend. As shown in<br />
Table 6, the step from two phases to three phases clearly<br />
reduces the CH 4 emission rate per place as well as MCR.<br />
The effect of N reduced diets may be adverse; the data<br />
shown are ambiguous.<br />
Table 7 illustrates that MCR (i.e. the fraction of GE that<br />
is lost with CH 4 ) is constant with time for all four st<strong>and</strong>ard<br />
animals.<br />
4.2 Regional variation of methane emission factors <strong>and</strong><br />
methane conversion ratios<br />
The national mean MCR listed in Table 7 follow from<br />
regionally diverse data that reflect regionally different diet<br />
composition <strong>and</strong> feeding regimes. Table 8 shows the variability<br />
of EF CH4 <strong>and</strong> MCR in the regions considered. For<br />
boars, the large differences result from the two diet types<br />
used. Small EF CH4 <strong>and</strong> MCR are associated with the use of<br />
lactation diets.<br />
Table 8 also highlights the value of regional data if emission<br />
reduction measures are to be taken.<br />
The modelled methane emission rates agree satisfactorily<br />
with those estimated from experiments, see Chapter <strong>1.</strong>3.<br />
Table 5:<br />
Methane emission factors EF , annual national means (values for 1994, 2001 <strong>and</strong> 2007 according to Chapters 3.1 to 3.4)<br />
CH4<br />
1994 2001 2007 previous calculations unit<br />
modifiedA inventoryB sows (including suckling piglets) 2.20 2.22 2.23 2.08 2.13 kg place-1 a-1 CH4 weaners 0.31 0.32 0.31 0.42 0.43 kg place-1 a-1 CH4 finishing pigs 0.96 0.93 0.90 <strong>1.</strong>17 <strong>1.</strong>32 kg place-1 a-1 CH4 boars 2.08 2.07 <strong>1.</strong>98 <strong>1.</strong>75 <strong>1.</strong>73 kg place-1 a-1 CH4 A modified diets <strong>and</strong> feeding strategies as in Dämmgen et al. (2011b), but use of IPCC (1996) default MCR of 6 kJ MJ-<strong>1.</strong><br />
B using the methodology described in Rösemann et al. (2011) with constant feed <strong>and</strong> feeding strategies<br />
Table 6:<br />
Finishing pigs, methane emission factors EF <strong>and</strong> methane conversion ratios MCR as a function of feeding strategy (2007 data set) (non-weighted<br />
CH4<br />
means) (duration of service time: 5 d round-1 )<br />
Feed type A 1 2S 2R 3S 3R unit<br />
EF CH4 <strong>1.</strong>04 0.97 <strong>1.</strong>03 0.82 0.79 kg place -1 a -1 CH 4<br />
MCR 5.3 4.8 5.2 4.2 4.0 kJ MJ -1<br />
A 1: single phase feeding; 2S: two phase feeding, st<strong>and</strong>ard diet; 2R: two phase feeding, N <strong>and</strong> P reduced diet; 3S: three phase feeding, st<strong>and</strong>ard diet; 3R: three phase feeding, N <strong>and</strong> P reduced diet<br />
93


