Landbauforschung vTI Agriculture and Forestry ... - 1. Januar 2008
Landbauforschung vTI Agriculture and Forestry ... - 1. Januar 2008
Landbauforschung vTI Agriculture and Forestry ... - 1. Januar 2008

Create successful ePaper yourself
Turn your PDF publications into a flip-book with our unique Google optimized e-Paper software.
A. Berk <strong>and</strong> F. Weißmann / <strong>L<strong>and</strong>bauforschung</strong> - <strong>vTI</strong> <strong>Agriculture</strong> <strong>and</strong> <strong>Forestry</strong> Research 3 2012 (62)117-128 123<br />
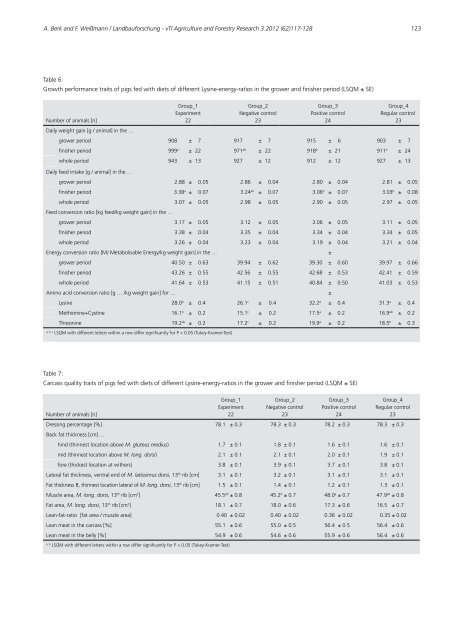
Table 6:<br />
Growth performance traits of pigs fed with diets of different Lysine-energy-ratios in the grower <strong>and</strong> finisher period (LSQM ± SE)<br />
Group_1<br />
Group_2<br />
Group_3<br />
Group_4<br />
Experiment<br />
Negative control<br />
Positive control<br />
Regular control<br />
Number of animals [n]<br />
Daily weight gain [g / animal] in the …<br />
22<br />
23<br />
24<br />
23<br />
grower period 908 ± 7 917 ± 7 915 ± 6 903 ± 7<br />
finisher period 999a ± 22 971ab ± 22 918b ± 21 911b ± 24<br />
whole period 943 ± 13 927 ± 12 912 ± 12 927 ± 13<br />
Daily feed intake [g / animal] in the …<br />
grower period 2.88 ± 0.05 2.86 ± 0.04 2.80 ± 0.04 2.81 ± 0.05<br />
finisher period 3.38a ± 0.07 3.24ab ± 0.07 3.06b ± 0.07 3.03b ± 0.08<br />
whole period<br />
Feed conversion ratio [kg feed/kg weight gain] in the …<br />
3.07 ± 0.05 2.98 ± 0.05 2.90 ± 0.05 2.97 ± 0.05<br />
grower period 3.17 ± 0.05 3.12 ± 0.05 3.06 ± 0.05 3.11 ± 0.05<br />
finisher period 3.38 ± 0.04 3.35 ± 0.04 3.34 ± 0.04 3.34 ± 0.05<br />
whole period 3.26 ± 0.04 3.23 ± 0.04 3.19 ± 0.04 3.21 ± 0.04<br />
Energy conversion ratio [MJ Metabolisable Energy/kg weight gain] in the … ±<br />
grower period 40.50 ± 0.63 39.94 ± 0.62 39.30 ± 0.60 39.97 ± 0.66<br />
finisher period 43.26 ± 0.55 42.56 ± 0.55 42.68 ± 0.53 42.41 ± 0.59<br />
whole period 4<strong>1.</strong>64 ± 0.53 4<strong>1.</strong>15 ± 0.51 40.84 ± 0.50 4<strong>1.</strong>03 ± 0.53<br />
Amino acid conversion ratio [g … /kg weight gain] for … ±<br />
Lysine 28.0b ± 0.4 26.1c ± 0.4 32.2a ± 0.4 3<strong>1.</strong>3a ± 0.4<br />
Methionine+Cystine 16.1b ± 0.2 15.1c ± 0.2 17.5a ± 0.2 16.9ab ± 0.2<br />
Threonine 19.2ab ± 0.2 17.2c ± 0.2 19.9a ± 0.2 18.5b ± 0.3<br />
a, b, c LSQM with different letters within a row differ significantly for P < 0.05 (Tukey-Kramer-Test)<br />
Table 7:<br />
Carcass quality traits of pigs fed with diets of different Lysine-energy-ratios in the grower <strong>and</strong> finisher period (LSQM ± SE)<br />
Group_1<br />
Group_2<br />
Group_3<br />
Group_4<br />
Experiment Negative control Positive control Regular control<br />
Number of animals [n]<br />
22<br />
23<br />
24<br />
23<br />
Dressing percentage [%]<br />
Back fat thickness [cm] …<br />
78.1 ± 0.30 78.3 ± 0.30 78.2 ± 0.30 78.3 ± 0.30<br />
hind (thinnest location above M. gluteus medius) <strong>1.</strong>7 ± 0.10 <strong>1.</strong>8 ± 0.10 <strong>1.</strong>6 ± 0.10 <strong>1.</strong>6 ± 0.10<br />
mid (thinnest location above M. long. dorsi) 2.1 ± 0.10 2.1 ± 0.10 2.0 ± 0.10 <strong>1.</strong>9 ± 0.10<br />
fore (thickest location at withers) 3.8 ± 0.10 3.9 ± 0.10 3.7 ± 0.10 3.8 ± 0.10<br />
Lateral fat thickness, ventral end of M. latissimus dorsi, 13th rib [cm] 3.1 ± 0.10 3.2 ± 0.10 3.1 ± 0.10 3.1 ± 0.10<br />
Fat thickness B, thinnest location lateral of M. long. dorsi, 13th rib [cm] <strong>1.</strong>5 ± 0.10 <strong>1.</strong>4 ± 0.10 <strong>1.</strong>2 ± 0.10 <strong>1.</strong>3 ± 0.10<br />
Muscle area, M. long. dorsi, 13th rib [cm2 ] 45.5ab ± 0.80 45.2b ± 0.70 48.0a ± 0.70 47.9ab ± 0.80<br />
Fat area, M. long. dorsi, 13th rib [cm2 ] 18.1 ± 0.70 18.0 ± 0.60 17.3 ± 0.60 16.5 ± 0.70<br />
Lean-fat-ratio [fat area / muscle area] 0.40 ± 0.02 0.40 ± 0.02 0.36 ± 0.02 0.35 ± 0.02<br />
Lean meat in the carcass [%] 55.1 ± 0.60 55.0 ± 0.50 56.4 ± 0.50 56.4 ± 0.60<br />
Lean meat in the belly [%] 54.9 ± 0.60 54.6 ± 0.60 55.9 ± 0.60 56.4 ± 0.60<br />
a, b LSQM with different letters within a row differ significantly for P < 0.05 (Tukey-Kramer-Test)