Landbauforschung vTI Agriculture and Forestry ... - 1. Januar 2008
Landbauforschung vTI Agriculture and Forestry ... - 1. Januar 2008
Landbauforschung vTI Agriculture and Forestry ... - 1. Januar 2008

You also want an ePaper? Increase the reach of your titles
YUMPU automatically turns print PDFs into web optimized ePapers that Google loves.
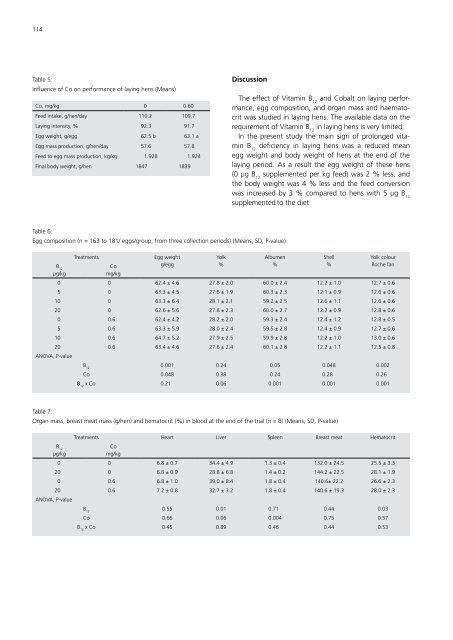
114<br />
Table 5:<br />
Influence of Co on performance of laying hens (Means)<br />
Co, mg/kg 0 0.60<br />
Feed intake, g/hen/day 110.2 109.7<br />
Laying intensity, % 92.3 9<strong>1.</strong>7<br />
Egg weight, g/egg 62.5 b 63.1 a<br />
Egg mass production, g/hen/day 57.6 57.8<br />
Feed to egg mass production, kg/kg <strong>1.</strong>928 <strong>1.</strong>924<br />
Final body weight, g/hen 1847 1839<br />
Discussion<br />
Table 6:<br />
Egg composition (n = 163 to 181/ eggs/group, from three collection periods) (Means, SD, P-value)<br />
The effect of Vitamin B 12 <strong>and</strong> Cobalt on laying performance,<br />
egg composition, <strong>and</strong> organ mass <strong>and</strong> haematocrit<br />
was studied in laying hens. The available data on the<br />
requirement of Vitamin B 12 in laying hens is very limited.<br />
In the present study the main sign of prolonged vitamin<br />
B 12 deficiency in laying hens was a reduced mean<br />
egg weight <strong>and</strong> body weight of hens at the end of the<br />
laying period. As a result the egg weight of these hens<br />
(0 μg B 12 supplemented per kg feed) was 2 % less, <strong>and</strong><br />
the body weight was 4 % less <strong>and</strong> the feed conversion<br />
was increased by 3 % compared to hens with 5 μg B 12<br />
supplemented to the diet.<br />
Treatments Egg weight<br />
Yolk<br />
Albumen<br />
Shell<br />
Yolk colour<br />
B12 Co<br />
g/egg<br />
%<br />
%<br />
%<br />
Roche fan<br />
μg/kg<br />
mg/kg<br />
0 0 62.4 ± 4.6 27.8 ± 2.0 60.0 ± 2.4 12.2 ± <strong>1.</strong>0 12.7 ± 0.6<br />
5 0 63.3 ± 4.5 27.6 ± <strong>1.</strong>9 60.3 ± 2.3 12.1 ± 0.9 12.6 ± 0.6<br />
10 0 63.3 ± 6.4 28.1 ± 2.1 59.2 ± 2.5 12.6 ± <strong>1.</strong>1 12.6 ± 0.6<br />
20 0 62.6 ± 5.6 27.8 ± 2.3 60.0 ± 2.7 12.2 ± 0.9 12.8 ± 0.6<br />
0 0.6 62.4 ± 4.2 28.2 ± 2.0 59.3 ± 2.4 12.4 ± <strong>1.</strong>2 12.8 ± 0.5<br />
5 0.6 63.3 ± 5.9 28.0 ± 2.4 59.5 ± 2.8 12.4 ± 0.9 12.7 ± 0.6<br />
10 0.6 64.7 ± 5.2 27.9 ± 2.5 59.9 ± 2.8 12.2 ± <strong>1.</strong>0 13.0 ± 0.6<br />
20<br />
ANOVA, P-value<br />
0.6 63.4 ± 4.6 27.6 ± 2.4 60.1 ± 2.8 12.2 ± <strong>1.</strong>1 12.5 ± 0.8<br />
B12 0.001 0.24 0.05 0.048 0.002<br />
Co 0.048 0.38 0.24 0.280 0.260<br />
B x Co 12 0.210 0.06 0.001 0.001 0.001<br />
Table 7:<br />
Organ mass, breast meat mass (g/hen) <strong>and</strong> hematocrit (%) in blood at the end of the trial (n = 8) (Means, SD, P-value)<br />
Treatments Heart Liver Spleen Breast meat Hematocrit<br />
B12 Co<br />
μg/kg<br />
mg/kg<br />
0 0 6.8 ± 0.7 34.4 ± 4.9 <strong>1.</strong>3 ± 0.4 132.0 ± 24.5 25.5 ± 3.3<br />
20 0 6.8 ± 0.9 28.8 ± 6.8 <strong>1.</strong>4 ± 0.2 144.2 ± 22.5 28.1 ± <strong>1.</strong>9<br />
0 0.6 6.8 ± <strong>1.</strong>0 39.0 ± 8.4 <strong>1.</strong>8 ± 0.4 140.6± 22.2 26.6 ± 2.3<br />
20<br />
ANOVA, P-value<br />
0.6 7.2 ± 0.8 32.7 ± 3.2 <strong>1.</strong>8 ± 0.4 140.6 ± 19.3 28.0 ± 2.3<br />
B12 0.55 0.01 0.710 0.44 0.03<br />
Co 0.66 0.06 0.004 0.75 0.57<br />
B x Co 12 0.45 0.89 0.460 0.44 0.53