Eighth Condensed Phase and Interfacial Molecular Science (CPIMS)
Eighth Condensed Phase and Interfacial Molecular Science (CPIMS)
Eighth Condensed Phase and Interfacial Molecular Science (CPIMS)

You also want an ePaper? Increase the reach of your titles
YUMPU automatically turns print PDFs into web optimized ePapers that Google loves.
Integrated O 2 PSD (ML)<br />
Integrated O 2 PSD (ML)<br />
0.1<br />
0.08<br />
0.06<br />
0.04<br />
0.02<br />
0<br />
0.06<br />
0.05<br />
0.04<br />
0.03<br />
0.02<br />
0.01<br />
a)<br />
b)<br />
18 O2<br />
16 O 18 O<br />
16 O2 (x 0.2)<br />
0<br />
0 100 200 300 400 500 600<br />
T<br />
anneal<br />
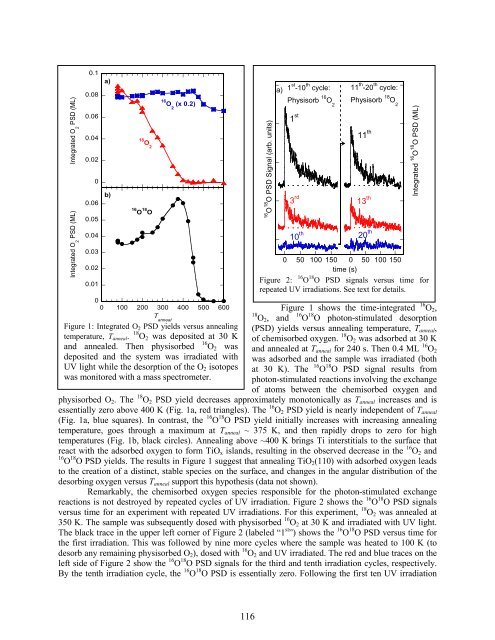
Figure 1: Integrated O2 PSD yields versus annealing<br />
temperature, Tanneal. 18 O2 was deposited at 30 K<br />
<strong>and</strong> annealed. Then physisorbed 16 O2 was<br />
deposited <strong>and</strong> the system was irradiated with<br />
UV light while the desorption of the O2 isotopes<br />
was monitored with a mass spectrometer.<br />
11 th -20 th cycle:<br />
Physisorb 18 O<br />
2<br />
Figure 1 shows the time-integrated 16 O2,<br />
18 O2, <strong>and</strong> 16 O 18 O photon-stimulated desorption<br />
(PSD) yields versus annealing temperature, Tanneal,<br />
of chemisorbed oxygen. 18 O2 was adsorbed at 30 K<br />
<strong>and</strong> annealed at Tanneal for 240 s. Then 0.4 ML 16 O2<br />
was adsorbed <strong>and</strong> the sample was irradiated (both<br />
at 30 K). The 16 O 18 O PSD signal results from<br />
photon-stimulated reactions involving the exchange<br />
of atoms between the chemisorbed oxygen <strong>and</strong><br />
physisorbed O2. The 18 O2 PSD yield decreases approximately monotonically as Tanneal increases <strong>and</strong> is<br />
essentially zero above 400 K (Fig. 1a, red triangles). The 16 O2 PSD yield is nearly independent of Tanneal<br />
(Fig. 1a, blue squares). In contrast, the 16 O 18 O PSD yield initially increases with increasing annealing<br />
temperature, goes through a maximum at Tanneal ~ 375 K, <strong>and</strong> then rapidly drops to zero for high<br />
temperatures (Fig. 1b, black circles). Annealing above ~400 K brings Ti interstitials to the surface that<br />
react with the adsorbed oxygen to form TiOx isl<strong>and</strong>s, resulting in the observed decrease in the 16 O2 <strong>and</strong><br />
16 O 18 O PSD yields. The results in Figure 1 suggest that annealing TiO2(110) with adsorbed oxygen leads<br />
to the creation of a distinct, stable species on the surface, <strong>and</strong> changes in the angular distribution of the<br />
desorbing oxygen versus Tanneal support this hypothesis (data not shown).<br />
Remarkably, the chemisorbed oxygen species responsible for the photon-stimulated exchange<br />
reactions is not destroyed by repeated cycles of UV irradiation. Figure 2 shows the 16 O 18 O PSD signals<br />
versus time for an experiment with repeated UV irradiations. For this experiment, 18 O2 was annealed at<br />
350 K. The sample was subsequently dosed with physisorbed 16 O2 at 30 K <strong>and</strong> irradiated with UV light.<br />
The black trace in the upper left corner of Figure 2 (labeled “1 st ”) shows the 16 O 18 O PSD versus time for<br />
the first irradiation. This was followed by nine more cycles where the sample was heated to 100 K (to<br />
desorb any remaining physisorbed O2), dosed with 16 O2 <strong>and</strong> UV irradiated. The red <strong>and</strong> blue traces on the<br />
left side of Figure 2 show the 16 O 18 O PSD signals for the third <strong>and</strong> tenth irradiation cycles, respectively.<br />
By the tenth irradiation cycle, the 16 O 18 O PSD is essentially zero. Following the first ten UV irradiation<br />
116<br />
16 O 18 O PSD Signal (arb. units)<br />
1 st -10 th cycle:<br />
Physisorb 16 a)<br />
O<br />
2<br />
1 st<br />
3 rd<br />
10 th<br />
11 th<br />
13 th<br />
20 th<br />
Integrated 16 O 18 O PSD (ML)<br />
0 50 100 150 0 50 100 150<br />
time (s)<br />
Figure 2: 16 O 18 O PSD signals versus time for<br />
repeated UV irradiations. See text for details.