Annual Report 2011 - Magnitogorsk Iron & Steel Works ...
Annual Report 2011 - Magnitogorsk Iron & Steel Works ...
Annual Report 2011 - Magnitogorsk Iron & Steel Works ...

You also want an ePaper? Increase the reach of your titles
YUMPU automatically turns print PDFs into web optimized ePapers that Google loves.
<strong>2011</strong> /<br />
ANNUAL REPORT<br />
About Us Sales Markets<br />
Finances<br />
Risks<br />
Social Sphere<br />
Management<br />
Information<br />
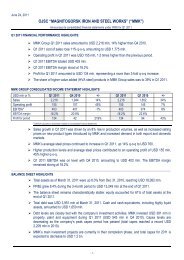
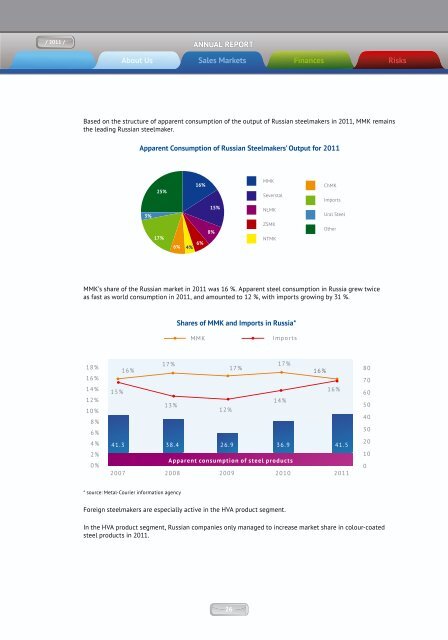
Based on the structure of apparent consumption of the output of Russian steelmakers in <strong>2011</strong>, MMK remains<br />
the leading Russian steelmaker.<br />
MMK’s share of the Russian market in <strong>2011</strong> was 16 %. Apparent steel consumption in Russia grew twice<br />
as fast as world consumption in <strong>2011</strong>, and amounted to 12 %, with imports growing by 31 %.<br />
18%<br />
16%<br />
14%<br />
12%<br />
10%<br />
8%<br />
6%<br />
4%<br />
2%<br />
0%<br />
15%<br />
2007<br />
16%<br />
* source: Metal-Courier information agency<br />
Apparent Consumption of Russian <strong>Steel</strong>makers’ Output for <strong>2011</strong><br />
3%<br />
25%<br />
17%<br />
17%<br />
6%<br />
13%<br />
Foreign steelmakers are especially active in the HVA product segment.<br />
4%<br />
16%<br />
6%<br />
ММК<br />
15%<br />
8%<br />
12%<br />
17%<br />
41.3 38.4<br />
26.9 36.9 41.5<br />
In the HVA product segment, Russian companies only managed to increase market share in colour-coated<br />
steel products in <strong>2011</strong>.<br />
ММК<br />
Severstal<br />
NLMK<br />
ZSMK<br />
NTMK<br />
Shares of MMK and Imports in Russia*<br />
Impor ts<br />
17%<br />
14%<br />
Apparent consumption of steel products<br />
16%<br />
ChMK<br />
Imports<br />
Ural <strong>Steel</strong><br />
Other<br />
16%<br />
2008 2009 2010 <strong>2011</strong><br />
80<br />
70<br />
60<br />
50<br />
40<br />
30<br />
20<br />
10<br />
0<br />
26 27<br />
Galvanized products<br />
22%<br />
Galvanized products<br />
67%<br />
20%<br />
Colour coated products<br />
12%<br />
21%<br />
HR plate<br />
13%<br />
-5%<br />
CR products<br />
40%<br />
11%<br />
Change in imports<br />
Change in consumption<br />
MMK felt the full effect of growing imports in <strong>2011</strong>. Our share in domestic sales of HVA products<br />
decreased across all categories, with the exception of colour coated products. Our 1 % increase in<br />
market share was driven by 32 % growth in sales of colour coated products in 2010. While sales of cold<br />
rolled products in <strong>2011</strong> increased by 8 % compared to 2010, this was not sufficient to prevent a 1 %<br />
decrease in market share.<br />
16%<br />
-14%<br />
Impact of Imports on the Domestic Market for HVA Products in <strong>2011</strong><br />
Colour coated products<br />
13% 14%<br />
Changes in MMK's Domestic HVA Products Market Share<br />
32%<br />
HR plate<br />
19% 17%<br />
-11%<br />
CR products<br />
22% 21%<br />
Change in MMK's domestic sales<br />
MMK’s largest domestic customers are from the pipe making, machine building and construction industries.<br />
Over the last five years their aggregate share in MMK’s sales has increased from 51 % to 68 %.<br />
8%<br />
MMK 2010 market share<br />
MMK <strong>2011</strong> market share