Annual Report 2011 - Magnitogorsk Iron & Steel Works ...
Annual Report 2011 - Magnitogorsk Iron & Steel Works ...
Annual Report 2011 - Magnitogorsk Iron & Steel Works ...

Create successful ePaper yourself
Turn your PDF publications into a flip-book with our unique Google optimized e-Paper software.
<strong>2011</strong> /<br />
ANNUAL REPORT<br />
About Us Sales Markets<br />
Finances<br />
Risks<br />
Social Sphere<br />
Management<br />
Information<br />
Financial review<br />
MMK Group Financial performance<br />
12,000<br />
10,000<br />
8,000<br />
6,000<br />
4,000<br />
2,000<br />
0<br />
Revenue, USD million<br />
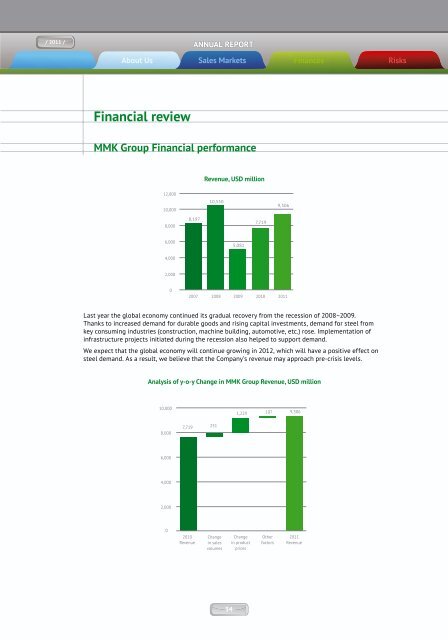
Last year the global economy continued its gradual recovery from the recession of 2008–2009.<br />
Thanks to increased demand for durable goods and rising capital investments, demand for steel from<br />
key consuming industries (construction, machine building, automotive, etc.) rose. Implementation of<br />
infrastructure projects initiated during the recession also helped to support demand.<br />
We expect that the global economy will continue growing in 2012, which will have a positive effect on<br />
steel demand. As a result, we believe that the Company’s revenue may approach pre-crisis levels.<br />
Analysis of y-o-y Change in MMK Group Revenue, USD million<br />
10,000<br />
8,000<br />
6,000<br />
4,000<br />
2,000<br />
0<br />
7,719<br />
8,197<br />
2010<br />
Revenue<br />
10,550<br />
2007 2008 2009 2010 <strong>2011</strong><br />
251<br />
Change<br />
in sales<br />
volumes<br />
5,081<br />
1,229<br />
Change<br />
in product<br />
prices<br />
7,719<br />
107<br />
Other<br />
factors<br />
9,306<br />
9,306<br />
<strong>2011</strong><br />
Revenue<br />
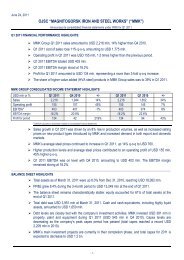
In <strong>2011</strong> revenue from sales stood at USD 9,306 million (up 21 % from 2010). Revenue rose mainly due to<br />
higher sales volumes and prices.<br />
<strong>2011</strong> Revenue Structure by Product Type<br />
Revenue Structure by Segment, USD million<br />
Segment 2010 <strong>2011</strong> Change Change, %<br />
<strong>Steel</strong> segment (Russia) 7,425 8,736 1,311 18 %<br />
<strong>Steel</strong> segment (Turkey) 137 417 280 204 %<br />
Coal segment 157 153 (4) –3 %<br />
Total 7,719 9,306 1,587 21 %<br />
The Russian steel segment accounts for the majority of MMK Group’s revenue (94 %). Significant<br />
progress on ramping up production in Turkey helped revenue from the Turkish steel segment increase<br />
by over 200 %, with the segment’s share of Group revenue reaching 4 %. The coal segment accounts for<br />
just around 2 % of Group revenue due to the fact that the majority of this segment’s output is consumed<br />
within the Group.<br />
34 35<br />
5%<br />
11%<br />
3%<br />
9%<br />
12%<br />
60%<br />
Flat products<br />
Long products<br />
Coated products<br />
Metalware<br />
Cold-formed products<br />
Others