Internal consistency of risk free rate and MRP in the CAPM
Internal consistency of risk free rate and MRP in the CAPM
Internal consistency of risk free rate and MRP in the CAPM
You also want an ePaper? Increase the reach of your titles
YUMPU automatically turns print PDFs into web optimized ePapers that Google loves.
Conclusion<br />
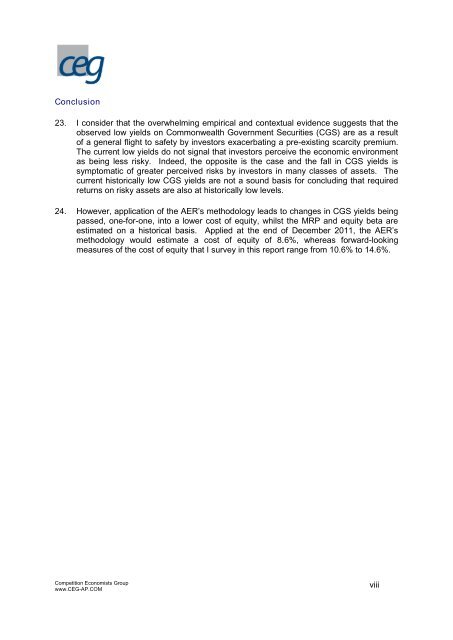
23. I consider that <strong>the</strong> overwhelm<strong>in</strong>g empirical <strong>and</strong> contextual evidence suggests that <strong>the</strong><br />
observed low yields on Commonwealth Government Securities (CGS) are as a result<br />
<strong>of</strong> a general flight to safety by <strong>in</strong>vestors exacerbat<strong>in</strong>g a pre-exist<strong>in</strong>g scarcity premium.<br />
The current low yields do not signal that <strong>in</strong>vestors perceive <strong>the</strong> economic environment<br />
as be<strong>in</strong>g less <strong>risk</strong>y. Indeed, <strong>the</strong> opposite is <strong>the</strong> case <strong>and</strong> <strong>the</strong> fall <strong>in</strong> CGS yields is<br />
symptomatic <strong>of</strong> greater perceived <strong>risk</strong>s by <strong>in</strong>vestors <strong>in</strong> many classes <strong>of</strong> assets. The<br />
current historically low CGS yields are not a sound basis for conclud<strong>in</strong>g that required<br />
returns on <strong>risk</strong>y assets are also at historically low levels.<br />
24. However, application <strong>of</strong> <strong>the</strong> AER’s methodology leads to changes <strong>in</strong> CGS yields be<strong>in</strong>g<br />
passed, one-for-one, <strong>in</strong>to a lower cost <strong>of</strong> equity, whilst <strong>the</strong> <strong>MRP</strong> <strong>and</strong> equity beta are<br />
estimated on a historical basis. Applied at <strong>the</strong> end <strong>of</strong> December 2011, <strong>the</strong> AER’s<br />
methodology would estimate a cost <strong>of</strong> equity <strong>of</strong> 8.6%, whereas forward-look<strong>in</strong>g<br />
measures <strong>of</strong> <strong>the</strong> cost <strong>of</strong> equity that I survey <strong>in</strong> this report range from 10.6% to 14.6%.<br />
Competition Economists Group<br />
www.CEG-AP.COM<br />
viii


