Internal consistency of risk free rate and MRP in the CAPM
Internal consistency of risk free rate and MRP in the CAPM
Internal consistency of risk free rate and MRP in the CAPM

You also want an ePaper? Increase the reach of your titles
YUMPU automatically turns print PDFs into web optimized ePapers that Google loves.
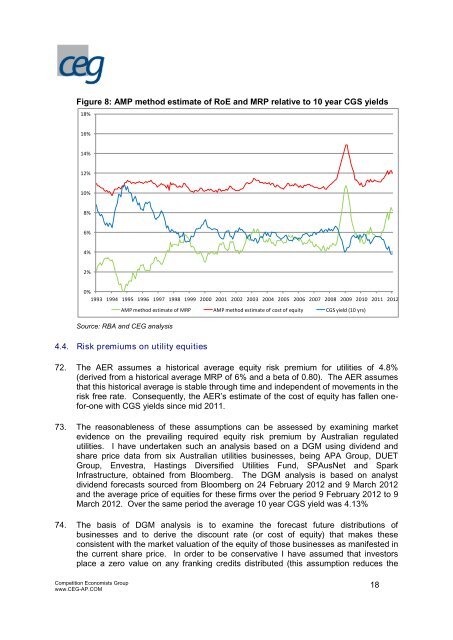
Figure 8: AMP method estimate <strong>of</strong> RoE <strong>and</strong> <strong>MRP</strong> relative to 10 year CGS yields<br />
18%<br />
16%<br />
14%<br />
12%<br />
10%<br />
8%<br />
6%<br />
4%<br />
2%<br />
0%<br />
1993 1994 1995 1996 1997 1998 1999 2000 2001 2002 2003 2004 2005 2006 2007 2008 2009 2010 2011 2012<br />
Source: RBA <strong>and</strong> CEG analysis<br />
4.4. Risk premiums on utility equities<br />
72. The AER assumes a historical average equity <strong>risk</strong> premium for utilities <strong>of</strong> 4.8%<br />
(derived from a historical average <strong>MRP</strong> <strong>of</strong> 6% <strong>and</strong> a beta <strong>of</strong> 0.80). The AER assumes<br />
that this historical average is stable through time <strong>and</strong> <strong>in</strong>dependent <strong>of</strong> movements <strong>in</strong> <strong>the</strong><br />
<strong>risk</strong> <strong>free</strong> <strong>rate</strong>. Consequently, <strong>the</strong> AER’s estimate <strong>of</strong> <strong>the</strong> cost <strong>of</strong> equity has fallen onefor-one<br />
with CGS yields s<strong>in</strong>ce mid 2011.<br />
73. The reasonableness <strong>of</strong> <strong>the</strong>se assumptions can be assessed by exam<strong>in</strong><strong>in</strong>g market<br />
evidence on <strong>the</strong> prevail<strong>in</strong>g required equity <strong>risk</strong> premium by Australian regulated<br />
utilities. I have undertaken such an analysis based on a DGM us<strong>in</strong>g dividend <strong>and</strong><br />
share price data from six Australian utilities bus<strong>in</strong>esses, be<strong>in</strong>g APA Group, DUET<br />
Group, Envestra, Hast<strong>in</strong>gs Diversified Utilities Fund, SPAusNet <strong>and</strong> Spark<br />
Infrastructure, obta<strong>in</strong>ed from Bloomberg. The DGM analysis is based on analyst<br />
dividend forecasts sourced from Bloomberg on 24 February 2012 <strong>and</strong> 9 March 2012<br />
<strong>and</strong> <strong>the</strong> average price <strong>of</strong> equities for <strong>the</strong>se firms over <strong>the</strong> period 9 February 2012 to 9<br />
March 2012. Over <strong>the</strong> same period <strong>the</strong> average 10 year CGS yield was 4.13%<br />
74. The basis <strong>of</strong> DGM analysis is to exam<strong>in</strong>e <strong>the</strong> forecast future distributions <strong>of</strong><br />
bus<strong>in</strong>esses <strong>and</strong> to derive <strong>the</strong> discount <strong>rate</strong> (or cost <strong>of</strong> equity) that makes <strong>the</strong>se<br />
consistent with <strong>the</strong> market valuation <strong>of</strong> <strong>the</strong> equity <strong>of</strong> those bus<strong>in</strong>esses as manifested <strong>in</strong><br />
<strong>the</strong> current share price. In order to be conservative I have assumed that <strong>in</strong>vestors<br />
place a zero value on any frank<strong>in</strong>g credits distributed (this assumption reduces <strong>the</strong><br />
Competition Economists Group<br />
www.CEG-AP.COM<br />
AMP method estimate <strong>of</strong> <strong>MRP</strong> AMP method estimate <strong>of</strong> cost <strong>of</strong> equity CGS yield (10 yrs)<br />
18