Internal consistency of risk free rate and MRP in the CAPM
Internal consistency of risk free rate and MRP in the CAPM
Internal consistency of risk free rate and MRP in the CAPM

You also want an ePaper? Increase the reach of your titles
YUMPU automatically turns print PDFs into web optimized ePapers that Google loves.
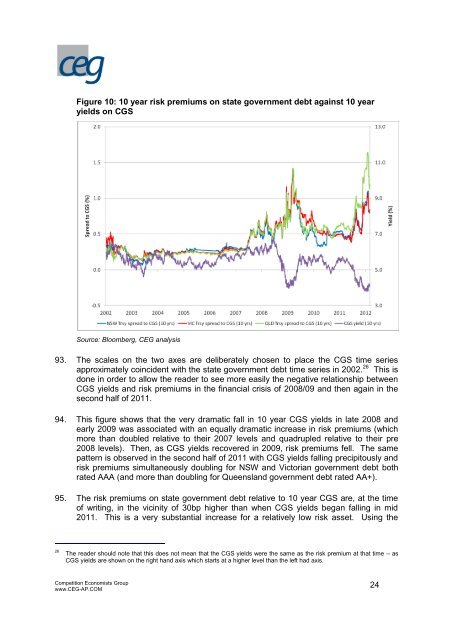
Figure 10: 10 year <strong>risk</strong> premiums on state government debt aga<strong>in</strong>st 10 year<br />
yields on CGS<br />
Source: Bloomberg, CEG analysis<br />
93. The scales on <strong>the</strong> two axes are delibe<strong>rate</strong>ly chosen to place <strong>the</strong> CGS time series<br />
approximately co<strong>in</strong>cident with <strong>the</strong> state government debt time series <strong>in</strong> 2002. 26 This is<br />
done <strong>in</strong> order to allow <strong>the</strong> reader to see more easily <strong>the</strong> negative relationship between<br />
CGS yields <strong>and</strong> <strong>risk</strong> premiums <strong>in</strong> <strong>the</strong> f<strong>in</strong>ancial crisis <strong>of</strong> 2008/09 <strong>and</strong> <strong>the</strong>n aga<strong>in</strong> <strong>in</strong> <strong>the</strong><br />
second half <strong>of</strong> 2011.<br />
94. This figure shows that <strong>the</strong> very dramatic fall <strong>in</strong> 10 year CGS yields <strong>in</strong> late 2008 <strong>and</strong><br />
early 2009 was associated with an equally dramatic <strong>in</strong>crease <strong>in</strong> <strong>risk</strong> premiums (which<br />
more than doubled relative to <strong>the</strong>ir 2007 levels <strong>and</strong> quadrupled relative to <strong>the</strong>ir pre<br />
2008 levels). Then, as CGS yields recovered <strong>in</strong> 2009, <strong>risk</strong> premiums fell. The same<br />
pattern is observed <strong>in</strong> <strong>the</strong> second half <strong>of</strong> 2011 with CGS yields fall<strong>in</strong>g precipitously <strong>and</strong><br />
<strong>risk</strong> premiums simultaneously doubl<strong>in</strong>g for NSW <strong>and</strong> Victorian government debt both<br />
<strong>rate</strong>d AAA (<strong>and</strong> more than doubl<strong>in</strong>g for Queensl<strong>and</strong> government debt <strong>rate</strong>d AA+).<br />
95. The <strong>risk</strong> premiums on state government debt relative to 10 year CGS are, at <strong>the</strong> time<br />
<strong>of</strong> writ<strong>in</strong>g, <strong>in</strong> <strong>the</strong> vic<strong>in</strong>ity <strong>of</strong> 30bp higher than when CGS yields began fall<strong>in</strong>g <strong>in</strong> mid<br />
2011. This is a very substantial <strong>in</strong>crease for a relatively low <strong>risk</strong> asset. Us<strong>in</strong>g <strong>the</strong><br />
26 The reader should note that this does not mean that <strong>the</strong> CGS yields were <strong>the</strong> same as <strong>the</strong> <strong>risk</strong> premium at that time – as<br />
CGS yields are shown on <strong>the</strong> right h<strong>and</strong> axis which starts at a higher level than <strong>the</strong> left had axis.<br />
Competition Economists Group<br />
www.CEG-AP.COM<br />
24