Internal consistency of risk free rate and MRP in the CAPM
Internal consistency of risk free rate and MRP in the CAPM
Internal consistency of risk free rate and MRP in the CAPM

Create successful ePaper yourself
Turn your PDF publications into a flip-book with our unique Google optimized e-Paper software.
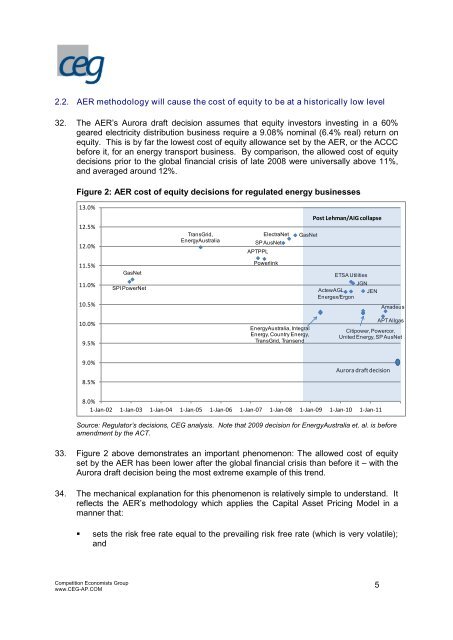
2.2. AER methodology will cause <strong>the</strong> cost <strong>of</strong> equity to be at a historically low level<br />
32. The AER’s Aurora draft decision assumes that equity <strong>in</strong>vestors <strong>in</strong>vest<strong>in</strong>g <strong>in</strong> a 60%<br />
geared electricity distribution bus<strong>in</strong>ess require a 9.08% nom<strong>in</strong>al (6.4% real) return on<br />
equity. This is by far <strong>the</strong> lowest cost <strong>of</strong> equity allowance set by <strong>the</strong> AER, or <strong>the</strong> ACCC<br />
before it, for an energy transport bus<strong>in</strong>ess. By comparison, <strong>the</strong> allowed cost <strong>of</strong> equity<br />
decisions prior to <strong>the</strong> global f<strong>in</strong>ancial crisis <strong>of</strong> late 2008 were universally above 11%,<br />
<strong>and</strong> averaged around 12%.<br />
Figure 2: AER cost <strong>of</strong> equity decisions for regulated energy bus<strong>in</strong>esses<br />
13.0%<br />
12.5%<br />
12.0%<br />
11.5%<br />
11.0%<br />
10.5%<br />
10.0%<br />
9.5%<br />
9.0%<br />
8.5%<br />
SPI PowerNet<br />
Source: Regulator’s decisions, CEG analysis. Note that 2009 decision for EnergyAustralia et. al. is before<br />
amendment by <strong>the</strong> ACT.<br />
33. Figure 2 above demonst<strong>rate</strong>s an important phenomenon: The allowed cost <strong>of</strong> equity<br />
set by <strong>the</strong> AER has been lower after <strong>the</strong> global f<strong>in</strong>ancial crisis than before it – with <strong>the</strong><br />
Aurora draft decision be<strong>in</strong>g <strong>the</strong> most extreme example <strong>of</strong> this trend.<br />
34. The mechanical explanation for this phenomenon is relatively simple to underst<strong>and</strong>. It<br />
reflects <strong>the</strong> AER’s methodology which applies <strong>the</strong> Capital Asset Pric<strong>in</strong>g Model <strong>in</strong> a<br />
manner that:<br />
� sets <strong>the</strong> <strong>risk</strong> <strong>free</strong> <strong>rate</strong> equal to <strong>the</strong> prevail<strong>in</strong>g <strong>risk</strong> <strong>free</strong> <strong>rate</strong> (which is very volatile);<br />
<strong>and</strong><br />
Competition Economists Group<br />
www.CEG-AP.COM<br />
GasNet<br />
TransGrid,<br />
EnergyAustralia<br />
SP AusNet<br />
APTPPL<br />
ElectraNet GasNet<br />
Powerl<strong>in</strong>k<br />
EnergyAustralia, Integral<br />
Energy, Country Energy,<br />
TransGrid, Transend<br />
Post Lehman/AIG collapse<br />
ETSA Utilities<br />
ActewAGL<br />
Energex/Ergon<br />
JGN<br />
JEN<br />
Citipower, Powercor,<br />
United Energy, SP AusNet<br />
Aurora draft decision<br />
8.0%<br />
1-Jan-02 1-Jan-03 1-Jan-04 1-Jan-05 1-Jan-06 1-Jan-07 1-Jan-08 1-Jan-09 1-Jan-10 1-Jan-11<br />
5<br />
Amadeus<br />
APT Allgas