MUDDY FEET - Auckland Regional Council
MUDDY FEET - Auckland Regional Council
MUDDY FEET - Auckland Regional Council

Create successful ePaper yourself
Turn your PDF publications into a flip-book with our unique Google optimized e-Paper software.
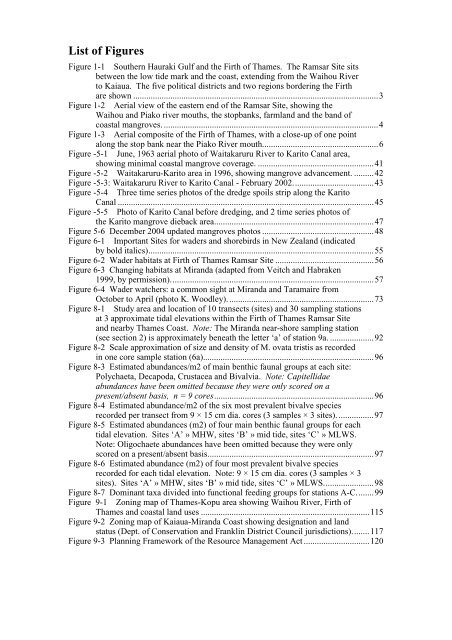
List of Figures<br />
Figure 1-1 Southern Hauraki Gulf and the Firth of Thames. The Ramsar Site sits<br />
between the low tide mark and the coast, extending from the Waihou River<br />
to Kaiaua. The five political districts and two regions bordering the Firth<br />
are shown ................................................................................................................3<br />
Figure 1-2 Aerial view of the eastern end of the Ramsar Site, showing the<br />
Waihou and Piako river mouths, the stopbanks, farmland and the band of<br />
coastal mangroves. ..................................................................................................4<br />
Figure 1-3 Aerial composite of the Firth of Thames, with a close-up of one point<br />
along the stop bank near the Piako River mouth.....................................................6<br />
Figure - 5-1 June, 1963 aerial photo of Waitakaruru River to Karito Canal area,<br />
showing minimal coastal mangrove coverage. .....................................................41<br />
Figure - 5-2 Waitakaruru-Karito area in 1996, showing mangrove advancement. .........42<br />
Figure - 5-3: Waitakaruru River to Karito Canal - February 2002.....................................43<br />
Figure - 5-4 Three time series photos of the dredge spoils strip along the Karito<br />
Canal .....................................................................................................................45<br />
Figure - 5-5 Photo of Karito Canal before dredging, and 2 time series photos of<br />
the Karito mangrove dieback area.........................................................................47<br />
Figure 5-6 December 2004 updated mangroves photos ...................................................48<br />
Figure 6-1 Important Sites for waders and shorebirds in New Zealand (indicated<br />
by bold italics).......................................................................................................55<br />
Figure 6-2 Wader habitats at Firth of Thames Ramsar Site .............................................56<br />
Figure 6-3 Changing habitats at Miranda (adapted from Veitch and Habraken<br />
1999, by permission).............................................................................................57<br />
Figure 6-4 Wader watchers: a common sight at Miranda and Taramaire from<br />
October to April (photo K. Woodley)...................................................................73<br />
Figure 8-1 Study area and location of 10 transects (sites) and 30 sampling stations<br />
at 3 approximate tidal elevations within the Firth of Thames Ramsar Site<br />
and nearby Thames Coast. Note: The Miranda near-shore sampling station<br />
(see section 2) is approximately beneath the letter ‘a’ of station 9a. ....................92<br />
Figure 8-2 Scale approximation of size and density of M. ovata tristis as recorded<br />
in one core sample station (6a)..............................................................................96<br />
Figure 8-3 Estimated abundances/m2 of main benthic faunal groups at each site:<br />
Polychaeta, Decapoda, Crustacea and Bivalvia. Note: Capitellidae<br />
abundances have been omitted because they were only scored on a<br />
present/absent basis, n = 9 cores.........................................................................96<br />
Figure 8-4 Estimated abundance/m2 of the six most prevalent bivalve species<br />
recorded per transect from 9 × 15 cm dia. cores (3 samples × 3 sites). ................97<br />
Figure 8-5 Estimated abundances (m2) of four main benthic faunal groups for each<br />
tidal elevation. Sites ‘A’ » MHW, sites ‘B’ » mid tide, sites ‘C’ » MLWS.<br />
Note: Oligochaete abundances have been omitted because they were only<br />
scored on a present/absent basis............................................................................97<br />
Figure 8-6 Estimated abundance (m2) of four most prevalent bivalve species<br />
recorded for each tidal elevation. Note: 9 × 15 cm dia. cores (3 samples × 3<br />
sites). Sites ‘A’ » MHW, sites ‘B’ » mid tide, sites ‘C’ » MLWS.......................98<br />
Figure 8-7 Dominant taxa divided into functional feeding groups for stations A-C........99<br />
Figure 9-1 Zoning map of Thames-Kopu area showing Waihou River, Firth of<br />
Thames and coastal land uses .............................................................................115<br />
Figure 9-2 Zoning map of Kaiaua-Miranda Coast showing designation and land<br />
status (Dept. of Conservation and Franklin District <strong>Council</strong> jurisdictions)........117<br />
Figure 9-3 Planning Framework of the Resource Management Act ..............................120