Prediction of emulsion properties from binder/emulsifier ... - Nynas
Prediction of emulsion properties from binder/emulsifier ... - Nynas
Prediction of emulsion properties from binder/emulsifier ... - Nynas

Create successful ePaper yourself
Turn your PDF publications into a flip-book with our unique Google optimized e-Paper software.
<strong>Prediction</strong> <strong>of</strong> <strong>emulsion</strong> <strong>properties</strong> <strong>from</strong> <strong>binder</strong>/<strong>emulsifier</strong> characteristics<br />
B.Eckmann<br />
AB <strong>Nynas</strong> Petroleum, Group Competence Center (GCC), Brussels, Belgium<br />
K. Van Nieuwenhuyze / T. Tanghe / P. Verlhac<br />
NYNAS NV, R&D Dept., Antwerpen, Belgium<br />
Technical Session : Development in Bituminous Products & Techniques<br />
Keywords : Emulsions, Testing, Cold Asphalt<br />
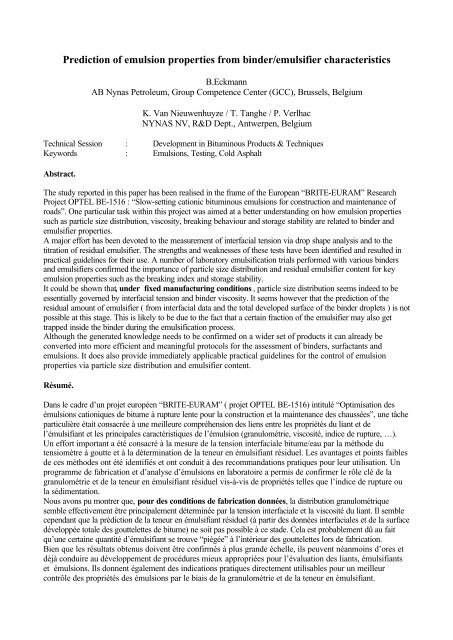
Abstract.<br />
The study reported in this paper has been realised in the frame <strong>of</strong> the European “BRITE-EURAM” Research<br />
Project OPTEL BE-1516 : “Slow-setting cationic bituminous <strong>emulsion</strong>s for construction and maintenance <strong>of</strong><br />
roads”. One particular task within this project was aimed at a better understanding on how <strong>emulsion</strong> <strong>properties</strong><br />
such as particle size distribution, viscosity, breaking behaviour and storage stability are related to <strong>binder</strong> and<br />
<strong>emulsifier</strong> <strong>properties</strong>.<br />
A major effort has been devoted to the measurement <strong>of</strong> interfacial tension via drop shape analysis and to the<br />
titration <strong>of</strong> residual <strong>emulsifier</strong>. The strengths and weaknesses <strong>of</strong> these tests have been identified and resulted in<br />
practical guidelines for their use. A number <strong>of</strong> laboratory emulsification trials performed with various <strong>binder</strong>s<br />
and <strong>emulsifier</strong>s confirmed the importance <strong>of</strong> particle size distribution and residual <strong>emulsifier</strong> content for key<br />
<strong>emulsion</strong> <strong>properties</strong> such as the breaking index and storage stability.<br />
It could be shown that, under fixed manufacturing conditions , particle size distribution seems indeed to be<br />
essentially governed by interfacial tension and <strong>binder</strong> viscosity. It seems however that the prediction <strong>of</strong> the<br />
residual amount <strong>of</strong> <strong>emulsifier</strong> ( <strong>from</strong> interfacial data and the total developed surface <strong>of</strong> the <strong>binder</strong> droplets ) is not<br />
possible at this stage. This is likely to be due to the fact that a certain fraction <strong>of</strong> the <strong>emulsifier</strong> may also get<br />
trapped inside the <strong>binder</strong> during the emulsification process.<br />
Although the generated knowledge needs to be confirmed on a wider set <strong>of</strong> products it can already be<br />
converted into more efficient and meaningful protocols for the assessment <strong>of</strong> <strong>binder</strong>s, surfactants and<br />
<strong>emulsion</strong>s. It does also provide immediately applicable practical guidelines for the control <strong>of</strong> <strong>emulsion</strong><br />
<strong>properties</strong> via particle size distribution and <strong>emulsifier</strong> content.<br />
Résumé.<br />
Dans le cadre d’un projet européen “BRITE-EURAM” ( projet OPTEL BE-1516) intitulé “Optimisation des<br />
émulsions cationiques de bitume à rupture lente pour la construction et la maintenance des chaussées”, une tâche<br />
particulière était consacrée à une meilleure compréhension des liens entre les propriétés du liant et de<br />
l’émulsifiant et les principales caractéristiques de l’émulsion (granulométrie, viscosité, indice de rupture, …).<br />
Un effort important a été consacré à la mesure de la tension interfaciale bitume/eau par la méthode du<br />
tensiomètre à goutte et à la détermination de la teneur en émulsifiant résiduel. Les avantages et points faibles<br />
de ces méthodes ont été identifiés et ont conduit à des recommandations pratiques pour leur utilisation. Un<br />
programme de fabrication et d’analyse d’émulsions en laboratoire a permis de confirmer le rôle clé de la<br />
granulométrie et de la teneur en émulsifiant résiduel vis-à-vis de propriétés telles que l’indice de rupture ou<br />
la sédimentation.<br />
Nous avons pu montrer que, pour des conditions de fabrication données, la distribution granulométrique<br />
semble effectivement être principalement déterminée par la tension interfaciale et la viscosité du liant. Il semble<br />
cependant que la prédiction de la teneur en émulsifiant résiduel (à partir des données interfaciales et de la surface<br />
développée totale des gouttelettes de bitume) ne soit pas possible à ce stade. Cela est probablement dû au fait<br />
qu’une certaine quantité d’émulsifiant se trouve “piégée” à l’intérieur des gouttelettes lors de fabrication.<br />
Bien que les résultats obtenus doivent être confirmés à plus grande échelle, ils peuvent néanmoins d’ores et<br />
déjà conduire au développement de procédures mieux appropriées pour l’évaluation des liants, émulsifiants<br />
et émulsions. Ils donnent également des indications pratiques directement utilisables pour un meilleur<br />
contrôle des propriétés des émulsions par le biais de la granulométrie et de la teneur en émulsifiant.
<strong>Prediction</strong> <strong>of</strong> <strong>emulsion</strong> <strong>properties</strong> <strong>from</strong> <strong>binder</strong>/<strong>emulsifier</strong> characteristics<br />
Introduction<br />
B.Eckmann<br />
AB <strong>Nynas</strong> Petroleum, Group Competence Center (GCC), Brussels, Belgium<br />
K. Van Nieuwenhuyze / T. Tanghe / P. Verlhac<br />
NYNAS NV, R&D Dept., Antwerpen, Belgium<br />
The purpose <strong>of</strong> the study reported here was to improve the understanding on how <strong>emulsion</strong> <strong>properties</strong><br />
such as particle size distribution, viscosity, breaking behaviour and storage stability are related to<br />
<strong>binder</strong> and <strong>emulsifier</strong> <strong>properties</strong>. It is however important to underline that this ambition was restricted<br />
to the prediction <strong>of</strong> <strong>emulsion</strong> <strong>properties</strong> under fixed manufacturing conditions.<br />
Starting basis – Original assumptions<br />
The work-programme and its adaptations have been aimed at the verification <strong>of</strong> a number <strong>of</strong> initial<br />
assumptions on how key <strong>emulsion</strong> <strong>properties</strong> are related to <strong>binder</strong> and <strong>emulsifier</strong> characteristics.<br />
These initial assumptions are summarised in Figure 1 and briefly explained hereafter :<br />
Emulsion viscosity should be mainly<br />
related to the volume concentration <strong>of</strong><br />
the <strong>binder</strong> and the particle size<br />
distribution (how the total <strong>binder</strong><br />
volume is split between droplets <strong>of</strong><br />
different sizes).<br />
The pH value (more precisely the<br />
<strong>of</strong>ten observed increase in comparison<br />
to the original pH <strong>of</strong> the water-phase)<br />
is supposed to be related to<br />
“exchanges” between the <strong>binder</strong> and<br />
the water-phase and should therefore<br />
be related to the amount <strong>of</strong> total<br />
created surface (specific surface area<br />
<strong>of</strong> the PSD) and specific <strong>binder</strong> and/or<br />
surfactant <strong>properties</strong>.<br />
The Breaking Index describes the<br />
behaviour <strong>of</strong> the <strong>emulsion</strong> as increasing<br />
Particle Size<br />
Distribution<br />
Residual Emulsifier<br />
Content<br />
Binder Content<br />
Binder/Waterphase<br />
Interactions<br />
Binder Rheology<br />
Binder Density<br />
Figure 1 : Original assumptions<br />
Emulsion Viscosity<br />
Increase in pH<br />
Breaking<br />
Index<br />
Storage<br />
Stability<br />
amounts <strong>of</strong> a silica filler are stirred into a fixed amount <strong>of</strong> <strong>emulsion</strong>. This process involves chemical<br />
reactions (increase in pH, migration <strong>of</strong> “free” surfactant to the filler, de-sorption <strong>of</strong> the surfactant<br />
present at the surface <strong>of</strong> the droplet ) as well as mechanical actions (deformation and coalescence <strong>of</strong><br />
the droplets under the applied shearing forces). Breaking index should therefore be affected by<br />
several interacting factors such as residual <strong>emulsifier</strong> content, pH value, particle sizes (small<br />
droplets being more difficult to “break” than large ones) and <strong>binder</strong> rheology.<br />
Storage Stability should be essentially conditioned by the amount <strong>of</strong> large particles and the density<br />
differential between the <strong>binder</strong> and the water-phase (Stoke’s law). The settlement <strong>of</strong> the largest<br />
particles may however also be affected by the overall “viscosity” <strong>of</strong> the <strong>emulsion</strong> which is<br />
conditioned by the particle size distribution as a whole. Due to the relatively high concentration <strong>of</strong><br />
the dispersed phase, particles do <strong>of</strong>ten collide and may coalesce, which leads to the formation <strong>of</strong>
larger droplets. These coalescence phenomena are conditioned by the amount <strong>of</strong> available<br />
<strong>emulsifier</strong> and its repartition between the interface and the water-phase. Particle size distribution<br />
and residual <strong>emulsifier</strong> content appear thus again as the major potential explanatory parameters.<br />
This analysis led to the conclusion that Particle Size Distribution ( PSD ) and Residual Emulsifier<br />
Content should be the key parameters to be considered. Furthermore, Interfacial Tension<br />
Characteristics were seen as key factors governing both parameters.<br />
Indeed, together with <strong>binder</strong> viscosity, interfacial tension (which depends on the nature and the<br />
“affinity “ <strong>of</strong> the used <strong>binder</strong> and surfactant) should be the main material parameter conditioning<br />
particle size distribution. The residual amount <strong>of</strong> <strong>emulsifier</strong> (difference between the original amount<br />
and the amount adsorbed at the interface) may theoretically be calculated <strong>from</strong> the total developed<br />
surface <strong>of</strong> the <strong>binder</strong> droplets (which is easily obtained <strong>from</strong> the PSD) and the “polar head surface<br />
area“ <strong>of</strong> the <strong>emulsifier</strong>. Also this last parameter may be derived <strong>from</strong> the so-called “adsorption<br />
isotherm” which describes the evolution <strong>of</strong> interfacial tension with increasing concentrations <strong>of</strong><br />
surfactant.<br />
These considerations have naturally led the research activities to be focused on the implementation<br />
and further development <strong>of</strong> specific test methods and on the verification <strong>of</strong> the originally made<br />
assumptions through the investigation <strong>of</strong> a number <strong>of</strong> laboratory made <strong>emulsion</strong>s.<br />
Interfacial tension measurements with a drop tensiometer<br />
The principle <strong>of</strong> the drop tensiometer<br />
method consists in deriving the interfacial<br />
tension (via the Laplace equation) <strong>from</strong> the<br />
digital analysis <strong>of</strong> the shape <strong>of</strong> a <strong>binder</strong><br />
droplet which is formed, by means <strong>of</strong> a<br />
syringe, in a cell containing the surfactant<br />
solution. The interest <strong>of</strong> the method is that a<br />
prior dilution <strong>of</strong> the <strong>binder</strong> is not required if<br />
measurements are done at a high enough<br />
temperature. A French company (IT<br />
Concept) has developed a suitable<br />
equipment for bituminous <strong>binder</strong>s which<br />
allows to work at <strong>binder</strong> temperatures up to<br />
90°C. The fact that this temperature is<br />
reasonably close to emulsification conditions<br />
and that possible artefacts due to the heavy dilution required by the Du Noüy ring method could be<br />
avoided have motivated our interest for this method in the frame <strong>of</strong> the OPTEL project. The<br />
extensive use <strong>of</strong> the equipment did however rapidly reveal a number <strong>of</strong> problems related to either<br />
the method in general or specific to bituminous <strong>binder</strong>s. Those could however be overcome and<br />
resulted in a number <strong>of</strong> practical recommendations which are briefly summarised hereafter :<br />
External pollution, by either surface active matters (e.g. sweat, ..) or other impurities which may<br />
fix themselves on the drop and alter the image analysis, must be avoided through very strict<br />
handling and cleaning precautions. Working at high temperatures for longer times may lead to a<br />
partial evaporation <strong>of</strong> the water-phase, hence to uncontrolled variations in the actual surfactant<br />
concentration. This difficulty could be overcome by the use <strong>of</strong> a cooled cover lid and frequent<br />
renewals <strong>of</strong> the surfactant solution.
Density <strong>of</strong> bituminous <strong>binder</strong>s at elevated temperature. The density differential between the <strong>binder</strong><br />
and the surfactant solution is the major factor conditioning the accuracy <strong>of</strong> the measurement. A<br />
special attention has therefore been given to the measurement <strong>of</strong> the density <strong>of</strong> bituminous <strong>binder</strong>s<br />
at elevated temperatures. An existing method ( Bingham pycnometer method, ASTM-D1480) has<br />
been adapted for that purpose.<br />
Stabilisation time. It has been constantly observed that, after the drop has been formed, a certain<br />
amount <strong>of</strong> time is required before the interfacial tension (γ ) reaches a stable value. This time is<br />
particularly important when the droplet is formed into pure water (no surfactant) and may easily<br />
exceed the hour. Stabilisation time as well as the difference between “instantaneous” and<br />
“stabilised” γ values are significantly reduced as a function <strong>of</strong> the nature and concentration <strong>of</strong><br />
surfactant. These phenomena are supposed to be caused by surface active bitumen compounds<br />
migrating to the surface and entering into competition with the surfactant molecules.<br />
Interpretation <strong>of</strong> adsorption isotherms<br />
A typical adsorption isotherm is shown in<br />
Figure 3. As the surfactant concentration<br />
increases, the interfacial tension decreases<br />
with an increasing slope. A sudden<br />
plateau is reached when the amount <strong>of</strong><br />
<strong>emulsifier</strong> reaches the “Critical Micellar<br />
Concentration” (CMC). This theoretical<br />
behaviour can be modelled by the “Von<br />
Szyszkowski” equation in which Γ ∞ is<br />
the maximum surface concentration (in<br />
moles/m²) <strong>of</strong> the <strong>emulsifier</strong> :<br />
⎛ c ⎞<br />
γ − γ = − R. T. Γ . ln⎜1+<br />
0<br />
∞ ⎟<br />
⎝ a ⎠<br />
Interfacial Tension (mN.m-1)<br />
50.0<br />
40.0<br />
30.0<br />
20.0<br />
10.0<br />
0.0<br />
ADSORPTION ISOTHERMS<br />
0.0001 0.001 0.01 0.1 1 10<br />
Log (c) (g/l)<br />
Figure 2<br />
"Instantaneous" values<br />
After stabilisation<br />
Γ ∞ is directly related to the slope <strong>of</strong> the adsorption isotherm at the CMC and allows to calculate the<br />
minimum surface occupied by the polar head at the interface.<br />
In the case <strong>of</strong> bituminous <strong>binder</strong>s and industrial <strong>emulsifier</strong>s, this theoretical interpretation is<br />
however made difficult by the presence <strong>of</strong> more than one species at the interface. Moreover, the<br />
used <strong>emulsifier</strong>s are complex and do <strong>of</strong>ten incorporate more than one type <strong>of</strong> molecule. This may<br />
explain why interfacial tension does <strong>of</strong>ten slightly increase again after the CMC, due to a selective<br />
de-sorption <strong>of</strong> some <strong>emulsifier</strong> or bitumen compounds (Fig. 2). The experimentally determined Γ ∞<br />
values and the corresponding minimum “surface area per polar head” are therefore affected by a<br />
certain uncertainty. At the high <strong>emulsifier</strong> concentrations (several times the CMC) used for slowsetting<br />
<strong>emulsion</strong>s, it is likely that the surface active bitumen compounds can hardly compete with<br />
the surfactant molecules. Our guess is therefore that the adequate Γ ∞ value to be considered is<br />
closest to the one determined <strong>from</strong> the “instantaneous” adsorption isotherm as this curve is less<br />
affected (especially at lower surfactant concentrations) by bitumen compounds. Unfortunately, it is<br />
much more difficult to get reliable “instantaneous” interfacial values than stabilised values !
Titration <strong>of</strong> residual <strong>emulsifier</strong><br />
The determination <strong>of</strong> the residual <strong>emulsifier</strong> has mostly been done with the “EPTON” colour<br />
titration method ( ISO 2871-2 or NFT 73-258 ). This method proved to be rather delicate as the<br />
colour change is sometimes difficult to detect and may be perceived differently by different<br />
operators. To ensure a sufficient accuracy, a number <strong>of</strong> precautions need to be taken, such as the use<br />
<strong>of</strong> an adequate ratio between the volume <strong>of</strong> the solution to be analysed and the volume <strong>of</strong> titrant. It<br />
is also recommended to keep solutions <strong>of</strong> known <strong>emulsifier</strong> concentration as a reference for the<br />
detection <strong>of</strong> the colour change. The major issues with regard to the determination <strong>of</strong> residual<br />
<strong>emulsifier</strong> content are however related to the separation <strong>of</strong> the water-phase <strong>from</strong> the original<br />
<strong>emulsion</strong>. This is done via centrifugation and requests the control <strong>of</strong> two parameters :<br />
- Centrifugation speed and duration need to be adjusted in such a way that one gets a clear<br />
water-phase without breaking the <strong>emulsion</strong>. Best results were obtained with a two steps<br />
process ( first separation under moderate acceleration followed by a more intensive<br />
centrifugation <strong>of</strong> the recuperated solution ). In all cases, the PSD <strong>of</strong> the remaining<br />
centrifuged <strong>emulsion</strong> should be checked so as to detect a possible bias due to coalescence.<br />
- Certain <strong>emulsifier</strong>s ( e.g. diamines ) tend to crystallise at ambient temperature and the<br />
formed crystals may stay in the centrifuged <strong>binder</strong> rich phase. Centrifugation should thus<br />
always be conducted at a temperature above the crystallisation point <strong>of</strong> the <strong>emulsifier</strong>.<br />
<strong>Prediction</strong> <strong>of</strong> residual <strong>emulsifier</strong> content<br />
From the total developed surface area (derived <strong>from</strong> the PSD ) and the measured amount <strong>of</strong> residual<br />
<strong>emulsifier</strong>, one may calculate the theoretical surface area (As) occupied by a surfactant molecule at the<br />
interface. This value can then be compared to the one derived <strong>from</strong> the adsorption isotherm. Although<br />
the As values are affected by some uncertainty (due to the cumulating <strong>of</strong> errors on PSD and on the<br />
titration) they were, except in a few cases, consistently found to be quite low in comparison to the<br />
values predicted <strong>from</strong> the “stabilised” adsorption isotherms. Supporting the earlier made interpretation<br />
<strong>of</strong> adsorption isotherms, the polar head areas predicted <strong>from</strong> “instantaneous” isotherms are much closer<br />
to the measured values. Polymer modification leads to higher specific surface areas (more fine<br />
particles) and lower residual <strong>emulsifier</strong> contents but to a lower relative surfactant consumption. The<br />
polar head surface area tends to increase ( Figure 3 ) ! Another interesting finding is related to the<br />
evolution <strong>of</strong> As with manufacturing conditions and original <strong>emulsifier</strong> content. As tends to decrease<br />
(more consumed <strong>emulsifier</strong>) when larger particles are created ( at lower rotation speeds or higher<br />
temperatures ). As is even more substantially decreased for higher initial amounts <strong>of</strong> surfactant ( 0.6%<br />
vs 0.3% ) (Figure 4). This suggests that some surfactant molecules may get « trapped » inside <strong>binder</strong><br />
droplets (formation <strong>of</strong> an inverted <strong>emulsion</strong>) during the emulsification process.<br />
Area <strong>of</strong> Polar Head [ A² ]<br />
160<br />
140<br />
120<br />
100<br />
80<br />
60<br />
40<br />
20<br />
0<br />
B017<br />
B017+EVA<br />
Area <strong>of</strong> Polar Head - 65% Binder - Polyamine<br />
B017+SBS<br />
B020<br />
B020+EVA<br />
B020+SBS<br />
Measured (mN.m-1) From "instantaneous" tension values (mN.m-1) From "stabilised" tension values (mN.m-1)<br />
Polar Head Area (A²)<br />
35<br />
30<br />
25<br />
20<br />
15<br />
10<br />
5<br />
0<br />
Area <strong>of</strong> Polar Head - Impact <strong>of</strong> Manufacturing Conditions<br />
Unmodified Bitumen / Polyamine<br />
165 °C 150°C 138°C<br />
138°C<br />
0.6% Emulsifier - 5000 rpm 0.6% Emulsifier - 8500 rpm<br />
0.3% Emulsifier - 5000 rpm 0.3% Emulsifier - 8500 rpm<br />
Figure 3 Figure 4
<strong>Prediction</strong> <strong>of</strong> Particle Size Distribution<br />
Figure 5 shows the total developed surface<br />
area in relation to the interfacial tension at<br />
saturation ( γsat = tension at surfactant<br />
concentrations above the CMC ). It is to be<br />
mentioned that the pure bitumen do all<br />
have a similar viscosity at emulsification<br />
temperature. The fact that they all fall more<br />
or less on the same line shows that the<br />
variations in <strong>binder</strong>/<strong>emulsifier</strong><br />
combinations are indeed reflected by the<br />
corresponding γsat values. The right trend<br />
( lower γsat leading to a higher specific<br />
surface ) is also observed for the polymer<br />
40000<br />
35000<br />
30000<br />
25000<br />
20000<br />
15000<br />
10000<br />
5000<br />
modified <strong>binder</strong>s. In this case, however, differences in<br />
viscosity explain (to a large extent) the fact that the<br />
lines are not confounded.<br />
Surface Area ( cm²/ml <strong>binder</strong> )<br />
0<br />
Specific Surface Area / Interfacial tension<br />
0 5 10 15 20<br />
Interfacial Tension ( g sat ) (mN.m-1)<br />
Figure 5<br />
Unmodified Bitumen - Polyamine<br />
Unmodified Bitumen - Diamine<br />
EVA modified Bitumen - Polyamine<br />
EVA modified Bitumen - Diamine<br />
SBS modified Bitumen - Polyamine<br />
SBS modified Bitumen - Diamine<br />
These findings comfort the assumption that (under given manufacturing conditions) interfacial tension<br />
and <strong>binder</strong> viscosity, irrespective <strong>of</strong> the nature <strong>of</strong> the <strong>binder</strong> and <strong>emulsifier</strong>, should be the main<br />
parameters governing particle size distribution. These two parameters could thus be sufficient to<br />
establish (<strong>from</strong> a limited number <strong>of</strong> actual emulsification trials ), empirical models allowing the<br />
prediction <strong>of</strong> specific PSD characteristics ( e.g. specific surface, mean particle size, ..) for different<br />
<strong>binder</strong>/surfactant combinations. Such a model would however have to be established for each new set<br />
<strong>of</strong> operating parameters (temperatures, flow rates, rotation speed, ..).<br />
Relationship between <strong>emulsion</strong> <strong>properties</strong>, particle size distribution and residual <strong>emulsifier</strong><br />
Emulsion viscosity. As explained in the introduction, most <strong>emulsion</strong>s manufactured within OPTEL<br />
were formulated with a <strong>binder</strong> content <strong>of</strong> 65% or less. A bit surprisingly, almost no differences in<br />
viscosity could be evidenced. This was valid for both unmodified and modified <strong>emulsion</strong>s, even if the<br />
later showed considerable differences in their PSD (larger amount <strong>of</strong> fine particles and higher surface<br />
areas). These findings suggest that at 65% <strong>binder</strong> content and lower, the STV method may not be<br />
sensitive enough to evidence the impact <strong>of</strong> particle size distribution. This is apparently in contradiction<br />
with practical experience since, even at lower <strong>binder</strong> contents, significant differences are sometimes<br />
observed. This may however be due to other factors than PSD, for instance osmotic pressure resulting<br />
<strong>from</strong> high salt contents in the bitumen, which were not represented in the OPTEL study.<br />
Emulsion pH. All the studied <strong>emulsion</strong>s have been manufactured <strong>from</strong> a water-phase at a pH <strong>of</strong> 1.8 or<br />
2. The increase in pH after emulsification ranged between 0.2 and 2. This increase was found to be<br />
mainly dependent on the origin <strong>of</strong> the bitumen. One may interpret the increase in pH as the result <strong>of</strong><br />
exchanges between the <strong>binder</strong> and the water-phase. As for the residual <strong>emulsifier</strong> content, a deeper<br />
interpretation has been made by calculating the amount <strong>of</strong> “consumed H+ ions” (which are responsible<br />
for the pH increase) and relating it to the total created surface. This analysis showed that polymer<br />
modification seems to reduce these exchanges. As for the amount <strong>of</strong> residual <strong>emulsifier</strong>, it seems that<br />
more exchanges occur (larger increases in pH) when larger particles are created ( impact <strong>of</strong><br />
manufacturing conditions ).
Breaking Index. The relation between residual <strong>emulsifier</strong> content and breaking index is shown in<br />
Figure 6. The expected trend (higher breaking index for higher amounts <strong>of</strong> available surfactant) is<br />
indeed noticed but a large scatter is observed as soon as the amount <strong>of</strong> surfactant exceeds a certain<br />
value. Considering the original assumption that small droplets should be more difficult to “break”<br />
(Laplace pressure), one may look at the total volume <strong>of</strong> the droplets greater than, for instance, 3µm.<br />
Figure 7 shows that, above a certain volume fraction <strong>of</strong> larger droplets, the breaking index clearly<br />
decreases with the total amount <strong>of</strong> large particles.<br />
Breaking Index ( g / 100g <strong>emulsion</strong> )<br />
180<br />
160<br />
140<br />
120<br />
100<br />
80<br />
Breaking Index / Residual Emulsifier<br />
Unmodified Bitumen - Polyamine<br />
Unmodified Bitumen - Diamine<br />
EVA modified Bitumen - Polyamine<br />
EVA modified Bitumen - Diamine<br />
SBS modified Bitumen - Polyamine<br />
SBS modified Bitumen - Diamine<br />
60<br />
0.00 0.50 1.00 1.50 2.00 2.50 3.00 3.50<br />
Residual Emulsifier ( g/l <strong>emulsion</strong> )<br />
Breaking Index ( g / 100g <strong>emulsion</strong> )<br />
180<br />
160<br />
140<br />
120<br />
100<br />
80<br />
60<br />
50<br />
45<br />
40<br />
35<br />
30<br />
25<br />
20<br />
15<br />
10<br />
5<br />
0<br />
Breaking Index / Binder Volume for D > 3µm<br />
Unmodified Bitumen - Polyamine<br />
Unmodified Bitumen - Diamine<br />
EVA modified Bitumen - Polyamine<br />
EVA modified Bitumen - Diamine<br />
SBS modified Bitumen - Polyamine<br />
SBS modified Bitumen - Diamine<br />
0 100 200 300 400 500 600 700 800<br />
Binder Volume for D > 3 µm ( g/l <strong>emulsion</strong> )<br />
Figure 6 Figure 7<br />
These findings suggest that the breaking behaviour, as measured by this specific method, is<br />
predominantly governed by residual <strong>emulsifier</strong> content and the amount <strong>of</strong> larger particles. Both are <strong>of</strong><br />
course correlated to a certain extent since the generation <strong>of</strong> a large amount <strong>of</strong> small particles will<br />
inevitably lead to a reduction in the residual <strong>emulsifier</strong> content. For the <strong>emulsion</strong>s which have been<br />
analysed within OPTEL, it seems also that the nature <strong>of</strong> the <strong>emulsifier</strong> is mainly acting through its<br />
impact on the particle size distribution.<br />
Storage Stability. The main parameter explaining<br />
the storage behaviour was supposed to be the<br />
volume fraction <strong>of</strong> the largest droplets, since those<br />
are likely to settle the quickest. As it can be seen on<br />
Figure 8 the results were however rather<br />
disappointing. The right trends seem to exist but the<br />
results apparently belong to different families. A full<br />
explanation could not be found but one may<br />
however notice that the worst decanting behaviour is<br />
observed for :<br />
- Emulsions with a low <strong>binder</strong> concentration<br />
( 60% ) which one could explain by the fact<br />
that more « free water » is available for the<br />
decanting <strong>of</strong> the large droplets. This is<br />
comforted by the low decanting observed for<br />
some <strong>of</strong> the 69% <strong>emulsion</strong>s.<br />
Decantation ( %-% )<br />
Storage Stability / Volume <strong>of</strong> droplets > 12 µm<br />
69% Unmodified Bitumen - Polyamine<br />
65% Unmodified Bitumen - Polyamine<br />
65% Unmodified Bitumen - Diamine<br />
60% Unmodified Bitumen - Polyamine<br />
65% Modified Bitumen - Polyamine<br />
65% modified Bitumen - Diamine<br />
0 50 100 150 200 250 300 350 400<br />
Volume <strong>of</strong> droplets > 12 µm ( ml )<br />
Figure 8<br />
- The polymer modified <strong>emulsion</strong>s for which the poor stability is suspected to be related to the<br />
low amount <strong>of</strong> residual <strong>emulsifier</strong> or to specific features <strong>of</strong> the particle size distribution.
Conclusion<br />
With regard to “<strong>binder</strong> emulsifiability”, the main findings <strong>of</strong> OPTEL can be summarised as follows :<br />
- Evaluation and implementation <strong>of</strong> test methodologies for the titration <strong>of</strong> residual <strong>emulsifier</strong><br />
content and the determination <strong>of</strong> interfacial tension characteristics ( drop tensiometer and Du<br />
Noüy ring method ). The strengths and weaknesses <strong>of</strong> these tests have been identified and<br />
resulted in practical guidelines for their use.<br />
- The prediction <strong>of</strong> residual <strong>emulsifier</strong> content <strong>from</strong> the knowledge <strong>of</strong> particle size distribution<br />
and the ad-hoc adsorption isotherm does not seem possible at this stage. This is due on one<br />
hand to the difficulty to derive the right Γ ∞ value <strong>from</strong> the adsorption isotherm. On the other<br />
hand, our investigations suggest that some <strong>emulsifier</strong> might get trapped inside the <strong>binder</strong> during<br />
the emulsification process.<br />
- The obtained data do however confirm the importance <strong>of</strong> particle size distribution and residual<br />
<strong>emulsifier</strong> content for key <strong>emulsion</strong> <strong>properties</strong>. They also suggest that interfacial tension and<br />
<strong>binder</strong> viscosity are indeed the essential parameters controlling particle size distribution (for<br />
given manufacturing conditions).<br />
The results <strong>of</strong> this study need <strong>of</strong> course to be confirmed on a wider set <strong>of</strong> products and <strong>emulsion</strong><br />
formulations. But the generated knowledge can already be converted into more efficient and<br />
meaningful protocols for the assessment <strong>of</strong> <strong>binder</strong>s, surfactants and <strong>emulsion</strong>s. It does also provide<br />
immediately applicable practical guidelines for the control <strong>of</strong> <strong>emulsion</strong> <strong>properties</strong> via particle size<br />
distribution and <strong>emulsifier</strong> content.<br />
Acknowledgements<br />
This study has been performed in the frame <strong>of</strong> the European Research Program BRITE-EURAM<br />
project “OPTEL” BE-1516 : “Slow-setting cationic bituminous <strong>emulsion</strong>s for construction and<br />
maintenance <strong>of</strong> roads” (http://www.cordis.lu/brite-euram). The development <strong>of</strong> the OPTEL project has<br />
been made possible thanks to the financing contribution <strong>of</strong> the European Community (DGXII), in the<br />
frame <strong>of</strong> the IVth Framework Programme BRITE-EURAM III. The OPTEL Consortium expresses<br />
herewith his thanks for this contribution. The Consortium included following organisations : Probisa,<br />
Entreprise Jean Lefebvre, <strong>Nynas</strong>, CECA, Laboratoire Central des Ponts et Chaussées (LCPC), Centre<br />
de Recherche Paul Pascal (CNRS) and the University <strong>of</strong> Las Palmas ( Canarian Islands).<br />
The authors would like to thank herewith Mrs. Juan José Potti, Alain Beghin, Bernard Brûlé, Bruno<br />
Simaillaud, Fernando Leal-Calderon, Jean-Claude Fabre, Maurice Bourrel, Francis Verzaro for their<br />
advice as well as Mr. A. Cagna (IT Concept) for its support on the interfacial tension measurements.<br />
References<br />
(1) J.J. Potti, B. Eckmann, B. Brûlé, J.C. Fabre, Ch. Such, F. Leal-Calderon, J. Fuente<br />
OPTEL Project . The first European cooperation about bituminous <strong>emulsion</strong>s.<br />
Proc. <strong>of</strong> the Second World Congress on Emulsions. Vol. 3.. 23-26 September 1997. Bordeaux (France).<br />
(2) Y. Lendresse, M.F. Morizur, A. Cagna, G. Esposito<br />
The performance <strong>of</strong> <strong>emulsion</strong>-grade bitumens. The use <strong>of</strong> a new method for characterising their interfacial<br />
<strong>properties</strong>.<br />
Proceedings <strong>of</strong> Eurasphalt Eurobitume Congress, Strasbourg, France, 7-10 May 1996. Paper N°6.038.<br />
(3) A. Seive, M.F. Morizur, B.G. Koenders, G. Durand, J.E. Poirier<br />
Characterisation <strong>of</strong> interfacial phenomena <strong>of</strong> bitumen/<strong>emulsifier</strong> aqueous solutions.<br />
EUROBITUME Workshop 99 on Performance Related Properties for Bituminous Binders, Brussels.<br />
Proceedings, paper N° 037.


![Säkerhetsbestämmelser Gbg rev 5.ppt [Compatibility Mode] - Nynas](https://img.yumpu.com/18742268/1/190x146/sakerhetsbestammelser-gbg-rev-5ppt-compatibility-mode-nynas.jpg?quality=85)