Investment Plan - OPERS
Investment Plan - OPERS
Investment Plan - OPERS

Create successful ePaper yourself
Turn your PDF publications into a flip-book with our unique Google optimized e-Paper software.
2 0 1 0 I N V E S T M E N T P L A N<br />
INVESTMENT PROGRAM<br />
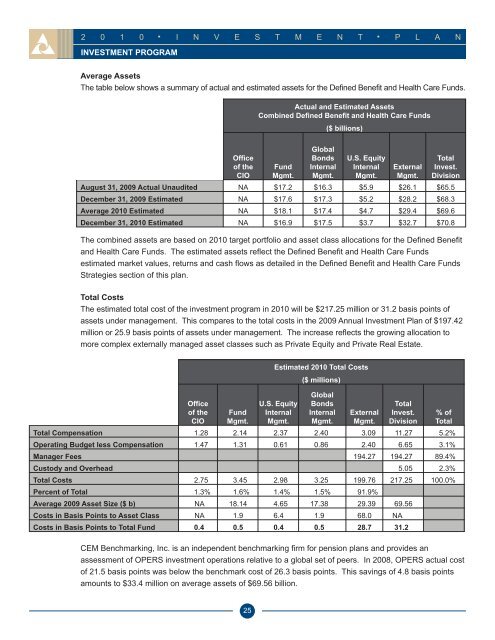
Average Assets<br />
The table below shows a summary of actual and estimated assets for the Defined Benefit and Health Care Funds.<br />
Office<br />
of the<br />
CIO<br />
The combined assets are based on 2010 target portfolio and asset class allocations for the Defined Benefit<br />
and Health Care Funds. The estimated assets reflect the Defined Benefit and Health Care Funds<br />
estimated market values, returns and cash flows as detailed in the Defined Benefit and Health Care Funds<br />
Strategies section of this plan.<br />
Total Costs<br />
The estimated total cost of the investment program in 2010 will be $217.25 million or 31.2 basis points of<br />
assets under management. This compares to the total costs in the 2009 Annual <strong>Investment</strong> <strong>Plan</strong> of $197.42<br />
million or 25.9 basis points of assets under management. The increase reflects the growing allocation to<br />
more complex externally managed asset classes such as Private Equity and Private Real Estate.<br />
CEM Benchmarking, Inc. is an independent benchmarking firm for pension plans and provides an<br />
assessment of <strong>OPERS</strong> investment operations relative to a global set of peers. In 2008, <strong>OPERS</strong> actual cost<br />
of 21.5 basis points was below the benchmark cost of 26.3 basis points. This savings of 4.8 basis points<br />
amounts to $33.4 million on average assets of $69.56 billion.<br />
25<br />
Actual and Estimated Assets<br />
Combined Defined Benefit and Health Care Funds<br />
($ billions)<br />
Fund<br />
Mgmt.<br />
Global<br />
Bonds<br />
Internal<br />
Mgmt.<br />
U.S. Equity<br />
Internal<br />
Mgmt.<br />
External<br />
Mgmt.<br />
Total<br />
Invest.<br />
Division<br />
August 31, 2009 Actual Unaudited NA $17.2 $16.3 $5.9 $26.1 $65.5<br />
December 31, 2009 Estimated NA $17.6 $17.3 $5.2 $28.2 $68.3<br />
Average 2010 Estimated NA $18.1 $17.4 $4.7 $29.4 $69.6<br />
December 31, 2010 Estimated NA $16.9 $17.5 $3.7 $32.7 $70.8<br />
Office<br />
of the<br />
CIO<br />
Fund<br />
Mgmt.<br />
Estimated 2010 Total Costs<br />
($ millions)<br />
U.S. Equity<br />
Internal<br />
Mgmt.<br />
Global<br />
Bonds<br />
Internal<br />
Mgmt.<br />
External<br />
Mgmt.<br />
Total<br />
Invest.<br />
Division<br />
Total Compensation 1.28 2.14 2.37 2.40 3.09 11.27 5.2%<br />
Operating Budget less Compensation 1.47 1.31 0.61 0.86 2.40 6.65 3.1%<br />
Manager Fees 194.27 194.27 89.4%<br />
Custody and Overhead 5.05 2.3%<br />
Total Costs 2.75 3.45 2.98 3.25 199.76 217.25 100.0%<br />
Percent of Total 1.3% 1.6% 1.4% 1.5% 91.9%<br />
Average 2009 Asset Size ($ b) NA 18.14 4.65 17.38 29.39 69.56<br />
Costs in Basis Points to Asset Class NA 1.9 6.4 1.9 68.0 NA<br />
Costs in Basis Points to Total Fund 0.4 0.5 0.4 0.5 28.7 31.2<br />
% of<br />
Total