Investment Plan - OPERS
Investment Plan - OPERS
Investment Plan - OPERS

You also want an ePaper? Increase the reach of your titles
YUMPU automatically turns print PDFs into web optimized ePapers that Google loves.
2 0 1 0 I N V E S T M E N T P L A N<br />
FUND STRATEGIES<br />
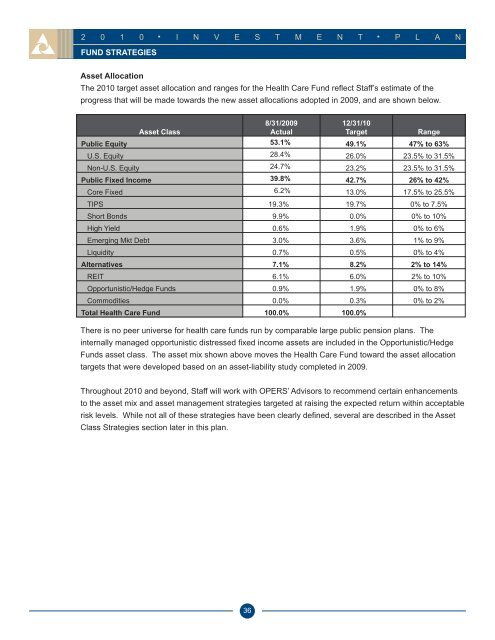
Asset Allocation<br />
The 2010 target asset allocation and ranges for the Health Care Fund reflect Staff’s estimate of the<br />
progress that will be made towards the new asset allocations adopted in 2009, and are shown below.<br />
8/31/2009<br />
12/31/10<br />
Asset Class<br />
Actual<br />
Target Range<br />
Public Equity 53.1% 49.1% 47% to 63%<br />
U.S. Equity 28.4% 26.0% 23.5% to 31.5%<br />
Non-U.S. Equity 24.7% 23.2% 23.5% to 31.5%<br />
Public Fixed Income 39.8% 42.7% 26% to 42%<br />
Core Fixed 6.2% 13.0% 17.5% to 25.5%<br />
TIPS 19.3% 19.7% 0% to 7.5%<br />
Short Bonds 9.9% 0.0% 0% to 10%<br />
High Yield 0.6% 1.9% 0% to 6%<br />
Emerging Mkt Debt 3.0% 3.6% 1% to 9%<br />
Liquidity 0.7% 0.5% 0% to 4%<br />
Alternatives 7.1% 8.2% 2% to 14%<br />
REIT 6.1% 6.0% 2% to 10%<br />
Opportunistic/Hedge Funds 0.9% 1.9% 0% to 8%<br />
Commodities 0.0% 0.3% 0% to 2%<br />
Total Health Care Fund 100.0% 100.0%<br />
There is no peer universe for health care funds run by comparable large public pension plans. The<br />
internally managed opportunistic distressed fixed income assets are included in the Opportunistic/Hedge<br />
Funds asset class. The asset mix shown above moves the Health Care Fund toward the asset allocation<br />
targets that were developed based on an asset-liability study completed in 2009.<br />
Throughout 2010 and beyond, Staff will work with <strong>OPERS</strong>’ Advisors to recommend certain enhancements<br />
to the asset mix and asset management strategies targeted at raising the expected return within acceptable<br />
risk levels. While not all of these strategies have been clearly defined, several are described in the Asset<br />
Class Strategies section later in this plan.<br />
36