Investment Plan - OPERS
Investment Plan - OPERS
Investment Plan - OPERS

Create successful ePaper yourself
Turn your PDF publications into a flip-book with our unique Google optimized e-Paper software.
2 0 1 0 I N V E S T M E N T P L A N<br />
FUND STRATEGIES<br />
Defined Benefit Fund<br />
Expected Asset Growth<br />
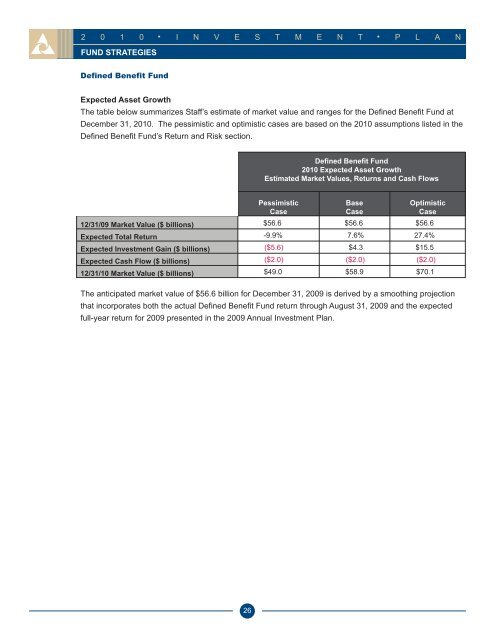
The table below summarizes Staff’s estimate of market value and ranges for the Defined Benefit Fund at<br />
December 31, 2010. The pessimistic and optimistic cases are based on the 2010 assumptions listed in the<br />
Defined Benefit Fund’s Return and Risk section.<br />
The anticipated market value of $56.6 billion for December 31, 2009 is derived by a smoothing projection<br />
that incorporates both the actual Defined Benefit Fund return through August 31, 2009 and the expected<br />
full-year return for 2009 presented in the 2009 Annual <strong>Investment</strong> <strong>Plan</strong>.<br />
26<br />
Defined Benefit Fund<br />
2010 Expected Asset Growth<br />
Estimated Market Values, Returns and Cash Flows<br />
Pessimistic<br />
Case<br />
Base<br />
Case<br />
Optimistic<br />
Case<br />
12/31/09 Market Value ($ billions) $56.6 $56.6 $56.6<br />
Expected Total Return -9.9% 7.6% 27.4%<br />
Expected <strong>Investment</strong> Gain ($ billions) ($5.6) $4.3 $15.5<br />
Expected Cash Flow ($ billions) ($2.0) ($2.0) ($2.0)<br />
12/31/10 Market Value ($ billions) $49.0 $58.9 $70.1