Investment Plan - OPERS
Investment Plan - OPERS
Investment Plan - OPERS

Create successful ePaper yourself
Turn your PDF publications into a flip-book with our unique Google optimized e-Paper software.
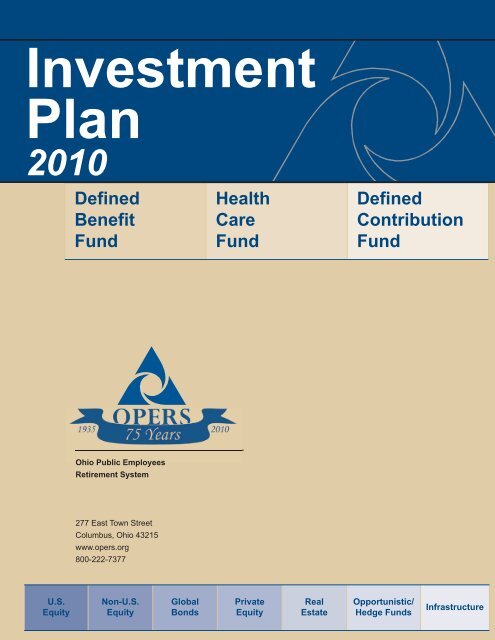
<strong>Investment</strong><br />
<strong>Plan</strong><br />
2010<br />
U.S.<br />
Equity<br />
Defined<br />
Benefit<br />
Fund<br />
Ohio Public Employees<br />
Retirement System<br />
277 East Town Street<br />
Columbus, Ohio 43215<br />
www.opers.org<br />
800-222-7377<br />
Non-U.S.<br />
Equity<br />
Global<br />
Bonds<br />
Health<br />
Care<br />
Fund<br />
Private<br />
Equity<br />
Real<br />
Estate<br />
Defined<br />
Contribution<br />
Fund<br />
Opportunistic/<br />
Hedge Funds<br />
Infrastructure
2 0 1 0 I N V E S T M E N T P L A N<br />
TABLE OF CONTENTS<br />
<strong>Investment</strong> Program<br />
Report from the CIO 1<br />
Organizational Structure 7<br />
Office of the CIO 9<br />
Fund Management 10<br />
Global Bonds Internal Management 12<br />
U.S. Equity Internal Management 14<br />
External Management 15<br />
<strong>Investment</strong> Governance 16<br />
Resources 20<br />
Fund Strategies<br />
Defined Benefit Fund 26<br />
Health Care Fund 35<br />
Defined Contribution Fund 43<br />
Asset Class Strategies<br />
Tactical Outlook 51<br />
Public Equity 55<br />
Public Fixed Income 62<br />
Private Equity 71<br />
Real Estate 75<br />
Opportunistic/Hedge Funds 81<br />
Commodities 81<br />
Infrastructure 81<br />
Appendix A<br />
Advisors’ Reviews 82<br />
Appendix B<br />
Economic Outlook 85<br />
Appendix C<br />
<strong>Investment</strong> Staff 92
2 0 1 0 I N V E S T M E N T P L A N<br />
<strong>Investment</strong><br />
Program
2 0 1 0 I N V E S T M E N T P L A N<br />
INVESTMENT PROGRAM<br />
Report from the CIO<br />
Dear Members of the <strong>OPERS</strong> Board of Trustees:<br />
Developing a plan instills a discipline to remain focused on the investment goals against which the<br />
Division’s performance is benchmarked. It is an honor to present the 2010 Annual <strong>Investment</strong> <strong>Plan</strong>. This<br />
plan is a collaborative effort of the <strong>OPERS</strong> <strong>Investment</strong> Division Staff and was discussed in detail with<br />
<strong>OPERS</strong> <strong>Investment</strong> Advisors.<br />
In our industry, value is created through tested tenets – by generating target returns for the total fund<br />
through each asset class and portfolio and by maintaining a competitive cost structure relative to our asset<br />
allocation. Performance will be driven by our insights and discipline and our ability to hire and retain key<br />
investment professionals who share our, and <strong>OPERS</strong>’, commitment to excellence. Our efforts are aligned<br />
not just with our investment goals but, more importantly, with the <strong>Investment</strong> Division’s core values and<br />
<strong>OPERS</strong>’ strategic objectives.<br />
Review of 2009 (through October 2009)¹<br />
Although we tactically address the opportunities and challenges in the capital markets, we remain<br />
disciplined institutional investors with a long-term strategic asset allocation designed to meet our plan<br />
objectives. Our policies are not predicated on short-term economic cycles but rather on a long-term time<br />
horizon appropriate to our pension liabilities and health care commitments.<br />
The panic of 2008 has receded, particularly in the capital markets where it began. The economic<br />
recession, caused by both the panic and economic excesses, has ended. The consensus believes that the<br />
recovery will be an extended period of subdued growth based on a “debt hangover.” While that case makes<br />
sense, consensus expectations should be adopted cautiously. The U.S. economy that emerges from this<br />
recession will necessarily be led by different forces than those which led the last cycle; housing and retail<br />
spending are still in recession-mode. The level of trade, the value of the dollar, the productivity of workers,<br />
immigration policy, the wars abroad and many other factors will impact growth, regardless of debt levels at<br />
a point in time.<br />
The <strong>OPERS</strong> Board of Trustees (Board) and Staff’s efforts have been stress-tested by market events. While<br />
found not to be perfect, it is important to recognize that we have all passed the test – by quite a margin, in<br />
fact. Ours is a highly complex endeavor, on a scale that is breath taking. In order to fund and provide for<br />
the benefits our members have earned, <strong>OPERS</strong> has had to become a huge financial enterprise. Our<br />
capital is invested from Vietnam to outer space, but also down to simple products we all use every day and<br />
in companies headquartered as close as downtown Columbus. The fruits of that capital are brought back to<br />
our fund and made available for benefits.<br />
¹ Detailed information of actual 2009 accomplishments will be reported in the 2009 <strong>OPERS</strong> Comprehensive<br />
Annual Financial Report, published at a later date.<br />
1
2 0 1 0 I N V E S T M E N T P L A N<br />
INVESTMENT PROGRAM<br />
With the Board’s confidence in Staff, expressed most recently by its timely permission in early 2009 to<br />
widen our asset allocation ranges to reflect market valuations born of panic rather than intrinsic value, we<br />
capitalized on adversity. <strong>OPERS</strong> was able to maintain its market discipline and ultimately to be a holder<br />
and a buyer at distressed prices rather than a seller. That’s investment discipline on top of good portfolio<br />
structure. Discipline (a repeatable process that adds value when applied consistently) separates<br />
professionals from amateurs in the field of investments.<br />
Because of the scale of our endeavors, we owned some of virtually all of the “problem assets” that<br />
bedeviled the markets: mortgages that were badly secured, short term securities that became long term,<br />
real estate-backed securities that are priced below par to this day and, yes, our share of Lehman and AIG,<br />
and other names that will eventually fade from people’s lexicons. But while we owned these things, they<br />
were proportional within our disciplined program and we also owned treasury bonds and other assets which<br />
rose to very high valuations, or maintained their value, during the panic.<br />
Staff is also encouraged that many of the unsustainable excesses in the broader economy and in the<br />
capital markets have been addressed, however abruptly and un-gently by the bear market and economic<br />
recession. Both now have a more solid foundation to build on. Valuations are not stretched in most market<br />
sectors and mortgage banking is no longer seen as entrepreneurial but once again as banking. Yet, the<br />
complete consequences of the bubbles and their bursting have probably not been felt. One area of<br />
unfinished business is the overhang of refinancing yet to take place in commercial real estate. While<br />
concerning, it need not end in disaster.<br />
In investing, adversity begets opportunity. The Board has capitalized on this first, by not slavishly forcing<br />
itself to sell assets at the worst possible time and later, by its subsequent review and adjustment of asset<br />
allocations across the Defined Benefit, Health Care and Defined Contribution Funds. In every case, we<br />
have used market insights to improve the balance of return and risk. However, in no case have these<br />
allocations withdrawn exposure to markets or the broad economy that are the very sources of both risk and<br />
the opportunity for returns. Our capital must be employed if it is to provide benefits.<br />
In reviewing information up through the third quarter, there were many accomplishments during the year, including:<br />
Participation in the market recovery that has restored an important measure of the funding lost. When<br />
peer performance data for comparably-sized plans is available for comparison, we believe it will show a<br />
more complete measure of this achievement.<br />
Proactive steps taken to reduce the impact of the severe financial crisis on the total fund. This included<br />
tactical positioning of asset classes, active management of our financial sector exposure, vigilant<br />
monitoring of portfolios and coordination with our investment partners.<br />
Execution of the strategic asset allocation for the Health Care Fund. This transition resulted in a higher<br />
allocation for equity-like assets relative to fixed income assets to generate a higher return while<br />
maintaining a reasonable risk parameter.<br />
Increased utilization of derivatives to gain and hedge exposure to asset classes in a cost effective and<br />
efficient manner. The prudent use of derivatives has also allowed the fund to more efficiently manage<br />
Board-approved ranges around our target allocation.<br />
2
2 0 1 0 I N V E S T M E N T P L A N<br />
INVESTMENT PROGRAM<br />
Our achievements likewise have supported <strong>OPERS</strong> strategic efforts to go from “Good 2 Great” through our<br />
nine initiatives in the <strong>OPERS</strong> Strategic <strong>Plan</strong>. Below is a report on our progress (codes succeeding<br />
initiatives reference the groupings within <strong>OPERS</strong> Strategic <strong>Plan</strong>):<br />
Create a hedge fund strategy (FP4)<br />
Following Staff presentations and recommendations in June and July 2009, the Board approved a 3%<br />
allocation to Hedge Funds combined with its opportunistic allocation. Staff has invested several<br />
hundred person-hours developing implementation plans for Board review and eventual request for<br />
proposals for managers.<br />
Increase Private Equity allocation within the Health Care Fund (FP5)<br />
The unexpected reduction in the projected solvency period for the Health Care Fund led the Board to<br />
elect to reverse its prior decision to add a Private Equity allocation to the Health Care Fund. However,<br />
for unrelated reasons, the Board doubled its allocation to Private Equity within the Defined Benefit Fund,<br />
which, when added to an already below-target weighting, provides <strong>OPERS</strong> with plenty of ongoing<br />
investment opportunity in this asset class.<br />
Enhance the <strong>OPERS</strong> <strong>Investment</strong> Options offered to Defined Contribution Fund (FP6)<br />
Changes included adding 10 target date funds composed of varying allocations of our six existing core<br />
funds. These replaced the pre-mixed portfolios previously offered. The Board later accepted the<br />
addition of three asset classes (Inflation-indexed Bonds, High Yield Bonds and Long Duration Bonds) as<br />
enhancements to the Target Date funds. Staff has begun implementation of those enhancements and<br />
will also be hiring active managers for the U.S. equity options (large cap and small cap).<br />
Going beyond this strategic initiative, Staff has revamped the risk/compliance framework and manager<br />
selection processes for the Defined Contribution Fund to make them more consistent with those for the<br />
Defined Benefit and Health Care Funds.<br />
Develop and implement a plan to gain exposure to non-U.S. equity markets using derivatives and<br />
internal management capabilities (FP7)<br />
The importance of this initiative has increased along with the larger allocation to Non-U.S. Equity from<br />
20% to 25% in the Defined Benefit Fund. Staff has been able to use over-the-counter swaps (following<br />
appropriate implementation of operational processes and controls, legal documentation review and<br />
adding a new counterparty), to first add and then reduce, exposure to the developed markets within<br />
Non-U.S. Equity in 2009. Staff is preparing to extend this capability to the developing markets within<br />
Non-U.S. Equity. Staff will also continue its evaluation of using listed futures and internal management<br />
for Non-U.S. Equity exposure.<br />
3
2 0 1 0 I N V E S T M E N T P L A N<br />
INVESTMENT PROGRAM<br />
Private market database (IN F9)<br />
Staff is preparing to “go live” with the eFront system, which holds all pertinent data relevant to <strong>OPERS</strong><br />
Private Real Estate and Private Equity holdings, no later than the first quarter of 2010 following a period<br />
of parallel testing of results with existing methods (using September 30 and December 31 quarter-end<br />
data). The private equity portion of the system was released for production tests on schedule on<br />
July 1, 2009.<br />
International Real Estate Securities manager selection (IN F10)<br />
Staff is re-drafting the real estate policy to incorporate the REIT portion of the Defined Benefit Fund’s<br />
Real Estate portfolio within the broader allocation to real estate. This would eliminate the strategic<br />
distinction between public and private real estate within the Defined Benefit Fund, leaving Staff to<br />
implement the real estate policy using the best-valued assets available at the time funds are deployed.<br />
Therefore, the international real estate exposure will also be implemented using whatever vehicles are<br />
most efficient when funds are deployed (e.g., international REITs, closed-end funds, open-end funds,<br />
infrastructure funds or other means).<br />
External Public Markets external manager cost and efficiency review (IN F11)<br />
Staff has retroactively negotiated reductions more than $1 million of fee savings from external<br />
managers and advisors. In addition, one of the very few fortunate results of the bear market was a<br />
significant reduction in fees based on asset size.<br />
In addition, Staff has developed and distributed a new streamlined <strong>Investment</strong> Manager Agreement<br />
(IMA) to four select managers. Their feedback will be incorporated into the final product. The goal of<br />
this IMA process is to generate a standardized legal agreement for external managers, which is<br />
customized only for differences in asset type rather than negotiated on an ad hoc basis (currently). This<br />
process will save time and legal fees.<br />
Staff is also in the final selection process for a group of transition managers, following the completion of<br />
an RFP process, which will lower costs and improve efficiency.<br />
Defined Benefit Fund strategic asset allocation (IN F12)<br />
The Board has approved changes in the asset allocation of the Defined Benefit Fund to better balance<br />
return and risk. The Board also made modifications to the asset allocation of the Health Care Fund.<br />
Staff is preparing a complete asset class policy review for the Board as well as studying the necessary<br />
steps to implement the new allocation.<br />
Front office system implementation (IN F13)<br />
There was significant progress in the implementation of a multi-year technology plan to enhance our<br />
portfolio management and trading capabilities. The Bloomberg order management system for fixed<br />
income has been operational since October 29, 2008. The Charles River order management system for<br />
equities was successfully implemented in January 2009, which in turn allowed the old Macgregor<br />
system to be shut down. The Bloomberg cash management system was recently deployed in February<br />
and is operational. The eFront system and Eagle data warehouse will, when complete, support better<br />
planning and reporting across all asset classes and provide the foundation for better cataloguing of risk<br />
across the all asset classes.<br />
4
2 0 1 0 I N V E S T M E N T P L A N<br />
INVESTMENT PROGRAM<br />
Overview of 2010 Annual <strong>Investment</strong> <strong>Plan</strong><br />
As always, the <strong>Investment</strong> Division’s goals reflect the Board’s ongoing mandate to earn expected returns,<br />
while managing to an acceptable level of risk.<br />
Several of the <strong>Investment</strong> Division initiatives are listed below:<br />
Implement Board-approved asset allocation changes in the Defined Benefit, Health Care and Defined<br />
Contribution Funds.<br />
Update Board investment policies, educate Staff and the Board regarding market conditions and<br />
investment opportunities, design implementation plans, prepare, issue and evaluate responses to RFPs<br />
and take steps necessary to make progress on the implementation of the changes in these asset<br />
allocations in a cost-effective and considered manner.<br />
Add resources and fill Staff vacancies to accommodate investment in new asset classes.<br />
Further expand risk management capabilities and compliance systems.<br />
Add a higher proportion of active management to Public Equity.<br />
Develop improved forecasting capabilities of employer/employee cash receipts and pension/healthcare<br />
payments to better manage fund asset allocation.<br />
Evaluate an implementation plan for expanding the internally managed securities lending program to<br />
include lending U.S. treasuries and Treasury Inflation Protected Securities (TIPS).<br />
Research and develop trading, information technology, reporting and back office infrastructure to<br />
internally manage Non-U.S. Equities, additional U.S. Equity mandates and commodities exposure.<br />
Expand capabilities for implementing asset class or portfolio hedging strategies.<br />
Evaluate the Opportunistic Core and Opportunistic Short Duration portfolio strategies and implement<br />
modifications, as appropriate.<br />
Asset Management<br />
As prudent stewards of a public fund with a long-term investment horizon, the <strong>Investment</strong> Division will<br />
continue to monitor and measure three distinct sources of return and risk: strategic (policy allocation),<br />
tactical (investment implementation level) and active (manager level). Each source of return and risk<br />
contributes to achieving overall investment results. The Defined Benefit and Health Care Funds sections<br />
presented later in this Annual <strong>Investment</strong> <strong>Plan</strong> provide details about how policy, tactical and active returns<br />
will be generated within a framework of managed risks.<br />
In summary, the 2010 goals established for each source of return and risk for the Defined Benefit and<br />
Health Care Funds are as follows:<br />
The total expected return of the <strong>OPERS</strong>’ Defined Benefit Fund in 2010 is 7.56% and is comprised of the<br />
expected policy return of 7.23% and active management return of 0.33%. The total risk that will be<br />
taken to achieve this return is 10.70%, which is derived from the combination of the policy risk of<br />
10.50%, tactical risk of 0.30% and active risk of 0.80%. Long term expected returns remain above 8%.<br />
5
2 0 1 0 I N V E S T M E N T P L A N<br />
INVESTMENT PROGRAM<br />
The total expected return of the <strong>OPERS</strong>’ Health Care Fund in 2010 is 6.52% and is comprised of the<br />
expected policy return of 6.12% and active management return of 0.39%. The total risk that will be<br />
taken to achieve this return is approximately 8.70%, which is derived from the combination of the policy<br />
risk of 8.50%, tactical risk of 0.30% and active risk of 0.45%.%. Long term expected returns remain<br />
above 7%.<br />
Resources<br />
As stated previously, the <strong>Investment</strong> Division will thoughtfully align its resources against targeted priorities<br />
to ensure the success of our stated goals by year-end 2010. The <strong>Investment</strong> Division currently has 59<br />
authorized positions. The <strong>Investment</strong> Division submitted an estimated compensation and operating budget<br />
of $17.9 million for 2010, a 4% increase over 2009. The budget includes an estimate of the 2010 incentive<br />
compensation payout, which reflects 2009 investment performance. Consistent with the rest of <strong>OPERS</strong>,<br />
the budget assumes no merit increases for Staff in 2010. It also reflects the Division’s effort to maintain<br />
internal investment management where appropriate due to its very large cost savings and to manage<br />
related administrative expenses.<br />
It should be noted that the estimated total cost to manage the <strong>OPERS</strong> asset base in 2010 will be 31.2 basis<br />
points (a basis point equals one hundredth of a percent). The total estimated cost of 31.2 basis points<br />
translates to $217.25 million, 10% higher in dollars than the previous year. This cost reflects many factors,<br />
including a shift in asset mix to more complex asset classes. The cost assumes a long-term growth trend in<br />
the fund’s asset base; a continued bear market would reduce the cost. The breakdown of the budget is<br />
discussed in greater detail throughout this plan.<br />
Summary<br />
The <strong>Investment</strong> Division remains focused on living up to <strong>OPERS</strong>’ mission “to provide secure retirement<br />
benefits for our members.” This can only be accomplished by clearly establishing our goals and diligently<br />
implementing and monitoring them in the face of both the daunting challenges and immense opportunities<br />
within the capital markets.<br />
Detailed information regarding how each of the initiatives will be achieved follows in this document, which is<br />
organized into three sections: Initiatives and Resources, Fund Strategies and Asset Class Strategies.<br />
Finally, I would like to sincerely thank the <strong>OPERS</strong> Board of Trustees for their trust, support and oversight of<br />
the investment program during these tumultuous times. Most especially, I would like to express my<br />
gratitude to my investment associates as we rise to the challenges and continue our journey to become a<br />
great investment organization delivering the best risk-adjusted returns for our plan participants and an<br />
integral part of <strong>OPERS</strong>.<br />
Respectfully,<br />
Richard Shafer, CFA<br />
Interim CIO<br />
6
Fund<br />
Management<br />
2 0 1 0 I N V E S T M E N T P L A N<br />
INVESTMENT PROGRAM<br />
Organizational Structure<br />
The <strong>Investment</strong> Division organizational chart is shown here; function detail is provided within the<br />
organizational charts included in the individual Resources sections.<br />
Fund Management /<br />
Global Bonds<br />
(Deputy CIO)<br />
Asset<br />
Allocation<br />
U.S. Equity Index<br />
Management<br />
U.S. Equity Trading<br />
Quantitative<br />
Analysis<br />
Derivatives<br />
Commodities<br />
Global Bonds<br />
Internal<br />
Management<br />
Core<br />
Long Duration<br />
Short Duration<br />
TIPS<br />
Cash<br />
Securities<br />
Lending<br />
U.S. Equity<br />
Internal<br />
Management<br />
Business<br />
Management<br />
7<br />
CIO<br />
External Management<br />
(Deputy CIO)<br />
Public<br />
Markets<br />
External Managers<br />
Defined<br />
Contribution<br />
Hedge Funds<br />
Risk Management<br />
Oversight<br />
Private<br />
Markets<br />
Private<br />
Equity<br />
Private<br />
Real Estate<br />
Infrastructure<br />
<strong>Investment</strong><br />
Compliance
Bill Miller<br />
Deputy CIO<br />
(Internal & Fund<br />
Management)<br />
2 0 1 0 I N V E S T M E N T P L A N<br />
INVESTMENT PROGRAM<br />
Leadership of Principal Groups<br />
The following chart shows the names of the individuals responsible for each principal functional area.<br />
Deryck Lampe<br />
Senior Portfolio Manager<br />
U.S. Equity Enhanced Index<br />
(Internal)<br />
CIO<br />
Vacant<br />
Rick Shafer<br />
Deputy CIO<br />
(External Management)<br />
8<br />
Dan German<br />
Risk Manager<br />
Chris DeRose<br />
Chief Executive Officer<br />
Alan Davidson<br />
Compliance Manager
2 0 1 0 I N V E S T M E N T P L A N<br />
INVESTMENT PROGRAM<br />
Office of the CIO<br />
Mary Ann Kabbaz<br />
Executive Assistant<br />
Junior Analyst<br />
Vacant<br />
Dan German<br />
Risk Manager<br />
Risk Analyst<br />
Vacant<br />
CIO<br />
Vacant<br />
The Chief <strong>Investment</strong> Officer (CIO) is responsible for manager selection from those recommended by<br />
investment Staff; recommending investment policy and strategy to the Board; investment performance;<br />
overall management of the <strong>Investment</strong> Division, and; allocating resources within the Division. The CIO also<br />
bears responsibility for risk management and compliance within the <strong>Investment</strong> Division.<br />
9<br />
Alan Davidson<br />
Compliance Manager<br />
Pat Edgington<br />
<strong>Investment</strong> Reporting<br />
Manager<br />
Compliance Analyst<br />
Vacant<br />
Chris DeRose<br />
Chief Executive Officer
Roger Fox<br />
<strong>Investment</strong> Adviser<br />
2 0 1 0 I N V E S T M E N T P L A N<br />
INVESTMENT PROGRAM<br />
Fund Management<br />
J.G. Lee<br />
Fund Manager<br />
Joan Stack<br />
Trading Manager<br />
Christy Ruoff<br />
Equity Trader<br />
Matt Sherman<br />
Senior Equity Trader<br />
Fund Management works closely with other areas of the <strong>Investment</strong> Division and has both investment and<br />
non-investment responsibilities. The team is responsible for:<br />
Reviewing, monitoring and implementing changes to the asset allocations and related risk budgets for<br />
the Defined Benefit, Health Care and Defined Contribution Funds;<br />
Performing research and analysis on allocations to asset classes, sub-asset classes and portfolios;<br />
Conducting investment risk analysis, assessments and risk management for the Defined Benefit, Health<br />
Care and Defined Contribution Funds;<br />
Providing quantitative research and analysis in support of internal asset management and other internal<br />
group activities;<br />
Management of asset class beta, which includes beta portfolios such as the U.S. Equity Index portfolio<br />
and passive derivatives portfolios (approximately $19 billion managed internally in 13 accounts); and<br />
Equity trading and derivatives trading for internal equity portfolios and asset allocation management.<br />
The deputy CIO reports directly to the CIO and is responsible for assuring all area responsibilities are<br />
performed. Assisting the deputy CIO are two fund managers, a trading manager, an investment adviser<br />
and supporting Staff.<br />
10<br />
Bill Miller<br />
Deputy CIO<br />
Erick Weis<br />
Fund Manager<br />
Josh Biddinger<br />
Portfolio Assistant<br />
David Buchholz<br />
Portfolio Assistant<br />
Xinyang Gu<br />
Quantitative / Research<br />
Roger Tong<br />
Quantitative / Research<br />
Portfolio Assistant<br />
Vacant<br />
Paul Greff<br />
Senior Portfolio Manager<br />
Fixed Income
2 0 1 0 I N V E S T M E N T P L A N<br />
INVESTMENT PROGRAM<br />
Fund Management (continued)<br />
One fund manager manages asset allocation research activities and is responsible for the investment<br />
performance of beta portfolios such as the U.S. Equity Index portfolio and passive derivatives portfolios as<br />
well as analytical projects and various initiatives. The two quantitative/research Staff and portfolio assistant<br />
II Staff support the Fund Management group under the direction of the fund manager.<br />
The other fund manager is responsible for quantitative research and analytic support for the entire<br />
<strong>Investment</strong> Division, evaluating the risk-and-return characteristics of the funds and the asset class<br />
composites across the <strong>Investment</strong> Division.<br />
The trading manager manages two traders and is responsible for executing trades for the Fund<br />
Management group portfolios as well as the internally managed Enhanced Index portfolio and REIT<br />
portfolio. Trading activities in support of the Fund Management group include executing trades for portfolios<br />
during transitions. The trading area executes trades using a variety of tools including electronic algorithmic<br />
and program trading systems and, as such, works closely with the investment portfolio managers and the<br />
quantitative research group to incorporate enhancements into the trading systems. The area also performs<br />
and reviews the analysis of internal transactions from a pre-trade and post-trade perspective using<br />
transactions cost-analysis tools and models.<br />
The investment adviser assists with forward planning as well as operational, internal audit, information<br />
technology, legal, investment accounting and performance matters.<br />
The Fund Management group has 12 positions, one of which is vacant.<br />
11
Erik Cagnina<br />
Portfolio Manager<br />
Securitized Products<br />
Analyst<br />
Vacant<br />
2 0 1 0 I N V E S T M E N T P L A N<br />
INVESTMENT PROGRAM<br />
Global Bonds Internal Management<br />
Mark Ehresman<br />
Senior <strong>Investment</strong><br />
Analyst<br />
Tony Enderle<br />
Senior <strong>Investment</strong><br />
Analyst<br />
Nick Kotsonis<br />
Senior <strong>Investment</strong><br />
Analyst<br />
Todd Soots<br />
Senior <strong>Investment</strong><br />
Analyst<br />
JoAnn Yocum<br />
<strong>Investment</strong> Assistant II<br />
Bill Miller<br />
Deputy CIO<br />
Paul Greff<br />
Senior Portfolio Manager<br />
Fixed Income<br />
Eric France<br />
Portfolio Manager<br />
The Global Bonds Internal Management group is currently organized with one senior portfolio manager, four<br />
portfolio managers, six analysts and an investment assistant II. The senior portfolio manager provides<br />
oversight of the group and is responsible for the strategic positioning and investment performance of all the<br />
internally managed bond portfolios.<br />
The leads of the different functional areas work as a team on the Global Bonds Internal Management<br />
investment decision-making process and report to the senior portfolio manager. They also handle the dayto-day<br />
management of the internal portfolios. Authorized individuals in the Global Bonds Internal<br />
Management group handle trade execution.<br />
Two portfolio managers oversee the Core, Long Duration and TIPS portfolios and serve as backups to each<br />
other. They identify major themes, sector weightings and perform portfolio optimization and construction.<br />
The other two portfolio managers oversee the Short Duration, Core Opportunistic and Short Duration<br />
Opportunistic portfolios and serve as backups to each other. They are also responsible for relative value,<br />
individual security analysis and trading within the securitized markets and work closely with the other<br />
portfolio managers to implement securitized asset strategies within the portfolios.<br />
12<br />
Jerry May<br />
Cash/Securities<br />
Lending Manager<br />
Teresa Black<br />
Cash/Securities<br />
Lending Analyst<br />
eSecLending<br />
Associate<br />
Chris Rieddle<br />
Portfolio Manager
2 0 1 0 I N V E S T M E N T P L A N<br />
INVESTMENT PROGRAM<br />
Global Bonds Internal Management (continued)<br />
One senior investment analyst plays a lead role and provides oversight to the credit research group. The<br />
analysts are responsible for assigned industries in the corporate sector, which includes company analysis<br />
and the identification of relative value ideas. The credit analysts, along with the lead analyst, are<br />
responsible for assigned sectors and provide back up to other sectors. They work closely with the portfolio<br />
managers to implement credit strategies within the portfolios. This organizational structure ensures that all<br />
sectors are monitored constantly so that <strong>OPERS</strong> is in the position to take advantage of marketplace<br />
opportunities.<br />
The cash securities/lending management Staff manage the <strong>OPERS</strong> cash/securities lending programs<br />
across all asset classes. In addition, these individuals manage the cash portfolios supporting <strong>OPERS</strong>’<br />
operating liabilities and cash collateral resulting from securities lending activities. There is also one external<br />
eSecLending associate supporting a portion of the securities lending activities.<br />
The Global Bonds Internal Management group manages approximately $27 billion in 12 accounts.<br />
13
2 0 1 0 I N V E S T M E N T P L A N<br />
INVESTMENT PROGRAM<br />
U.S. Equity Internal Management<br />
Steve Barker<br />
Senior Analyst<br />
Joe Boushelle<br />
Equity Analyst<br />
Scott Murray<br />
Portfolio Manager<br />
Tim Swingle<br />
Senior Analyst<br />
Deryck Lampe<br />
Senior Portfolio Manager<br />
U.S. Equity Enhanced Index<br />
The U.S. Equity Internal Management group is organized with a total of nine equity analysts, one portfolio<br />
manager and a senior portfolio manager. The operation has changed substantially over the last 18 months<br />
with a new investment philosophy and investment process. The process is highlighted by a highly<br />
structured investment philosophy focused on maximizing risk adjusted returns. This is achieved through an<br />
intense iterative process between analysts and portfolio managers where each target security is analyzed<br />
across numerous variables to consistently assess relative competitive advantage and the associated risk in<br />
achieving the advantage. The approach is centered on the notion that each security has an intrinsic value<br />
and that it can be identified through thorough modeling and a strong understanding of critical variables.<br />
Although security selection is at the forefront of the approach, a significant amount of quantitative modeling<br />
is used to ascertain the level of exposure to individual variables and insure factor exposure is adequately<br />
contained.<br />
Currently, the U.S. Equity Internal Management group is responsible for the internally managed Enhanced<br />
Index and REIT portfolios valued at approximately $5.4 billion. The Enhanced Index portfolio uses the<br />
Russell1000 as its benchmark and the REIT portfolio is benchmarked against the Wilshire Real Estate<br />
Securities Index (RESI).<br />
14<br />
Chris Gregson<br />
Senior Analyst<br />
Kevin Martin<br />
Senior Analyst<br />
Mike Parker<br />
Equity Analyst<br />
Brian Langenberg<br />
Senior Analyst<br />
Jake Lake<br />
Equity Analyst<br />
Senior Analyst<br />
Vacant
2 0 1 0 I N V E S T M E N T P L A N<br />
INVESTMENT PROGRAM<br />
External Management<br />
Louis Darmstadter<br />
Portfolio Manager<br />
Private Equity<br />
Samir Sidani<br />
Senior <strong>Investment</strong><br />
Analyst<br />
Portfolio Manager<br />
Vacant<br />
<strong>Investment</strong> Analyst<br />
Vacant<br />
Portfolio Assistant<br />
Vacant<br />
Junior Analyst<br />
Vacant<br />
Kimberly Van Gundy<br />
<strong>Investment</strong><br />
Administration Analyst<br />
DeAnne Rau<br />
Portfolio Manager<br />
Public Markets<br />
John Blue<br />
Senior <strong>Investment</strong><br />
Analyst<br />
Dan Sarver<br />
Portfolio Manager<br />
<strong>Investment</strong> Analyst<br />
Hedge Funds<br />
Vacant<br />
The External Management group consists of the External Public Markets, Private Equity, Private Real<br />
Estate and Infrastructure teams. External Public Markets includes all external managers pursuing U.S.<br />
Equity, Non-U.S. Equity, High Yield, Emerging Market Debt and Hedge Fund strategies.<br />
Each of these teams develops and implements investment strategies and is responsible for the relative<br />
investment performance of their asset class or functional area. They perform due diligence, select<br />
managers, monitor activities of existing managers and adjust portfolio exposures.<br />
Within all asset classes there is “misfit” risk arising from operating under broadly defined benchmarks for<br />
the asset class while employing managers who pursue narrower strategies in implementation. Through<br />
manager selection, use of derivatives and rebalancing, it is possible to manage this misfit while potentially<br />
adding value in the same way that a portfolio manager seeks relative value in the securities chosen for her<br />
or his portfolio. In addition to manager selection, each of the teams within External Management must<br />
develop and implement strategies to effectively manage benchmark misfit risk.<br />
15<br />
Rick Shafer<br />
Deputy CIO<br />
Brad Sturm<br />
Portfolio Manager<br />
Real Estate<br />
Stephen Stuckwisch<br />
Portfolio Manager<br />
Lewis Tracy<br />
Senior <strong>Investment</strong><br />
Analyst<br />
Portfolio Manager<br />
Infrastructure<br />
Vacant
2 0 1 0 I N V E S T M E N T P L A N<br />
INVESTMENT PROGRAM<br />
<strong>Investment</strong> Governance<br />
In addition to the organizational structure described, the CIO utilizes a variety of committees, working<br />
groups and meeting structures to govern the <strong>Investment</strong> Division’s activities. This internal governance<br />
arrangement enhances collective inputs, retains institutional knowledge, provides documentation of the due<br />
diligence process and other processes, promotes transparency and accountability and formalizes decisionmaking<br />
processes. Internal governance is designed to combine structure and flexibility to efficiently bring<br />
the appropriate decision makers together on a timely basis and maintain a control environment to minimize<br />
operational risk. We nonetheless are always looking for ways to counteract any “group-think” that enters<br />
the process.<br />
Committee Structure<br />
Fund Asset<br />
Allocation and<br />
Strategy<br />
External Public<br />
Markets<br />
Real Estate<br />
Private Equity<br />
U.S. Equity<br />
Global Bonds<br />
Index Portfolios<br />
<strong>Investment</strong> Related<br />
<strong>Investment</strong><br />
Strategy Group<br />
Infrastructure<br />
Hedge Funds<br />
Defined<br />
Contribution<br />
Oversight<br />
Transition<br />
Management<br />
Iran Sudan<br />
Divestiture<br />
16<br />
Board<br />
Board<br />
<strong>Investment</strong> Committee<br />
CIO<br />
Risk Related<br />
Risk Steering<br />
Counterparty<br />
Operational<br />
Broker Review<br />
Pricing, Valuation<br />
and Performance<br />
Management<br />
Related<br />
Compliance<br />
<strong>Plan</strong>ning<br />
Quarterly<br />
Department<br />
Meetings
2 0 1 0 I N V E S T M E N T P L A N<br />
INVESTMENT PROGRAM<br />
The following exhibit illustrates the structure and relationship of the policies within the total System and its<br />
three investment funds.<br />
DEFINED BENEFIT<br />
FUND<br />
Statement of<br />
<strong>Investment</strong><br />
Objectives and Policies<br />
Defined Benefit Fund<br />
TOTAL <strong>OPERS</strong> SYSTEM<br />
HEALTH CARE<br />
FUND<br />
FUND POLICIES<br />
Statement of<br />
<strong>Investment</strong><br />
Objectives and Policies<br />
Health Care Fund<br />
ASSET CLASS POLICIES<br />
Public Equities Policy<br />
Public Fixed Income Policy<br />
Cash Management Policy<br />
Private Equity Policy<br />
Real Estate Policy<br />
Opportunistic Fund Policy<br />
Member Directed Policy<br />
Hedge Fund Policy (TBD)<br />
Infrastructure Policy (TBD)<br />
Liquidity Policy (TBD)<br />
OTHER INVESTMENT RELATED POLICIES<br />
Broker - Dealer Policy<br />
Derivatives Policy<br />
External Managers’ Insurance Policy<br />
External Public Manager Evaluation Policy<br />
External Public Manager Search Policy<br />
Iran and Sudan Divestment Policy<br />
Material Nonpublic Information Policy<br />
Ohio-Qualified Manager Policy<br />
Personal Trading Policy<br />
Responsible Contractor Policy<br />
Securities Lending Policy<br />
Soft Dollar and Other Brokerage Commission Policies<br />
17<br />
DEFINED CONTRIBUTION<br />
FUND<br />
Statement of<br />
<strong>Investment</strong><br />
Objectives and Policies<br />
Defined Contribution Fund
2 0 1 0 I N V E S T M E N T P L A N<br />
INVESTMENT PROGRAM<br />
The schematic below provides the detail of the committees comprising the internal governance<br />
arrangement. The committees and working groups listed below vary in both the frequency of meetings and<br />
the degree of structure and formality—some provide informal information sharing and some have formal<br />
written charters.<br />
The CIO or deputy CIO’s chair the committees, or provide leadership to the working groups or formal<br />
meetings listed below.<br />
Committees Attendees Purpose Frequency Authority<br />
Broker Review<br />
Compliance<br />
Counterparty<br />
Defined Contribution<br />
Oversight<br />
External Public<br />
Markets<br />
Fund Asset Allocation<br />
and Strategy<br />
Global Bonds<br />
Index Portfolios<br />
Infrastructure<br />
<strong>Investment</strong> Strategy<br />
Group<br />
Staff and Senior<br />
Management<br />
Staff and Senior<br />
Management<br />
Staff and Senior<br />
Management<br />
External<br />
Management Staff<br />
Staff and Senior<br />
Management<br />
Staff and Senior<br />
Management<br />
Internal<br />
Management Staff<br />
Internal<br />
Management Staff<br />
Internal<br />
Management Staff<br />
Staff and Senior<br />
Management<br />
Monitor, Review and Approve<br />
Brokers and Commissions<br />
Escalate and Resolve Compliance<br />
Issues<br />
Monitor, Review and Approve<br />
Counterparty Limits<br />
18<br />
Monthly Approval<br />
Twice Monthly Approval<br />
Monthly Approval<br />
Coordinate with DC team Monthly Discussion<br />
External Public Manager/ Hedge<br />
Fund Oversight & Selection<br />
Review Asset Allocation and<br />
Strategies, Cash Forecasting,<br />
Fund and Portfolio Risk Metrics<br />
and Manager Guidelines<br />
Perform Sector Reviews and<br />
Outlooks, Discuss Portfolio<br />
Composition and Risk<br />
Management Issues<br />
Review Markets, Strategies<br />
and Internally Managed Index<br />
Portfolios<br />
Preliminary and Final Transaction<br />
Review<br />
Monthly Approval<br />
Weekly Approval<br />
Bi-Weekly<br />
Daily<br />
As Needed<br />
Portfolio<br />
Decisions<br />
Portfolio<br />
Decisions<br />
Portfolio<br />
Decisions<br />
Floating Agenda Monthly Discussion<br />
continued
2 0 1 0 I N V E S T M E N T P L A N<br />
INVESTMENT PROGRAM<br />
Committees Attendees Purpose Frequency Authority<br />
Operational Risk<br />
Staff and Senior<br />
Management<br />
Identify and Monitor Risks Arising<br />
from <strong>Investment</strong> Implementation<br />
19<br />
Quarterly At<br />
Minimum<br />
Discussion<br />
<strong>Plan</strong>ning Senior Staff Activity Coordination Monthly Discussion<br />
Pricing, Valuation and<br />
Performance<br />
Private Equity<br />
Real Estate<br />
Risk Steering<br />
Transition<br />
Management<br />
U.S. Equity<br />
Internal<br />
Management Staff<br />
Staff and Senior<br />
Management<br />
Staff and Senior<br />
Management<br />
Senior<br />
Management<br />
Int. and Ext.<br />
Management Staff<br />
Internal<br />
Management Staff<br />
Address and Resolve Pricing,<br />
Valuation, Performance and<br />
Benchmark Issues<br />
Preliminary and Final<br />
Transaction Review<br />
Preliminary and Final<br />
Transaction Review<br />
Risk Assessments and<br />
Prioritization<br />
Transition Large Amounts<br />
Between Managers<br />
Strategy, Tactics, News Flow &<br />
Training<br />
As Needed Discussion<br />
As Needed Approval<br />
As Needed Approval<br />
Monthly Discussion<br />
As Needed<br />
The following committees and working groups have investment Staff representation to facilitate<br />
communication and interaction across <strong>OPERS</strong> divisions.<br />
Advisors Council<br />
Corporate Governance Working Group<br />
Guiding Council<br />
Iran Sudan Divestiture Committee<br />
Leadership Council<br />
Management Council<br />
Technology Council<br />
Daily<br />
Portfolio<br />
Decisions<br />
Portfolio<br />
Decisions
2 0 1 0 I N V E S T M E N T P L A N<br />
INVESTMENT PROGRAM<br />
Resources<br />
Staffing<br />
Recruiting and retaining the best and most talented Staff is a critical priority for the <strong>Investment</strong> Division.<br />
Here is a presentation of anticipated full staffing for 2010:<br />
Office<br />
of<br />
the CIO<br />
20<br />
Fund<br />
Mgmt.<br />
Target Staffing for Year End 2010<br />
Global<br />
Bonds<br />
Internal<br />
Mgmt.<br />
U.S. Equity<br />
Internal<br />
Mgmt.<br />
External<br />
Mgmt.<br />
Total<br />
Invest.<br />
Division<br />
2009 <strong>Investment</strong> <strong>Plan</strong> Projected Staffing 11 11 10 11 12 55<br />
Current Staffing 4 11 11 10 10 46<br />
Vacant Positions - To be filled in 2010 4 1 1 1 6 13<br />
Year End 2010 Target Staffing 8 12 12 11 16 59<br />
Status of Open Positions During Fourth Quarter 2009<br />
Position Vacant<br />
Office of the CIO CIO 1<br />
Office of the CIO Junior Analyst 1<br />
Office of the CIO Compliance Analyst 1<br />
Office of the CIO Risk Analyst 1<br />
Fund Management Portfolio Assistant 1<br />
Global Bonds Internal Management Securitized Products Analyst 1<br />
U.S. Equity Internal Management Senior Analyst 1<br />
External Management Junior Analyst 1<br />
External Management Portfolio Manager - Private Equity 1<br />
External Management <strong>Investment</strong> Analyst - Private Equity 1<br />
External Management Portfolio Assistant 1<br />
External Management Hedge Fund Analyst 1<br />
External Management Portfolio Manager - Infrastructure 1<br />
Total 13
2 0 1 0 I N V E S T M E N T P L A N<br />
INVESTMENT PROGRAM<br />
The following chart compares <strong>OPERS</strong>’ asset size and staffing as of June 30, 2009 to its peer group.<br />
Individual peers are listed in the table below.<br />
Assets ($ billions)<br />
$200<br />
$150<br />
$100<br />
$50<br />
$0<br />
11 Large State <strong>Plan</strong>s as of 6/30/2009<br />
0 50 100 150 200 250<br />
The chart above suggests that the <strong>Investment</strong> Division staffing level is relatively low compared to its asset<br />
base, particularly given the extent of internal management of assets. The focus of the management team<br />
continues to be on effectively increasing productivity and improving results without significantly increasing<br />
Staff size, except when new responsibilities and asset classes are added.<br />
The following table lists the public pension peer group referenced in the chart above and in other sections<br />
of this Annual <strong>Investment</strong> <strong>Plan</strong>.<br />
21<br />
<strong>Investment</strong> Staff<br />
11 Large State <strong>Plan</strong>s as of 6/30/2009<br />
Peers Assets ($ millions) <strong>Investment</strong> Staff<br />
California Public Employees' Retirement System $169,417 229<br />
California State Teachers' Retirement System $118,927 100<br />
New York Common Retirement Fund $109,886 45<br />
Washington State <strong>Investment</strong> Board $95,769 80<br />
Florida State Board of Administration $90,201 65<br />
New Jersey Division of <strong>Investment</strong> $57,809 70<br />
North Carolina Retirement System $55,953 21<br />
Ohio Public Employees Retirement System $54,281 46<br />
State of Wisconsin <strong>Investment</strong> Board $52,568 124<br />
Ohio State Teachers Retirement System $47,644 111<br />
Division of <strong>Investment</strong> Services - State of Georgia $11,534 49
2 0 1 0 I N V E S T M E N T P L A N<br />
INVESTMENT PROGRAM<br />
Staffing Costs<br />
Assuming full staffing levels in 2010, the chart below details the estimated annual cost of salaries, benefits<br />
and incentive compensation for the <strong>Investment</strong> Division.<br />
Office<br />
of the<br />
CIO<br />
By comparison, the estimated total compensation costs for 2009 were $11.16 million or 1.47 basis points on<br />
$76.16 billion in average assets. The increase in total 2010 compensation costs is entirely due to filling<br />
budgeted positions and adding four new ones.<br />
Operating Budget<br />
The <strong>Investment</strong> Division’s 2010 operating budget (excluding compensation) as of October 8, 2009, was<br />
$6.65 million (this operating budget is subject to change prior to its final approval in late 2009). This<br />
operating budget reflects an increase of $0.62 million, or 10.2% percent, from the 2009 budget.<br />
22<br />
Estimated 2010 Total Compensation Costs ($ millions)<br />
Fund<br />
Mgmt.<br />
Global<br />
Bonds<br />
Internal<br />
Mgmt.<br />
U.S. Equity<br />
Internal<br />
Mgmt.<br />
External<br />
Mgmt.<br />
Total<br />
Invest.<br />
Division<br />
Salaries 0.99 1.40 1.49 1.47 2.12 7.47<br />
Benefits 0.30 0.49 0.55 0.55 0.71 2.60<br />
Incentive Compensation 0.00 0.25 0.35 0.35 0.25 1.20<br />
Total Compensation 1.28 2.14 2.40 2.37 3.09 11.27<br />
Average Assets in $ billions NA 18.14 17.38 4.65 29.39 69.56<br />
Compensation in Basis Points NA 1.2 1.4 5.1 1.1 1.62<br />
Office<br />
of the<br />
CIO<br />
Operating Budget less Total Compensation ($ millions)<br />
Fund<br />
Mgmt.<br />
Global<br />
Bonds<br />
Internal<br />
Mgmt.<br />
U.S. Equity<br />
Internal<br />
Mgmt.<br />
External<br />
Mgmt.<br />
Total<br />
Invest.<br />
Division<br />
2009 Operating Budget 1.19 1.17 0.76 0.55 2.36 6.03<br />
2010 Operating Budget 1.47 1.31 0.86 0.61 2.40 6.65<br />
Percent Change 23.1% 12.1% 13.3% 10.2% 1.8% 10.2%<br />
Percent of Total 22.1% 19.8% 12.9% 9.2% 36.1% 100.0%<br />
Average Assets in $ billions NA 18.14 17.38 4.65 29.39 69.56<br />
Operating Budget in Basis Points NA 0.72 0.49 1.31 0.82 0.96
2 0 1 0 I N V E S T M E N T P L A N<br />
INVESTMENT PROGRAM<br />
2010 Operating Budget<br />
Audit/Legal/<br />
Consulting Services<br />
40.75%<br />
Quotes & Data<br />
Feeds<br />
26.64%<br />
23<br />
Office Supplies &<br />
Equipment<br />
0.05%<br />
Analytics<br />
10.52%<br />
Research<br />
8.98%<br />
Training & Travel<br />
6.66%<br />
IT<br />
6.40%<br />
The chart above shows the allocation of the operating expenses across major budget categories.<br />
The primary expenses for Audit/Legal/Consulting services are for the Division and individual asset<br />
classes. For 2010, estimated Audit/Legal/Consulting fees total $1.85 million, which is 28% of the total<br />
operating budget.<br />
The primary expenses in the Quotes and Data Feeds category are for data and services provided by<br />
vendors such as Bloomberg, Bloomberg POMS, Thomson Reuters and Factset.<br />
The Analytics category includes tools and analytics provided by BARRA, Russell, Yield Book and<br />
Quantitative Services Group.<br />
Research expenses are comprised of independent research services such as Thomson Reuters,<br />
Moody's Credit Reports, MSCI Index Service, Intex, Trepp, Global Trading Analytics and RiskMetrics.<br />
Training and Travel expenses include all business travel, which is primarily for due diligence on new<br />
investments, monitoring existing investments, enhancing operational capabilities and promoting Staff’s<br />
educational and professional growth.<br />
IT expenses are for the Charles River Trade Order Management System, eFront and Eagle PACE data<br />
warehouse.
2 0 1 0 I N V E S T M E N T P L A N<br />
INVESTMENT PROGRAM<br />
Management Fees<br />
The expected annual management fees by asset class for the <strong>Investment</strong> Division are in the chart below.<br />
The estimate of fees is based on the 2010 estimated average market value for the Defined Benefit and<br />
Health Care Funds, as detailed in the average assets section below.<br />
Estimate of External and Internal Management Fees in Dollars and Basis Points<br />
Total for 2010<br />
Average<br />
Assets<br />
($ millions)<br />
External Management Internal Management<br />
Annual<br />
Fee<br />
($ millions)<br />
There is a very obvious difference between the scale of internal and external management fees. Within<br />
U.S. Equity, the high proportion of passive assets contributes to the much lower internal management fees,<br />
reducing them by more than half over what they would be for active assets. However, the overwhelming<br />
portion of the difference between external and internal is that it is simply cheaper to manage assets<br />
internally (lower salaries and incentives, lower rent, less travel, no marketing costs, no stand-alone<br />
business expenses and no profit margin).<br />
24<br />
Annual<br />
Fee<br />
(bps)<br />
Average<br />
Assets<br />
($ millions)<br />
Annual<br />
Fee<br />
($ millions)<br />
Annual<br />
Fee<br />
(bps)<br />
Public Equity 19,191 48.2 25.1 21,723 2.2 1.0<br />
U.S. Equity 4,386 10.5 23.9 21,723 2.2 1.0<br />
Non-U.S. Equity 14,805 37.7 25.4 NA NA NA<br />
Public Fixed Income 1,449 6.3 43.3 17,383 1.7 1.0<br />
Core Fixed 109 0.4 35.0 8,357 0.6 0.7<br />
Long Bonds NA NA NA 5,492 0.4 0.7<br />
TIPS NA NA NA 2,342 0.1 0.5<br />
Short Bonds NA NA NA 575 0.2 3.9<br />
High Yield 953 4.1 43.4 NA NA NA<br />
Emerging Mkt Debt 387 1.8 45.6 NA NA NA<br />
Liquidity NA NA NA 618 0.3 5.4<br />
Alternatives 8,732 139.8 160.1 1,083 0.3 3.1<br />
Private Equity 2,777 74.0 266.4 NA NA NA<br />
Real Estate 5,210 56.5 108.4 NA NA NA<br />
REIT NA NA NA 708 0.3 3.9<br />
Opportunistic/Hedge Funds 569 6.4 112.5 357 0.0 0.6<br />
Infrastructure 177 2.9 166.1 NA NA NA<br />
Commodities NA NA NA 18 0.0 19.0<br />
Total Fund 29,373 194.3 66.1 40,190 4.2 1.0
2 0 1 0 I N V E S T M E N T P L A N<br />
INVESTMENT PROGRAM<br />
Average Assets<br />
The table below shows a summary of actual and estimated assets for the Defined Benefit and Health Care Funds.<br />
Office<br />
of the<br />
CIO<br />
The combined assets are based on 2010 target portfolio and asset class allocations for the Defined Benefit<br />
and Health Care Funds. The estimated assets reflect the Defined Benefit and Health Care Funds<br />
estimated market values, returns and cash flows as detailed in the Defined Benefit and Health Care Funds<br />
Strategies section of this plan.<br />
Total Costs<br />
The estimated total cost of the investment program in 2010 will be $217.25 million or 31.2 basis points of<br />
assets under management. This compares to the total costs in the 2009 Annual <strong>Investment</strong> <strong>Plan</strong> of $197.42<br />
million or 25.9 basis points of assets under management. The increase reflects the growing allocation to<br />
more complex externally managed asset classes such as Private Equity and Private Real Estate.<br />
CEM Benchmarking, Inc. is an independent benchmarking firm for pension plans and provides an<br />
assessment of <strong>OPERS</strong> investment operations relative to a global set of peers. In 2008, <strong>OPERS</strong> actual cost<br />
of 21.5 basis points was below the benchmark cost of 26.3 basis points. This savings of 4.8 basis points<br />
amounts to $33.4 million on average assets of $69.56 billion.<br />
25<br />
Actual and Estimated Assets<br />
Combined Defined Benefit and Health Care Funds<br />
($ billions)<br />
Fund<br />
Mgmt.<br />
Global<br />
Bonds<br />
Internal<br />
Mgmt.<br />
U.S. Equity<br />
Internal<br />
Mgmt.<br />
External<br />
Mgmt.<br />
Total<br />
Invest.<br />
Division<br />
August 31, 2009 Actual Unaudited NA $17.2 $16.3 $5.9 $26.1 $65.5<br />
December 31, 2009 Estimated NA $17.6 $17.3 $5.2 $28.2 $68.3<br />
Average 2010 Estimated NA $18.1 $17.4 $4.7 $29.4 $69.6<br />
December 31, 2010 Estimated NA $16.9 $17.5 $3.7 $32.7 $70.8<br />
Office<br />
of the<br />
CIO<br />
Fund<br />
Mgmt.<br />
Estimated 2010 Total Costs<br />
($ millions)<br />
U.S. Equity<br />
Internal<br />
Mgmt.<br />
Global<br />
Bonds<br />
Internal<br />
Mgmt.<br />
External<br />
Mgmt.<br />
Total<br />
Invest.<br />
Division<br />
Total Compensation 1.28 2.14 2.37 2.40 3.09 11.27 5.2%<br />
Operating Budget less Compensation 1.47 1.31 0.61 0.86 2.40 6.65 3.1%<br />
Manager Fees 194.27 194.27 89.4%<br />
Custody and Overhead 5.05 2.3%<br />
Total Costs 2.75 3.45 2.98 3.25 199.76 217.25 100.0%<br />
Percent of Total 1.3% 1.6% 1.4% 1.5% 91.9%<br />
Average 2009 Asset Size ($ b) NA 18.14 4.65 17.38 29.39 69.56<br />
Costs in Basis Points to Asset Class NA 1.9 6.4 1.9 68.0 NA<br />
Costs in Basis Points to Total Fund 0.4 0.5 0.4 0.5 28.7 31.2<br />
% of<br />
Total
2 0 1 0 I N V E S T M E N T P L A N<br />
Fund<br />
Strategies
2 0 1 0 I N V E S T M E N T P L A N<br />
FUND STRATEGIES<br />
Defined Benefit Fund<br />
Expected Asset Growth<br />
The table below summarizes Staff’s estimate of market value and ranges for the Defined Benefit Fund at<br />
December 31, 2010. The pessimistic and optimistic cases are based on the 2010 assumptions listed in the<br />
Defined Benefit Fund’s Return and Risk section.<br />
The anticipated market value of $56.6 billion for December 31, 2009 is derived by a smoothing projection<br />
that incorporates both the actual Defined Benefit Fund return through August 31, 2009 and the expected<br />
full-year return for 2009 presented in the 2009 Annual <strong>Investment</strong> <strong>Plan</strong>.<br />
26<br />
Defined Benefit Fund<br />
2010 Expected Asset Growth<br />
Estimated Market Values, Returns and Cash Flows<br />
Pessimistic<br />
Case<br />
Base<br />
Case<br />
Optimistic<br />
Case<br />
12/31/09 Market Value ($ billions) $56.6 $56.6 $56.6<br />
Expected Total Return -9.9% 7.6% 27.4%<br />
Expected <strong>Investment</strong> Gain ($ billions) ($5.6) $4.3 $15.5<br />
Expected Cash Flow ($ billions) ($2.0) ($2.0) ($2.0)<br />
12/31/10 Market Value ($ billions) $49.0 $58.9 $70.1
2 0 1 0 I N V E S T M E N T P L A N<br />
FUND STRATEGIES<br />
Asset Allocation<br />
The 2010 target asset allocation and ranges for the Defined Benefit Fund reflect an estimate by Staff of the<br />
progress that may be made towards the new asset allocations adopted in 2009. They are shown below<br />
along with actual allocations of comparable peers as of June 30, 2009.<br />
8/31/2009 12/31/10<br />
Peer<br />
Asset Class<br />
Actual<br />
Target Range<br />
Group*<br />
Public Equity 64.4% 58.3% 40% to 60% 53.8%<br />
U.S. Equity 43.2% 36.8% 20% to 30% 34.4%<br />
Non-U.S. Equity 21.1% 21.5% 20% to 30% 19.4%<br />
Public Fixed Income 22.9% 24.3% 15% to 32% 29.6%<br />
Core Fixed 12.0% 11.7% 6% to 12% 28.1%<br />
Long Bonds 9.3% 9.4% 6% to 12% NA<br />
High Yield 0.7% 2.0% 2% to 8% 1.5%<br />
Liquidity 0.9% 1.1% 0% to 4% NA<br />
Alternatives 12.7% 17.4% 8% to 30% 16.6%<br />
Private Equity 3.9% 5.2% 0% to 14% 6.2%<br />
Real Estate 8.2% 10.0% 0% to 14% 6.8%<br />
Opportunistic/Hedge Funds 0.6% 1.6% 0% to 5% 3.6%<br />
Infrastructure 0.0% 0.6% 0% to 3% NA<br />
Total Defined Benefit Fund 100.0% 100.0% 100.0%<br />
*Peer group defined previously in the <strong>Investment</strong> Program section of this plan.<br />
The internally managed opportunistic distressed fixed income assets are included in the<br />
Opportunistic/Hedge Funds asset class. The asset mix shown above moves the Defined Benefit Fund<br />
toward the asset allocation targets that were developed based on an asset-liability study completed in 2009.<br />
Throughout 2010 and beyond, Staff will work with <strong>OPERS</strong>’ Advisors to recommend certain enhancements<br />
to the asset mix and asset management strategies targeted at raising the expected return within acceptable<br />
risk levels. While not all of these strategies have been clearly defined, several are described in the Asset<br />
Class Strategies section later in this plan.<br />
27
2 0 1 0 I N V E S T M E N T P L A N<br />
FUND STRATEGIES<br />
Estimated assets in dollar amounts are listed below and are based on December 31, 2010 target<br />
allocations.<br />
Actual<br />
Assets<br />
($ billions)<br />
Estimated assets represent Staff’s general expectation for progress towards transitioning assets to the<br />
Board’s recently approved long-term asset allocation targets. Actual assets at future points in time will be<br />
within Board-approved ranges but will also reflect market outcomes, opportunities for Staff to transition<br />
assets in an efficient and cost effective manner and the availability of attractive investment opportunities. It<br />
is estimated that the Board’s long-term asset allocation targets will substantially be achieved within the next<br />
three years. Private Market asset classes, such as Private Equity and Real Estate, will continue to be<br />
invested according to their long-term pacing models and may take five years to fully reach Board targets.<br />
Details of expected Private Market commitments and fundings are provided in the Asset Class Strategies<br />
section of this plan.<br />
28<br />
Estimated<br />
Assets<br />
($ billions)<br />
Target<br />
Allocation<br />
8/31/2009 12/31/2009 2010 Average 12/31/2010 12/31/2010<br />
Public Equity $35.0 $35.4 $34.9 $34.4 58.3%<br />
U.S. Equity $23.5 $24.1 $22.9 $21.7 36.8%<br />
Non-U.S. Equity $11.5 $11.3 $12.0 $12.7 21.5%<br />
Public Fixed Income $12.5 $13.6 $14.0 $14.3 24.3%<br />
Core Fixed $6.5 $7.3 $7.1 $6.9 11.7%<br />
Long Bonds $5.1 $5.4 $5.5 $5.5 9.4%<br />
High Yield $0.4 $0.4 $0.8 $1.2 2.0%<br />
Liquidity $0.5 $0.4 $0.5 $0.7 1.1%<br />
Alternatives $6.9 $7.6 $8.9 $10.2 17.4%<br />
Private Equity $2.1 $2.5 $2.8 $3.1 5.2%<br />
Real Estate $4.5 $4.5 $5.2 $5.9 10.0%<br />
Opportunistic/Hedge Funds $0.3 $0.6 $0.8 $0.9 1.6%<br />
Infrastructure $0.0 $0.0 $0.2 $0.4 0.6%<br />
Total Defined Benefit Fund $54.4 $56.6 $57.8 $58.9 100.0%
2 0 1 0 I N V E S T M E N T P L A N<br />
FUND STRATEGIES<br />
Composition of <strong>Investment</strong> Portfolio<br />
The Public Equity and Public Fixed Income asset classes are managed identically for both the Health Care<br />
and Defined Benefit Funds; however, the allocations to all asset classes may vary as they reflect unique<br />
circumstances for each fund. The table below shows the Defined Benefit Fund’s projected June 30, 2010<br />
allocation between internal and external asset management by asset class along with actual allocations of<br />
comparable peers as of June 30, 2009.<br />
Internal Management External Management<br />
Asset Class<br />
<strong>OPERS</strong> Peer Group* <strong>OPERS</strong> Peer Group*<br />
Public Equity<br />
U.S. Equity 83.2% 63.2% 16.8% 36.8%<br />
Non-U.S. Equity<br />
Public Fixed Income<br />
0.0% 30.1% 100.0% 69.9%<br />
Core Fixed 98.7% 84.8% 1.3% 15.3%<br />
Long Bonds 100.0% NA 0.0% NA<br />
High Yield 0.0% 0.7% 100.0% 99.3%<br />
Liquidity<br />
Alternatives<br />
100.0% NA 0.0% NA<br />
Private Equity 0.0% 1.7% 100.0% 98.3%<br />
Real Estate 0.0% 13.8% 100.0% 86.2%<br />
Opportunistic/Hedge Funds 33.7% 0.0% 66.3% 100.0%<br />
Infrastructure 0.0% NA 100.0% NA<br />
Weighted Averages 53.3% 52.5% 46.7% 47.5%<br />
*Peer group defined previously in the <strong>Investment</strong> Program section.<br />
The table shows that <strong>OPERS</strong> is similar to its peer group overall but differs in the much higher use of internal<br />
management for U.S. Equity and Public Fixed Income. The amount shown as <strong>OPERS</strong> internally managed<br />
Opportunistic/Hedge Funds represents the opportunistic distressed fixed income assets. Internal assets<br />
under management have declined for both <strong>OPERS</strong> and peers from the prior year (see 2009 Annual<br />
<strong>Investment</strong> <strong>Plan</strong>). <strong>OPERS</strong> is somewhat dissimilar from its peer group in exclusively using external asset<br />
management in the Non-U.S. Equity asset class. As noted in the Report from the CIO, during 2010 Staff<br />
will further explore managing passive Non-U.S. Equity assets internally.<br />
<strong>OPERS</strong>’ use of internal asset management provides many advantages including:<br />
Flexibility: Rebalancing decisions are executed efficiently and cost-effectively. Control over the assets<br />
enables <strong>OPERS</strong> to reposition its portfolios as opportunities arise and market conditions change.<br />
Cost control: Asset management is a high-margin business, and over the long term, external asset<br />
management fees can create a material drag on net returns. External asset management fees typically<br />
range from a multiple of six to 20 times the cost of managing assets internally. Where internally<br />
managed portfolios can provide very cost-effective exposure to asset beta, or competitive alpha to<br />
externally managed assets, there is a major benefit to <strong>OPERS</strong> from internal management.<br />
29
2 0 1 0 I N V E S T M E N T P L A N<br />
FUND STRATEGIES<br />
Market insight: Internal asset management provides important information across asset classes to help<br />
in decision-making processes such as:<br />
External manager hiring and oversight—improves Staff’s ability to assess external manager<br />
strengths and weaknesses.<br />
Across markets—frequently, Staff can leverage information garnered from one asset class<br />
to support decision-making in another asset class.<br />
More effective payment of pension and health care benefits, operating expenses and funding of external<br />
managers – cash to pay benefits, operating expenses or fund external managers can be raised<br />
immediately from internally managed assets whereas raising cash from external managers can take<br />
weeks or longer.<br />
The table below shows the Defined Benefit Fund’s projected June 30, 2010 allocation between active and<br />
passive asset management by asset class along with actual allocations of comparable peers as of June 30,<br />
2009. The share of active management for <strong>OPERS</strong> will necessarily rise to reflect the new larger allocations<br />
to alternatives and liquid market strategies that cannot be effectively indexed, such as high yield.<br />
Public Equity<br />
Asset Class<br />
*Peer group defined previously in the <strong>Investment</strong> Program section.<br />
Active Management Passive Management<br />
<strong>OPERS</strong> Peer Group* <strong>OPERS</strong> Peer Group*<br />
U.S. Equity 31.9% 40.9% 68.1% 59.1%<br />
Non-U.S. Equity 82.5% 84.3% 17.5% 15.7%<br />
Public Fixed Income<br />
Core Fixed 100.0% 81.8% 0.0% 18.2%<br />
Long Bonds 100.0% NA 0.0% NA<br />
High Yield 100.0% 83.3% 0.0% 16.7%<br />
Liquidity 100.0% NA 0.0% NA<br />
Alternatives<br />
Private Equity 100.0% 100.0% 0.0% 0.0%<br />
Real Estate 100.0% 99.7% 0.0% 0.3%<br />
Opportunistic/Hedge Funds 100.0% 75.0% 0.0% 25.0%<br />
Infrastructure 100.0% NA 0.0% NA<br />
Weighted Averages 71.2% 70.3% 28.8% 29.7%<br />
30
2 0 1 0 I N V E S T M E N T P L A N<br />
FUND STRATEGIES<br />
Return and Risk<br />
The Defined Benefit Fund’s performance objective is to earn a long-term rate of return that exceeds the<br />
return of the Defined Benefit Fund policy benchmark within an appropriately constrained risk framework.<br />
The table shows expected returns for 2010 along with its ranges. These are the ‘beta’ returns expected<br />
from each asset class, without regard to over- or under-performance relative to the benchmarks.<br />
2010 Policy Return Assumptions<br />
Asset Classes Pessimistic Base Optimistic<br />
Public Equity -10.0% 8.4% 28.5%<br />
U.S. Equity -10.1% 8.4% 28.5%<br />
Non-U.S. Equity -9.9% 8.4% 28.5%<br />
Public Fixed Income -3.7% 3.7% 13.7%<br />
Core Fixed -1.1% 3.2% 10.6%<br />
Long Bonds -6.5% 4.1% 16.7%<br />
High Yield -11.0% 7.2% 28.2%<br />
Liquidity 0.3% 1.0% 2.3%<br />
Alternatives -14.2% 8.2% 35.4%<br />
Private Equity -16.7% 9.6% 41.2%<br />
Real Estate -14.3% 7.6% 35.1%<br />
Opportunistic/Hedge Funds -4.4% 7.0% 18.6%<br />
Infrastructure -14.2% 8.2% 27.8%<br />
Total Return -9.9% 7.6% 27.4%<br />
31
2 0 1 0 I N V E S T M E N T P L A N<br />
FUND STRATEGIES<br />
Active Return and Risk<br />
The following table details the expected excess performance, or active return, and the tracking error<br />
(volatility of active returns) for each asset class, as well as the overall fund. Expected active returns for<br />
several items in the following table are set at zero. Typically, this is because the benchmark chosen already<br />
contemplates excess returns. The Hedge Fund benchmark is LIBOR + 4%. Historically, such a return<br />
would approximate an equity return. However, this asset class is not normally expected to achieve equity<br />
returns, but rather to compound capital at a rate much higher than cash by preserving capital in bad times<br />
and earning it in good times. Therefore, a real return of 4% already contemplates excess returns.<br />
For real estate, the benchmark return is gross of fees while the expected return is net of fees. In such a<br />
high fee asset class, earning net returns that equal gross returns means that excess returns will be<br />
achieved by 100 or more basis points. The same logic applies to the infrastructure allocation. The<br />
expected excess return of zero in the liquidity allocation contemplates that seeking excess returns is<br />
counter-productive when the purpose of the allocation is to provide safety and liquidity in all investment<br />
environments.<br />
Tracking error is a standard measure of risk used in public market asset classes; we have extended it to<br />
alternatives as well. Where markets are generally more efficient, such as U.S. equity and public fixed<br />
income, the outperformance goals are modest. In less efficient markets, such as private equity, the goals<br />
for incremental return above the indices are more aggressive.<br />
32
2 0 1 0 I N V E S T M E N T P L A N<br />
FUND STRATEGIES<br />
Average<br />
Policy<br />
Allocation<br />
in Percent<br />
Public Equity 60.6%<br />
The table shows an anticipated active management contribution of 33 basis points to the fund’s return.<br />
The 80 basis points of estimated tracking error indicates a 68% probability that the active return will be in a<br />
range of -47 basis points to +113 basis points. This confidence interval is arrived at by subtracting the<br />
tracking error from, and adding the tracking error to, the expected active return. The target contribution to<br />
fund performance of 33 basis points for 2010 is equal to the 33 basis points projected for 2009.<br />
The figures shown in the table above are aggregated from the component portfolios in each of the asset<br />
classes. The tracking error that results at the fund level is lower than would be suggested by a simple<br />
weighted average due to the diversifying effects of the active return interaction among the managers and<br />
the asset classes.<br />
33<br />
Schedule of Expected Performance and Volatility<br />
Active Return<br />
Performance<br />
Objectives (bps)<br />
Active Return<br />
Performance<br />
Contribution<br />
(bps)<br />
Target<br />
Tracking<br />
Error<br />
(bps)<br />
Target<br />
Information<br />
Ratio<br />
U.S. Equity 39.8% 20 8.0 32 0.63<br />
Non-U.S. Equity 20.7% 75 15.6 115 0.65<br />
Public Fixed Income 24.2%<br />
Core Fixed 12.3% 23 2.8 75 0.31<br />
Long Bonds 9.5% 15 1.4 100 0.15<br />
High Yield 1.4% 82 1.1 325<br />
Liquidity 0.9% 0 0.0 30 0.00<br />
Alternatives 15.2%<br />
Private Equity 4.6% 100 4.6 750 0.13<br />
Real Estate 9.0% 0 0.0 600 0.00<br />
Opportunistic/Hedge Funds 1.3% 0 0.0 300 0.00<br />
Infrastructure 0.3% 0 0.0 300 0.00<br />
Total Defined Benefit Fund 100.0% NA 33 80 0.41
2 0 1 0 I N V E S T M E N T P L A N<br />
FUND STRATEGIES<br />
The return estimates below were derived from the asset class return expectations developed by internal<br />
Staff. The single-point estimate return of 7.56% is comprised of an expected return of 7.23% from the<br />
policy mix and an additional contribution of 0.33% from active management.<br />
2010 Total Return Assumptions<br />
Sources of Return Pessimistic Base Optimistic<br />
Policy -9.11% 7.23% 25.98%<br />
Tactical -0.30% 0.00% 0.30%<br />
Active -0.47% 0.33% 1.13%<br />
Total Return -9.88% 7.56% 27.41%<br />
Sources of Risk<br />
2010 Total Risk and Risk for Return Assumptions<br />
Due to rounding, the total return may not appear to sum correctly from the sources of return. Variability risk<br />
is measured by standard deviation for policy and total risk and by tracking error for active risk.<br />
The information ratio compares the active return of an asset to its most relevant benchmark index and is a<br />
measure of risk-adjusted return. The Sharpe Ratio compares the excess return of an asset against the<br />
return of the risk-free asset.<br />
As stated in the Report from the CIO, fund investments are measured and monitored within a specific<br />
framework, which identifies return and risk from three sources:<br />
Policy: The return and risk inherent in the policy asset mix (allocation) adopted by the Board. The mix<br />
has expected return and variability characteristics that arise directly from the underlying asset classes.<br />
The expected return of the <strong>OPERS</strong> Defined Benefit Fund policy mix is 7.23% for 2010 with an<br />
estimated risk, or variability, of 10.70%. As such, approximately two-thirds of the time, actual annual<br />
policy returns are expected to be within a range of –3.47% to +17.93%.<br />
Tactical: The return and risk introduced by deviations from the policy asset mix. The table above does<br />
not show any excess expected return from tactical asset allocation activities.<br />
Active: The return and risk introduced by active management (security selection).<br />
In summary, the total expected return of the Defined Benefit Fund in 2010 is 7.56%, which is the sum of the<br />
expected policy return of 7.23% and active return of 0.33%. The estimated risk anticipated to achieve this<br />
return is the combination of the policy, tactical and active risk, which is 10.70%.<br />
34<br />
Variability<br />
Risk<br />
Information<br />
Ratio<br />
Sharpe<br />
Ratio<br />
Policy 10.50% 0.59<br />
Tactical 0.30%<br />
Active 0.80% 0.41<br />
Total Risk 10.70% 0.61
2 0 1 0 I N V E S T M E N T P L A N<br />
FUND STRATEGIES<br />
Health Care Fund<br />
Expected Asset Growth<br />
The table below summarizes Staff’s estimate of market value and ranges for the Health Care Fund at<br />
December 31, 2010. The pessimistic and optimistic cases are based on the 2010 assumptions listed in the<br />
Health Care Fund’s Return and Risk section.<br />
The anticipated market value of $11.9 billion for December 31, 2009 is derived by a smoothing projection<br />
that incorporates both the actual Health Care Fund return through August 31, 2009 and the expected full<br />
year return for 2009 presented in the 2009 Annual <strong>Investment</strong> <strong>Plan</strong>.<br />
35<br />
Health Care Fund<br />
2010 Expected Asset Growth<br />
Estimated Market Values, Returns and Cash Flows<br />
Pessimistic<br />
Case<br />
Base<br />
Case<br />
Optimistic<br />
Case<br />
12/31/09 Market Value ($ billions) $11.7 $11.7 $11.7<br />
Expected Total Return -6.4% 6.5% 21.8%<br />
Expected <strong>Investment</strong> Gain ($ billions) ($0.7) $0.8 $2.5<br />
Expected Cash Flow ($ billions) ($0.5) ($0.5) ($0.5)<br />
12/31/10 Market Value ($ billions) $10.4 $11.9 $13.7
2 0 1 0 I N V E S T M E N T P L A N<br />
FUND STRATEGIES<br />
Asset Allocation<br />
The 2010 target asset allocation and ranges for the Health Care Fund reflect Staff’s estimate of the<br />
progress that will be made towards the new asset allocations adopted in 2009, and are shown below.<br />
8/31/2009<br />
12/31/10<br />
Asset Class<br />
Actual<br />
Target Range<br />
Public Equity 53.1% 49.1% 47% to 63%<br />
U.S. Equity 28.4% 26.0% 23.5% to 31.5%<br />
Non-U.S. Equity 24.7% 23.2% 23.5% to 31.5%<br />
Public Fixed Income 39.8% 42.7% 26% to 42%<br />
Core Fixed 6.2% 13.0% 17.5% to 25.5%<br />
TIPS 19.3% 19.7% 0% to 7.5%<br />
Short Bonds 9.9% 0.0% 0% to 10%<br />
High Yield 0.6% 1.9% 0% to 6%<br />
Emerging Mkt Debt 3.0% 3.6% 1% to 9%<br />
Liquidity 0.7% 0.5% 0% to 4%<br />
Alternatives 7.1% 8.2% 2% to 14%<br />
REIT 6.1% 6.0% 2% to 10%<br />
Opportunistic/Hedge Funds 0.9% 1.9% 0% to 8%<br />
Commodities 0.0% 0.3% 0% to 2%<br />
Total Health Care Fund 100.0% 100.0%<br />
There is no peer universe for health care funds run by comparable large public pension plans. The<br />
internally managed opportunistic distressed fixed income assets are included in the Opportunistic/Hedge<br />
Funds asset class. The asset mix shown above moves the Health Care Fund toward the asset allocation<br />
targets that were developed based on an asset-liability study completed in 2009.<br />
Throughout 2010 and beyond, Staff will work with <strong>OPERS</strong>’ Advisors to recommend certain enhancements<br />
to the asset mix and asset management strategies targeted at raising the expected return within acceptable<br />
risk levels. While not all of these strategies have been clearly defined, several are described in the Asset<br />
Class Strategies section later in this plan.<br />
36
2 0 1 0 I N V E S T M E N T P L A N<br />
FUND STRATEGIES<br />
Estimated assets in dollar amounts are listed below and are based on December 31, 2010 target<br />
allocations.<br />
Actual<br />
Assets<br />
($ billions)<br />
Estimated assets represent Staff’s general expectation for progress towards transitioning assets to the<br />
Board’s recently approved long-term asset allocation targets. Actual assets at future points in time will be<br />
within the Board approved ranges but will also reflect market outcomes, opportunities for Staff to transition<br />
assets in an efficient and cost effective manner and the availability of attractive investment opportunities.<br />
It is estimated that the Board’s long-term asset allocation targets will substantially be achieved within the<br />
next three years.<br />
37<br />
Estimated<br />
Assets<br />
($ billions)<br />
Target<br />
Allocation<br />
8/31/2009 12/31/2009 2010 Average 12/31/2010 12/31/2010<br />
Public Equity $5.9 $6.2 $6.0 $5.9 49.1%<br />
U.S. Equity $3.2 $3.3 $3.2 $3.1 26.0%<br />
Non-U.S. Equity $2.7 $2.9 $2.8 $2.8 23.2%<br />
Public Fixed Income $4.4 $4.7 $4.9 $5.1 42.7%<br />
Core Fixed $0.7 $1.2 $1.4 $1.6 13.0%<br />
TIPS $2.1 $2.3 $2.3 $2.4 19.7%<br />
Short Bonds $1.1 $0.7 $0.6 $0.5 4.0%<br />
High Yield $0.1 $0.1 $0.1 $0.2 1.9%<br />
Emerging Mkt Debt $0.3 $0.3 $0.4 $0.4 3.6%<br />
Liquidity $0.1 $0.1 $0.1 $0.1 0.5%<br />
Alternatives $0.8 $0.8 $0.9 $1.0 8.2%<br />
REIT $0.7 $0.7 $0.7 $0.7 6.0%<br />
Opportunistic/Hedge Funds $0.1 $0.1 $0.2 $0.2 1.9%<br />
Commodities $0.0 $0.0 $0.0 $0.0 0.3%<br />
Total Health Care Fund $11.1 $11.7 $11.8 $11.9 100.0%
2 0 1 0 I N V E S T M E N T P L A N<br />
FUND STRATEGIES<br />
Composition of <strong>Investment</strong> Portfolio<br />
The Public Equity and Public Fixed Income asset classes are managed identically for both the Health Care<br />
and Defined Benefit Funds; however, the allocations to all asset classes vary as they reflect unique<br />
circumstances for each fund. The table below shows the Health Care Fund’s projected June 30, 2010<br />
allocation between internal and external asset management by asset class.<br />
Internal Management<br />
External Management<br />
Asset Class<br />
<strong>OPERS</strong><br />
<strong>OPERS</strong><br />
Public Equity<br />
U.S. Equity 83.2% 16.8%<br />
Non-U.S. Equity<br />
Public Fixed Income<br />
0.0% 100.0%<br />
Core Fixed 11.7% 88.3%<br />
TIPS 100.0% 0.0%<br />
Short Bonds 100.0% 0.0%<br />
High Yield 0.0% 100.0%<br />
Emerging Mkt Debt 0.0% 100.0%<br />
Liquidity<br />
Alternatives<br />
100.0% 0.0%<br />
REIT 100.0% 0.0%<br />
Opportunistic/Hedge Funds 48.2% 51.8%<br />
Commodities 100.0% 0.0%<br />
Weighted Averages 50.5% 49.5%<br />
There is no peer universe for health care funds run by comparable large public pension plans. The amount<br />
shown as <strong>OPERS</strong> internally managed Opportunistic/Hedge Funds represents the opportunistic distressed<br />
fixed income assets.<br />
The Health Care Fund utilizes a higher proportion of more liquid securities with no Private Real Estate or<br />
Private Equity holdings due to the shorter duration of this fund relative to the Defined Benefit Fund.<br />
38
2 0 1 0 I N V E S T M E N T P L A N<br />
FUND STRATEGIES<br />
The table below shows the Health Care Fund’s projected June 30, 2010 allocation between active and<br />
passive asset management by asset class. The share of active management for <strong>OPERS</strong> will necessarily<br />
rise to reflect the new larger allocations to alternatives and liquid market strategies that cannot be<br />
effectively indexed, such as high yield and emerging market debt.<br />
Active Management<br />
Passive Management<br />
Asset Class<br />
<strong>OPERS</strong><br />
<strong>OPERS</strong><br />
Public Equity<br />
U.S. Equity 31.9% 68.1%<br />
Non-U.S. Equity<br />
Public Fixed Income<br />
82.5% 17.5%<br />
Core Fixed 100.0% 0.0%<br />
TIPS 100.0% 0.0%<br />
Short Bonds 100.0% 0.0%<br />
High Yield 100.0% 0.0%<br />
Emerging Mkt Debt 100.0% 0.0%<br />
Liquidity<br />
Alternatives<br />
100.0% 0.0%<br />
REIT 100.0% 0.0%<br />
Opportunistic/Hedge Funds 100.0% 0.0%<br />
Commodities 0.0% 100.0%<br />
Weighted Averages 74.0% 26.0%<br />
There is no peer universe for health care funds run by comparable large public pension plans. Passive<br />
management is utilized in the more-efficient U.S. Equity asset class and to a lesser extent in the Non-U.S.<br />
Equity asset class. The remainder of the fund is substantially actively managed.<br />
A much higher proportion of the Health Care Fund (78%) is actively managed than for the Defined Benefit<br />
Fund (71.2%). This primarily reflects a lower allocation to U.S. Equity in the Health Care Fund since this<br />
asset class is predominantly managed passively. The Health Care Fund has other asset allocation<br />
differences including that a higher proportion is allocated to publicly-traded asset classes and the Real<br />
Estate allocation within alternatives is accessed through actively managed public securities due to their<br />
greater liquidity.<br />
39
2 0 1 0 I N V E S T M E N T P L A N<br />
FUND STRATEGIES<br />
Return and Risk<br />
The Health Care Fund’s performance objective is to earn a long-term rate of return that exceeds the return<br />
of the Health Care Fund policy benchmark within an appropriately constrained risk framework. The table<br />
shows expected returns for 2010 along with its ranges. These are the ‘beta’ returns expected from each<br />
asset class, without regard to over- or under-performance relative to the benchmarks.<br />
2010 Policy Return Assumptions<br />
Asset Classes Pessimistic Base Optimistic<br />
Public Equity -10.0% 8.4% 28.5%<br />
U.S. Equity -10.1% 8.4% 28.5%<br />
Non-U.S. Equity -9.9% 8.4% 28.5%<br />
Public Fixed Income -1.5% 3.2% 11.4%<br />
Core Fixed -1.1% 3.2% 10.6%<br />
TIPS -0.1% 2.5% 10.2%<br />
Short Bonds -1.0% 2.8% 7.4%<br />
High Yield -11.0% 7.2% 28.2%<br />
Emerging Mkt Debt -8.7% 6.5% 22.7%<br />
Liquidity 0.3% 1.0% 2.3%<br />
Alternatives -4.6% 7.0% 18.7%<br />
REIT -4.4% 7.0% 18.6%<br />
Opportunistic/Hedge Funds -4.4% 7.0% 18.6%<br />
Commodities -13.2% 4.6% 24.3%<br />
Total Return -6.4% 6.5% 21.8%<br />
40
2 0 1 0 I N V E S T M E N T P L A N<br />
FUND STRATEGIES<br />
Active Return and Risk<br />
The table below details the expected excess performance, or active return, and the tracking error (volatility<br />
of active returns) for each asset class, as well as the overall fund. Tracking error is a standard measure of<br />
risk used in public market asset classes; we have extended it to alternatives as well. Where markets are<br />
more efficient, such as U.S. equity and public fixed income, the outperformance goals are modest.<br />
Average<br />
Policy<br />
Allocation<br />
in Percent<br />
Public Equity 51.0%<br />
Schedule of Expected Performance and Volatility<br />
The table shows an anticipated active management contribution of 39 basis points to the fund’s return. The<br />
45 basis points of estimated tracking error indicates a 68% probability that the active return will be in a<br />
range of -6 basis points to +84 basis points. This confidence interval is arrived at by subtracting the<br />
tracking error from, and adding the tracking error to, the expected active return. The target contribution to<br />
fund performance of 39 basis points for 2010 is slightly higher than the 34 basis points projected for 2009<br />
primarily due to a higher performance objective for the Non-U.S. Equity asset class.<br />
The figures shown in the table above are aggregated from the component portfolios in each of the asset<br />
classes. The tracking error that results at the fund level is lower than would be suggested by a simple<br />
weighted average due to the diversifying effects of the active return interaction among the managers and<br />
the asset classes.<br />
41<br />
Active Return<br />
Performance<br />
Objectives<br />
(bps)<br />
Active Return<br />
Performance<br />
Contribution<br />
(bps)<br />
Target<br />
Tracking<br />
Error<br />
(bps)<br />
Target<br />
Information<br />
Ratio<br />
U.S. Equity 27.2% 20 5.4 32 0.63<br />
Non-U.S. Equity 23.8% 75 17.9 115 0.65<br />
Public Fixed Income 41.3%<br />
Core Fixed 11.5% 23 2.6 75 0.31<br />
TIPS 19.8% 15 3.0 50 0.30<br />
Short Bonds 4.8% 25 1.2 75 0.33<br />
High Yield 1.2% 82 1.0 325 0.25<br />
Emerging Mkt Debt 3.2% 156 5.1 385 0.41<br />
Liquidity 0.6% 0 0.0 30 0.00<br />
Alternatives 7.6%<br />
REIT 6.0% 50 3.0 200 0.25<br />
Opportunistic/Hedge Funds 1.4% 0 0.0 300 0.00<br />
Commodities 0.1% 0 0.0 300 0.00<br />
Total Health Care Fund 100.0% NA 39.3 45 0.87
2 0 1 0 I N V E S T M E N T P L A N<br />
FUND STRATEGIES<br />
The return estimates below were derived from the asset class return expectations developed by internal<br />
Staff. The single-point estimate return of 6.52% is comprised of an expected return of 6.12% from the<br />
policy mix and an additional contribution of 0.39% from active management.<br />
2010 Total Return Assumptions<br />
Sources of Return Pessimistic Base Optimistic<br />
Policy -6.04% 6.12% 20.68%<br />
Tactical -0.30% 0.00% 0.30%<br />
Active -0.06% 0.39% 0.84%<br />
Total Return -6.39% 6.52% 21.83%<br />
Sources of Risk<br />
2010 Total Risk and Risk for Return Assumptions<br />
Due to rounding, the total return may not appear to sum correctly from the sources of return. Variability risk<br />
is measured by standard deviation for policy and total risk and by tracking error for active risk.<br />
The information ratio compares the active return of an asset to its most relevant benchmark index and is a<br />
measure of risk-adjusted return. The Sharpe Ratio compares the excess return of an asset against the<br />
return of the risk free asset.<br />
As stated in the Report from the CIO, fund investments are measured and monitored within a specific<br />
framework, which identifies return and risk from three sources:<br />
Policy: The return and risk inherent in the policy asset mix (allocation) adopted by the Board. The mix<br />
has expected return and variability characteristics that arise directly from the underlying asset classes.<br />
The expected return of the <strong>OPERS</strong> Health Care Fund policy mix is 6.12% for 2010 with an estimated<br />
risk, or variability, of 8.70%. As such, approximately two-thirds of the time, actual annual policy returns<br />
are expected to be within a range of –2.58% to +14.82%.<br />
Tactical: The return and risk introduced by deviations from the policy asset mix. The table above does<br />
not show any excess expected return from tactical asset allocation activities.<br />
Active: The return and risk introduced by active management (security selection).<br />
In summary, the total expected return of the Health Care Fund in 2010 is 6.52%, which is the sum of the<br />
expected policy return of 6.12% and active return of 0.39%. The estimated risk anticipated to achieve this<br />
return is the combination of the policy, tactical and active risk, which is 8.70%.<br />
42<br />
Variability<br />
Risk<br />
Information<br />
Ratio<br />
Sharpe<br />
Ratio<br />
Policy 8.50% 0.60<br />
Tactical 0.30%<br />
Active 0.45% 0.87<br />
Total Risk 8.70% 0.63
2 0 1 0 I N V E S T M E N T P L A N<br />
FUND STRATEGIES<br />
Defined Contribution Fund<br />
Expected Asset Growth<br />
Since its inception on January 2, 2003 through August 31, 2009, the Defined Contribution Fund’s assets<br />
have grown to over $300 million. Asset growth has averaged approximately $50 million every 12 months.<br />
Future growth of the Defined Contribution Fund assets is expected to be equal to, or slightly above,<br />
historical averages due to the addition of nearly 2,000 new participants each year.<br />
The <strong>OPERS</strong> Target Date Funds were introduced on October 1, 2008. In June 2010, Staff will be adding the<br />
Bond Index Fund, the Non-U.S. Stock Index Fund and the <strong>OPERS</strong> Target 2055 Fund. In December 2010,<br />
the <strong>OPERS</strong> Target 2010 Fund will be transitioning into the <strong>OPERS</strong> Target Payout Fund as part of the<br />
normal phasing of Target Date Funds.<br />
The following table shows the distribution of assets across the various <strong>OPERS</strong> investment options within<br />
the Defined Contribution Fund as of August 31, 2009.<br />
Defined Contribution Fund Assets<br />
<strong>OPERS</strong> <strong>Investment</strong> Options<br />
Core Funds<br />
Assets Under<br />
Management<br />
($ millions)<br />
8/31/09<br />
<strong>OPERS</strong> Stable Value Fund $28.0<br />
<strong>OPERS</strong> Bond Index Fund 0.0<br />
<strong>OPERS</strong> Bond Fund 15.0<br />
<strong>OPERS</strong> Stock Index Fund 25.4<br />
<strong>OPERS</strong> Large Cap Fund 18.5<br />
<strong>OPERS</strong> Small Cap Fund 15.7<br />
<strong>OPERS</strong> Non-U.S. Stock Index Fund 0.0<br />
<strong>OPERS</strong> Non-U.S. Stock Fund<br />
Target Date Funds<br />
21.1<br />
<strong>OPERS</strong> Target Payout Fund 0.6<br />
<strong>OPERS</strong> Target 2010 Fund 6.5<br />
<strong>OPERS</strong> Target 2015 Fund 11.5<br />
<strong>OPERS</strong> Target 2020 Fund 19.3<br />
<strong>OPERS</strong> Target 2025 Fund 24.7<br />
<strong>OPERS</strong> Target 2030 Fund 30.1<br />
<strong>OPERS</strong> Target 2035 Fund 32.8<br />
<strong>OPERS</strong> Target 2040 Fund 34.1<br />
<strong>OPERS</strong> Target 2045 Fund 21.0<br />
<strong>OPERS</strong> Target 2050 Fund 7.0<br />
<strong>OPERS</strong> Target 2055 Fund 0.0<br />
Total $311.2<br />
43
2 0 1 0 I N V E S T M E N T P L A N<br />
FUND STRATEGIES<br />
Asset Allocation<br />
The target asset allocation and ranges for the Target Date Funds shown in the tables below will be effective<br />
from June 25, 2010 to June 30, 2011. Target asset allocations for Target Date Funds migrate over time with<br />
the ratio of equities to fixed income becoming more conservative as the target date approaches the<br />
retirement date.<br />
The assets of the Target Date Funds were initially allocated across the six existing core funds. Two major<br />
changes for the Target Date Funds are in progress for the first or second quarter of 2010. The underlying<br />
funds will use passive options, where available, and include treasury inflation-protected securities (TIPS),<br />
long duration bonds and high yield bonds as new asset classes to improve risk-adjusted return expectations<br />
and enhance diversification.<br />
Underlying Funds<br />
Stable Value Bond Index TIPS Long Duration<br />
<strong>OPERS</strong> Target Date Funds Target Range Target Range Target Range Target Range<br />
<strong>OPERS</strong> Target Payout Fund 25% +/- 3.7% 32% +/- 4.0% 13% +/- 3.4% 0% +/- 0%<br />
<strong>OPERS</strong> Target 2015 Fund 5% +/- 2.1% 39% +/- 4.1% 10% +/- 3.5% 0% +/- 0%<br />
<strong>OPERS</strong> Target 2020 Fund 0% +/- 0% 32% +/- 2.7% 2% +/- 0% 0% +/- 0%<br />
<strong>OPERS</strong> Target 2025 Fund 0% +/- 0% 14% +/- 2.4% 0% +/- 0% 4% +/- 1.5%<br />
<strong>OPERS</strong> Target 2030 Fund 0% +/- 0% 5% +/- 2.4% 0% +/- 0% 4% +/- 1.4%<br />
<strong>OPERS</strong> Target 2035 Fund 0% +/- 0% 4% +/- 2.3% 0% +/- 0% 4% +/- 1.3%<br />
<strong>OPERS</strong> Target 2040 Fund 0% +/- 0% 3% +/- 2.2% 0% +/- 0% 3% +/- 1.3%<br />
<strong>OPERS</strong> Target 2045 Fund 0% +/- 0% 3% +/- 2.1% 0% +/- 0% 2% +/- 1.2%<br />
<strong>OPERS</strong> Target 2050 Fund 0% +/- 0% 3% +/- 2.1% 0% +/- 0% 2% +/- 1.2%<br />
<strong>OPERS</strong> Target 2055 Fund 0% +/- 0% 3% +/- 2.1% 0% +/- 0% 2% +/- 1.2%<br />
Underlying Funds<br />
High Yield Bonds Large Cap Index Small Cap Index Non-U.S. Stock Index<br />
<strong>OPERS</strong> Target Date Funds Target Range Target Range Target Range Target Range<br />
<strong>OPERS</strong> Target Payout Fund 0% +/- 0% 10% +/- 1.3% 5% +/- 1.7% 15% +/- 2.2%<br />
<strong>OPERS</strong> Target 2015 Fund 0% +/- 0% 13% +/- 1.4% 10% +/- 1.8% 23% +/- 2.4%<br />
<strong>OPERS</strong> Target 2020 Fund 4% +/- 2.6% 17% +/- 1.7% 14% +/- 2.1% 31% +/- 2.6%<br />
<strong>OPERS</strong> Target 2025 Fund 5% +/- 2.7% 21% +/- 1.9% 17% +/- 2.4% 39% +/- 2.8%<br />
<strong>OPERS</strong> Target 2030 Fund 8% +/- 2.9% 23% +/- 2.1% 19% +/- 2.6% 41% +/- 2.8%<br />
<strong>OPERS</strong> Target 2035 Fund 7% +/- 2.6% 23% +/- 2.1% 19% +/- 2.7% 43% +/- 2.9%<br />
<strong>OPERS</strong> Target 2040 Fund 7% +/- 2.4% 24% +/- 2.2% 20% +/- 2.7% 43% +/- 3.0%<br />
<strong>OPERS</strong> Target 2045 Fund 5% +/- 2.0% 25% +/- 2.3% 20% +/- 2.8% 45% +/- 3.1%<br />
<strong>OPERS</strong> Target 2050 Fund 5% +/- 2.0% 25% +/- 2.3% 20% +/- 2.8% 45% +/- 3.1%<br />
<strong>OPERS</strong> Target 2055 Fund 5% +/- 2.0% 25% +/- 2.3% 20% +/- 2.8% 45% +/- 3.1%<br />
44
2 0 1 0 I N V E S T M E N T P L A N<br />
FUND STRATEGIES<br />
Composition of <strong>Investment</strong> Portfolios<br />
The Defined Contribution Fund is composed of investments that are directed by the members of the<br />
Member-Directed and Combined <strong>Plan</strong>s. As of September 30, 2009, participation in the Member-Directed<br />
<strong>Plan</strong> approximated 9,700 members, while participation in the Combined <strong>Plan</strong> approximated 7,300<br />
members. Over the last 12 months, most new members (81%) have defaulted to the Traditional Pension<br />
<strong>Plan</strong>. Of the new members who have actively selected a retirement plan, 78% have selected the Traditional<br />
Pension <strong>Plan</strong>, 15% the Member-Directed <strong>Plan</strong> and 7% the Combined <strong>Plan</strong>.<br />
Periodically, Staff compares the <strong>OPERS</strong> Defined Contribution Fund to market peers to stay abreast of best<br />
practices and monitor industry trends. Current findings on marketplace trends include:<br />
Periodically, Staff compares the <strong>OPERS</strong> Defined Contribution Fund to market peers to stay abreast of best<br />
practices and monitor industry trends. Current findings on marketplace trends include:<br />
Many plan sponsors continue to offer a large number of investment options (15 or more funds).<br />
However, some plan sponsors are reducing the number of investment options to simplify the account<br />
management process for participants.<br />
Many plan sponsors offer a multi-tiered investment structure of balanced funds (lifestyle and/or target<br />
date) and individual funds. The Target Date Funds provide a diversified investment option for<br />
participants that is simple to use. Most sponsors still allow their participants to build their own portfolio<br />
using the individual funds that the plan offers.<br />
In 2002, Staff and external advisors recommended a Defined Contribution Fund investment structure that<br />
includes a multi-tiered investment option line-up with asset allocation funds and core fund investment<br />
options. As of October 1, 2008, Target Date Funds replaced the Pre-Mix Portfolios to offer an improved<br />
solution to those who would rather not pick their own mix of individual <strong>OPERS</strong> Funds or actively manage<br />
their allocation over time.<br />
45
2 0 1 0 I N V E S T M E N T P L A N<br />
FUND STRATEGIES<br />
The present investment structure is designed to satisfy the investment objective of the Defined Contribution<br />
Fund, which is to offer an array of funds that provide participants the ability to construct a portfolio that:<br />
Is diversified by asset class and investment style,<br />
Spans the risk-return spectrum,<br />
Outperforms appropriate benchmarks over time where active management is used, and<br />
Avoids un-rewarded risk<br />
The table below details the respective benchmark indices and peers for each of the <strong>OPERS</strong> <strong>Investment</strong><br />
Options.<br />
<strong>OPERS</strong> <strong>Investment</strong> Options Benchmark Index Benchmark Peers<br />
<strong>OPERS</strong> Stable Value Fund Custom Stable Value (1) Stable Value Universe<br />
<strong>OPERS</strong> Bond Index Fund Barclays Aggregate Mercer Mutual Fund U.S. Fixed Index Universe<br />
<strong>OPERS</strong> Bond Fund Barclays U.S. Universal Mercer Mutual Fund U.S. Fixed Core Universe<br />
<strong>OPERS</strong> Stock Index Fund Russell 3000 Mercer Mutual Fund U.S. Equity Large Cap Index Universe<br />
<strong>OPERS</strong> Large Cap Fund Russell 1000 Mercer Mutual Fund U.S. Equity Large Cap Universe<br />
<strong>OPERS</strong> Small Cap Fund Russell 2000 Mercer Mutual Fund U.S. Equity Small Cap Universe<br />
<strong>OPERS</strong> Non-U.S. Stock Index Fund MSCI ACWI x U.S. Mercer Mutual Fund International Equity Index Universe<br />
<strong>OPERS</strong> Non-U.S. Stock Fund MSCI ACWI x U.S. Mercer Mutual Fund International Equity Universe<br />
<strong>OPERS</strong> Target Payout Fund Custom Payout (2) Mercer Mutual Fund Lifecycle Income Universe<br />
<strong>OPERS</strong> Target 2010 Fund Custom 2010 (2) Mercer Mutual Fund Lifecycle 2010 Universe<br />
<strong>OPERS</strong> Target 2015 Fund Custom 2015 (2) Mercer Mutual Fund Lifecycle 2015 Universe<br />
<strong>OPERS</strong> Target 2020 Fund Custom 2020 (2) Mercer Mutual Fund Lifecycle 2020 Universe<br />
<strong>OPERS</strong> Target 2025 Fund Custom 2025 (2) Mercer Mutual Fund Lifecycle 2025 Universe<br />
<strong>OPERS</strong> Target 2030 Fund Custom 2030 (2) Mercer Mutual Fund Lifecycle 2030 Universe<br />
<strong>OPERS</strong> Target 2035 Fund Custom 2035 (2) Mercer Mutual Fund Lifecycle 2035 Universe<br />
<strong>OPERS</strong> Target 2040 Fund Custom 2040 (2) Mercer Mutual Fund Lifecycle 2040 Universe<br />
<strong>OPERS</strong> Target 2045 Fund Custom 2045 (2) Mercer Mutual Fund Lifecycle 2045 Universe<br />
<strong>OPERS</strong> Target 2050 Fund Custom 2050 (2) Mercer Mutual Fund Lifecycle 2050+ Universe<br />
<strong>OPERS</strong> Target 2055 Fund Custom 2055 (2) Mercer Mutual Fund Lifecycle 2050+ Universe<br />
1) The Custom Stable Value Index is composed of the following weights: 5% Merrill Lynch 3-Month Treasury Bills, 45% Barclays’<br />
1-5 Year Government/Corporate Bond, 35% Barclays’ Intermediate Government/Corporate and 15% Barclays’ Aggregate,<br />
smoothed over three year periods.<br />
2) The Target Date Custom Indexes are composed of benchmarks of the underlying <strong>OPERS</strong> Funds using the same target<br />
allocations as the respective <strong>OPERS</strong> Target Date Fund target allocation.<br />
46
2 0 1 0 I N V E S T M E N T P L A N<br />
FUND STRATEGIES<br />
Expected Fees<br />
The table below shows the expected asset management fees for each of the <strong>OPERS</strong> <strong>Investment</strong> Options in<br />
the Defined Contribution Fund. The estimates of fees are based on a projection of average assets and<br />
expected basis points of fees for 2010 including shifting to passive underlying funds, where appropriate, in<br />
the <strong>OPERS</strong> Target Date Funds. While fees are extremely low relative to the industry, Staff will continue to<br />
monitor the costs of the Defined Contribution Fund.<br />
Estimate of External Management Fees in Dollars and Basis Points<br />
Total for 2010<br />
Estimated Annual Estimated Annual<br />
Average Assets<br />
Fees<br />
Fees<br />
<strong>OPERS</strong> <strong>Investment</strong> Options<br />
($ millions) ($ millions)<br />
(bps)<br />
<strong>OPERS</strong> Stable Value Fund $21.6 $0.05 23<br />
<strong>OPERS</strong> Bond Index Fund 16.2 0.01 4<br />
<strong>OPERS</strong> Bond Fund 8.6 0.02 20<br />
<strong>OPERS</strong> Stock Index Fund 27.4 0.01 3<br />
<strong>OPERS</strong> Large Cap Fund 19.9 0.01 5<br />
<strong>OPERS</strong> Small Cap Fund 16.9 0.01 8<br />
<strong>OPERS</strong> Non-U.S. Stock Index Fund 10.8 0.01 10<br />
<strong>OPERS</strong> Non-U.S. Stock Fund 11.9 0.03 29<br />
<strong>OPERS</strong> Target Payout Fund 1.2 0.00 10<br />
<strong>OPERS</strong> Target 2010 Fund 5.4 0.00 9<br />
<strong>OPERS</strong> Target 2015 Fund 12.4 0.01 6<br />
<strong>OPERS</strong> Target 2020 Fund 20.9 0.02 8<br />
<strong>OPERS</strong> Target 2025 Fund 26.7 0.02 8<br />
<strong>OPERS</strong> Target 2030 Fund 32.6 0.03 9<br />
<strong>OPERS</strong> Target 2035 Fund 35.5 0.03 9<br />
<strong>OPERS</strong> Target 2040 Fund 36.8 0.03 9<br />
<strong>OPERS</strong> Target 2045 Fund 22.7 0.02 9<br />
<strong>OPERS</strong> Target 2050 Fund 7.6 0.01 9<br />
<strong>OPERS</strong> Target 2055 Fund 1.1 0.00 9<br />
Total $336.2 $0.33 10<br />
47
2 0 1 0 I N V E S T M E N T P L A N<br />
FUND STRATEGIES<br />
Since its inception, the <strong>OPERS</strong> Defined Contribution Fund has successfully maintained a low investment<br />
cost structure. As of June 30, 2009 the investment cost of the Defined Contribution Fund was<br />
approximately 18 basis points, while the universe weighted average investment cost stood at 83 basis<br />
points. Both of these figures include only investment expense ratios.<br />
<strong>OPERS</strong> Expense Average Net<br />
Asset Class 6/30/09 Allocation Ratios Expense Ratio*<br />
U.S. Large Cap Equity Index 8.00% 0.03% 0.29%<br />
U.S. Large Cap Equity 5.80% 0.05% 0.91%<br />
U.S. Small Cap Equity 4.90% 0.08% 1.08%<br />
International Equity 6.60% 0.32% 1.07%<br />
U.S. Fixed 5.00% 0.20% 0.64%<br />
Stable Value 10.00% 0.23% 0.35%<br />
Lifecycle 59.70% 0.19% 0.95%<br />
Total 100.00%<br />
*Average Institutional share class net expense ratio as defined by the respective Mercer Mutual Fund Universe, which<br />
unlike the <strong>OPERS</strong> Funds, may include 12b-1 fees and other expenses. 12b-1 fees and other expenses are charged by<br />
mutual funds to pay for marketing, distribution, education, legal, custodial, transfer agent and other administrative costs<br />
and typically range from 0.15% to 0.35% of average annual assets.<br />
48
2 0 1 0 I N V E S T M E N T P L A N<br />
FUND STRATEGIES<br />
Return and Risk<br />
Mercer <strong>Investment</strong> Consulting provided the asset class return expectations listed below, which are based<br />
on their capital markets modeling assumptions. Those assumptions are based on forward looking total<br />
returns, fundamental data and valuation levels. The investment Staff does not attempt to incur tactical risk<br />
and rebalances the <strong>OPERS</strong> <strong>Investment</strong> Options quarterly if their allocations are outside their policy range.<br />
The returns listed below are neither predictions of, nor guarantees for, future performance.<br />
Asset Class and Target Date Fund Expected Return and Risk<br />
Asset Classes Return Risk*<br />
<strong>OPERS</strong> Stable Value Fund 4.3% 3.0%<br />
<strong>OPERS</strong> Bond Index Fund 4.8% 5.5%<br />
<strong>OPERS</strong> Bond Fund 4.8% 5.5%<br />
<strong>OPERS</strong> Stock Index Fund 8.3% 18.6%<br />
<strong>OPERS</strong> Large Cap Fund 8.2% 17.9%<br />
<strong>OPERS</strong> Small Cap Fund 8.4% 21.7%<br />
<strong>OPERS</strong> Non-U.S. Stock Index Fund 8.2% 18.6%<br />
<strong>OPERS</strong> Non-U.S. Stock Fund<br />
Target Date Funds<br />
8.2% 18.6%<br />
<strong>OPERS</strong> Target Payout Fund 6.1% NA<br />
<strong>OPERS</strong> Target 2010 Fund 6.4% NA<br />
<strong>OPERS</strong> Target 2015 Fund 7.4% NA<br />
<strong>OPERS</strong> Target 2020 Fund 7.8% NA<br />
<strong>OPERS</strong> Target 2025 Fund 8.0% NA<br />
<strong>OPERS</strong> Target 2030 Fund 8.1% NA<br />
<strong>OPERS</strong> Target 2035 Fund 8.2% NA<br />
<strong>OPERS</strong> Target 2040 Fund 8.2% NA<br />
<strong>OPERS</strong> Target 2045 Fund 8.3% NA<br />
<strong>OPERS</strong> Target 2050 Fund 8.4% NA<br />
<strong>OPERS</strong> Target 2055 Fund 8.4% NA<br />
*Risk is defined in this table as the forward looking annualized standard deviation.<br />
49
2 0 1 0 I N V E S T M E N T P L A N<br />
FUND STRATEGIES<br />
Active Return and Risk<br />
Active returns are estimated by applying the performance objectives of the underlying funds to the target<br />
asset allocation of each Target Date Fund as listed previously in the Defined Contribution Fund’s Asset<br />
Allocation section. The performance objectives and tracking errors listed below are neither predictions of,<br />
nor guarantees for, future performance. The performance objectives of the <strong>OPERS</strong> <strong>Investment</strong> Options are<br />
defined by the member-directed fund policy, which provides a framework for the investment Staff to manage<br />
the funds. Staff is currently updating the Defined Contribution Fund and Member-Directed Fund policies for<br />
2010, which may result in changes to performance objectives and tracking error.<br />
Expected Active Return and Risk<br />
Target Date Funds<br />
Performance<br />
Objective Tracking Error<br />
(bps)<br />
(bps) Information Ratio<br />
<strong>OPERS</strong> Target Payout Fund 3 25 0.10<br />
<strong>OPERS</strong> Target 2010 Fund 2 28 0.07<br />
<strong>OPERS</strong> Target 2015 Fund 0 40 0.00<br />
<strong>OPERS</strong> Target 2020 Fund 5 55 0.09<br />
<strong>OPERS</strong> Target 2025 Fund 5 65 0.08<br />
<strong>OPERS</strong> Target 2030 Fund 9 75 0.12<br />
<strong>OPERS</strong> Target 2035 Fund 7 73 0.10<br />
<strong>OPERS</strong> Target 2040 Fund 7 75 0.09<br />
<strong>OPERS</strong> Target 2045 Fund 5 73 0.07<br />
<strong>OPERS</strong> Target 2050 Fund 5 73 0.07<br />
<strong>OPERS</strong> Target 2055 Fund 5 73 0.07<br />
Schedule of Expected Performance and Volatility<br />
Average Assets<br />
Under<br />
Management<br />
($ millions) Benchmark<br />
50<br />
Performance<br />
Objectives<br />
(bps)<br />
Target<br />
Tracking<br />
Error<br />
(bps)<br />
Target<br />
Information<br />
Ratio<br />
<strong>OPERS</strong> Stable Value Fund $25.5 Custom SV* 10 NA NA<br />
<strong>OPERS</strong> Bond Index Fund $46.3 Barclays Aggregate 0 25 0.00<br />
<strong>OPERS</strong> Bond Fund $67.8 Barclays U.S. Universal 30 70 0.43<br />
<strong>OPERS</strong> Stock Index Fund $56.8 Russell 3000 0 15 0.00<br />
<strong>OPERS</strong> Large Cap Fund $46.3 Russell 1000 0 25 0.00<br />
<strong>OPERS</strong> Small Cap Fund $17.3 Russell 2000 0 75 0.00<br />
<strong>OPERS</strong> Non-U.S. Stock Index Fund $46.3 MSCI ACWI x U.S. 0 75 0.00<br />
<strong>OPERS</strong> Non-U.S. Stock Fund $87.2 MSCI ACWI x U.S. 50 250 0.20<br />
*Custom SV benchmark is previously defined in the Defined Contribution Composition of <strong>Investment</strong> Portfolio section.
2 0 1 0 I N V E S T M E N T P L A N<br />
Asset Class<br />
Strategies
2 0 1 0 I N V E S T M E N T P L A N<br />
ASSET CLASS STRATEGIES<br />
Tactical Outlook<br />
This tactical outlook provides the background and context for the asset class strategies and for<br />
consideration of biases between the asset classes for both the Defined Benefit and Health Care Funds.<br />
Following are overviews of the two components of the tactical outlook: the economic outlook and the<br />
investment outlook. The economic outlook was provided by the Board’s general investment advisor, Mercer<br />
<strong>Investment</strong> Consulting, in November of 2009. The investment outlook, provided by <strong>OPERS</strong>’ <strong>Investment</strong><br />
Staff, is summarized by asset class.<br />
Economic Outlook<br />
Global economic growth is expected to be weak in the developed world, but gradually improving well<br />
into 2010. This recession was the worst downturn since the Great Depression. However, at this point,<br />
it appears to be ending. The emerging markets should have higher growth than the developed markets<br />
as is normally the case.<br />
We expect a recovery of growth to 2.2% in the U.S. in 2010. Our long run assumption for economic<br />
growth in the U.S. is 3.1%.<br />
Inflation should remain below average until mid-2010, when inflationary pressures are most likely to<br />
emerge. We expect inflation to be 2.0% in the U.S. in 2010. However, our long run projections have<br />
inflation rising above 3.0% in 2011 before gradually settling down into a range of 2.5% to 3.0%. Our<br />
long run average for inflation is 2.7% to 2.8%.<br />
Although the Fed promises to be vigilant about inflation, we believe it will delay tightening monetary<br />
policy, resulting in an uptick in inflation in 2011.<br />
The U.S. unemployment rate should rise to about 10% at the beginning of 2010 and then gradually fall<br />
throughout the year. We expect the unemployment rate to fall to 9.2% by the end of 2010. Employment<br />
is always a lagging indicator for the economy. It is expected to lag more than usual in this recovery.<br />
The U.S. dollar is competitively priced and should be a positive factor for growth, as it encourages<br />
agriculture and manufacturing exports. Due to lax monetary policy and large budget deficits, we expect<br />
the dollar to be pressured further downward in 2010.<br />
Mercer expects Treasury rates to remain muted in the next few months, but the middle of next year is<br />
probably a key inflection point for the economy. Corporate spreads have tightened to the point that they<br />
are consistent with below average growth.<br />
51
2 0 1 0 I N V E S T M E N T P L A N<br />
ASSET CLASS STRATEGIES<br />
<strong>Investment</strong> Outlook<br />
Information gathered from a variety of sources was used to determine the investment outlook for 2010.<br />
Information considered includes Mercer’s outlook, research from investment banks, discussions with and<br />
research by, external investment managers, feedback from asset class advisors, discussions with peers<br />
and industry experts and academic and informational periodicals.<br />
U.S. Equity Outlook<br />
The U.S. equity market has recovered about halfway from its nadir, reached on March 9, 2009. The<br />
initial primary driver for the stock market recovery was a restoration of some confidence via inflows to<br />
the International Monetary Fund, thereby securing eastern Europe and its potential impact on many<br />
large European banks, and the U.S. Government’s implicit statement that none of the original grouping<br />
of stress-tested banks would be allowed to fail. These two actions coming within a short period of each<br />
other restored enough confidence to stem the onslaught of selling that was only picking up steam as<br />
each day brought further uncertainty.<br />
Since those difficult days in early March, the Standard & Poor’s 500 Index (S&P 500) of large U.S.<br />
companies has mounted an impressive 60% return at the time of this writing. Second quarter 2009<br />
earnings showed the significant extent of cost-reduction and restructuring achieved across corporate<br />
America. Companies were not only surviving, but they were also remaining competitive. With easy<br />
gross domestic product (GDP) comparisons for the next several calendar quarters, interest rates<br />
pegged at low levels due to the need for significant deleveraging, and the expected fruits of operating<br />
leverage benefits from revenue growth at recession’s end, the S&P 500 should continue to grind higher<br />
for a period of time. The markets have also benefitted from reduced net short-selling and even the<br />
return of capital that had fled the markets since their peak in October 2007.<br />
As with all post World War II cycles, achieving higher levels of GDP normally had the effect of taking up<br />
slack in the labor markets, leading to higher wages, more national employment and hence more<br />
confidence to take on more debt. This cycle is expected to be different. Debt growth is highly unlikely<br />
as deleveraging, once begun, normally takes years to accomplish. The expected drag on growth from<br />
debt repayments is likely to keep companies cautious in their hiring and inventory-building. As a result,<br />
it will be difficult for this cycle to take on the self-reinforcing characteristics of prior cycles. Our return<br />
expectations for 2010 and beyond are highly correlated to our view of GDP growth. We are looking for<br />
the S&P 500 to have a nice run up to the 1250-ish range in the first half of the year. If GDP growth<br />
continues, and even expands, we look for modest gains from there, perhaps into the 1350s range. On<br />
the other hand, if GDP growth stalls in first half of next year, we would look for a retracement back to the<br />
1100-1000 levels (where we were in October 2009).<br />
52
2 0 1 0 I N V E S T M E N T P L A N<br />
ASSET CLASS STRATEGIES<br />
Non-U.S. Equity Outlook<br />
The global financial system is awash with excess savings and private sector credit demand is still weak.<br />
As a result, governments around the world have increased their borrowing and spending efforts to<br />
prevent price levels from falling and stimulate demand. This has produced a synchronized global<br />
recovery, which should help global equities to advance. However, business profitability is expected to<br />
be constrained due to the deleveraging of the U.S. consumer and a steadily rising savings rate.<br />
Emerging markets remain fundamentally attractive with long-term of growth rates in excess of those<br />
available in developed markets.<br />
U.S. dollar weakness, triggered by the prospect of sustained low interest rates and by increased U.S.<br />
Government debt issuance, is a concern longer-term.<br />
Global Bonds Outlook<br />
The majority of fiscal stimulus in response to the financial crisis is expected to be delivered in 2010,<br />
providing support for economic growth in the near term. Uncertainty surrounding the sustainability of<br />
economic growth without government stimulus will continue to weigh on the markets during the first half<br />
of 2010.<br />
With a benign inflationary environment for 2010, the Federal Reserve will likely maintain a low level of<br />
interest rates. However, it is possible to foresee initial monetary tightening in the second half of 2010,<br />
given an economic recovery.<br />
Demand for investment grade credit bonds will remain high throughout 2010, with reduced supply, the<br />
lack of a viable credit default swap market, declining default rates, and improving corporate profitability<br />
putting a ceiling on how high spreads can widen.<br />
Securitized assets will experience higher volatility than in 2009 due to the uncertainty surrounding the<br />
government’s continued financial support, and the eventual timing and magnitude of its withdrawal of<br />
crisis support from these markets.<br />
The Treasury yield curve is biased flatter. In the near term, low inflation and anchored short rates could<br />
provide the impetus for lower long-term interest rates and therefore, a bullish flattening of the yield<br />
curve. Later in the year, a steady flow of economic data confirming a recovery could result in short<br />
rates rising higher than long rates, subsequently leading to a bearish flattening of the yield curve.<br />
53
2 0 1 0 I N V E S T M E N T P L A N<br />
ASSET CLASS STRATEGIES<br />
Private Equity Outlook<br />
Expected return for private equity is in the range of 4% to 12% with a target return of 8%.<br />
Corporate finance investments (sometimes called “Buyout”) should experience a continued slow pace of<br />
new investment activity as debt is still relatively limited and expensive. There are signs of improvement<br />
in the lending market, which should provide more attractive financing packages for new purchases, but<br />
a return to the level of investment activity experienced during 2005-2007 is not expected. Private Equity<br />
managers should develop alternative methods to invest in these markets. A few examples of expected<br />
investment strategies in 2010 are providing support-capital for balance sheet restructuring transactions,<br />
growth-capital to allow companies to take market share from weaker competitors, spin-outs of “orphan”<br />
business lines from larger conglomerates that need to raise cash, and the control of distressed<br />
companies through the conversion of debt-to-equity, post restructuring.<br />
The success of venture capital investments during 2010 will be subject to a recovery in the IPO market<br />
(initial public offering) as well as increased interest from larger corporations for strategic acquisitions,<br />
particularly in health care and information technology. Venture capital has experienced a decade of<br />
stagnant growth and limited success, yet the recent success of venture backed IPOs may bring new life<br />
to this market.<br />
Limited partners (LPs) like <strong>OPERS</strong> have not experienced the level of capital call activity expected as a<br />
result of the small amount of new investment activity. The bear market also limited distributions of<br />
capital back to LPs. Thus, there has been little change in invested levels.<br />
Many limited partners have a large amount of “unfunded commitments” that they may not be able to<br />
honor once capital calls resume in earnest. Secondary sales of limited partner interests should be<br />
robust during 2010 as limited partners sell some interests to raise cash or reduce this unfunded<br />
commitment liability they have.<br />
Real Estate Outlook<br />
Staff believes that the recession of 2007-2009 will provide <strong>OPERS</strong> with attractive commercial real<br />
estate investment opportunities in 2010, and perhaps beyond.<br />
There is currently a limited supply of new debt financing for commercial real estate, but an estimated $1<br />
trillion of commercial real estate debt is scheduled to mature over the next three years. This is a<br />
dichotomy that will need to be resolved, hopefully without crisis.<br />
Commercial real estate property fundamentals, occupancy and rental rates, continue to deteriorate.<br />
Staff believes that the combination of limited debt financing and anticipated continued decline in<br />
property cash flows will force owners to sell assets at discounted prices, and provide opportunities for<br />
patient, long-term investors such as <strong>OPERS</strong>.<br />
54
2 0 1 0 I N V E S T M E N T P L A N<br />
ASSET CLASS STRATEGIES<br />
Public Equity<br />
The Public Equity asset class is comprised primarily of U.S. Equity and Non-U.S. Equity-like securities. The<br />
following table summarizes the exposure of U.S. Equity and Non-U.S. Equity within the Defined Benefit<br />
Fund.<br />
Average<br />
Assets Under<br />
Management<br />
($ millions)<br />
% of<br />
Total<br />
Defined<br />
Benefit Benchmark<br />
Defined Benefit Public Equity<br />
Expected Performance and Tracking Error<br />
The following table summarizes the exposure of U.S. Equity and Non-U.S. Equity within the Health Care<br />
Fund.<br />
The following sections provide detailed explanations of the U.S. Equity and Non-U.S. Equity asset class<br />
strategies, composition and risk and return expectations.<br />
55<br />
Performance<br />
Objectives<br />
(net of fees)<br />
(bps)<br />
Target<br />
Tracking<br />
Error*<br />
(bps)<br />
Target<br />
Information<br />
Ratio<br />
Estimated<br />
Annual Fee<br />
($ millions)<br />
Estimated<br />
Annual Fee<br />
(bps)<br />
U.S. Equity $22,904.5 65.8% Russell 3000 20 32 0.68 $11.1 4.9<br />
Non-U.S. Equity $11,994.2 34.2% MSCI ACWI-xU.S. 75 115 0.66 $30.5 25.4<br />
*The tracking error ranges for U.S. Equity and Non-U.S. Equity are 20 - 100 bps and 80 - 300 bps, respectively.<br />
Average<br />
Assets Under<br />
Management<br />
($ millions)<br />
% of<br />
Total<br />
Health Care Benchmark<br />
Health Care Public Equity<br />
Expected Performance and Tracking Error<br />
Performance<br />
Objectives<br />
(net of fees)<br />
(bps)<br />
Target<br />
Tracking<br />
Error*<br />
(bps)<br />
Target<br />
Information<br />
Ratio<br />
Estimated<br />
Annual Fee<br />
($ millions)<br />
Estimated<br />
Annual Fee<br />
(bps)<br />
U.S. Equity $3,205.2 53.3% Russell 3000 20 32 0.68 $1.6 4.9<br />
Non-U.S. Equity $2,810.6 46.7% MSCI ACWI-xU.S. 75 115 0.66 $7.2 25.4<br />
*The tracking error ranges for U.S. Equity and Non-U.S. Equity are 20 - 100 bps and 80 - 300 bps, respectively.
2 0 1 0 I N V E S T M E N T P L A N<br />
ASSET CLASS STRATEGIES<br />
U.S. Equity<br />
Strategy<br />
The objective for the U.S. Equity strategy is to obtain broad-based exposure to the U.S. Equity market and<br />
to outperform the benchmark while managing return volatility relative to the benchmark. The public equity<br />
policy provides a strategy framework that allows flexibility for moving assets between portfolios and for<br />
managing allocations to managers with similar risk levels in the same category. This approach also<br />
specifically acknowledges that different strategies entail different levels of risk.<br />
While the U.S. Equity market is considered an efficient asset class, the strategy facilitates building portfolios<br />
of managers with a high probability of achieving return targets rather than focusing only on risk control. It<br />
also allows for an opportunistic approach for identifying managers with high alpha potential within the active<br />
management category.<br />
Portfolio Allocation<br />
The U.S. Equity asset class is comprised of three categories of managers: index, enhanced index and<br />
active. The allocation to the index category is a key risk control component of the asset class, although it is<br />
expected be reduced somewhat, in an effort to garner more excess return. Indexing, otherwise known as<br />
passive management, is a portfolio management approach for gaining index or beta exposure to the asset<br />
class and exhibits very low tracking error of 0 to 50 basis points (a basis point is a hundredth of a percent).<br />
Tracking error is a measure of a portfolio’s variability of returns relative to that of its benchmark (i.e., how<br />
much more volatile is the portfolio than the index).<br />
”Enhanced” index managers employ a risk-controlled approach with the portfolios exhibiting low to<br />
moderate levels of tracking error, principally by holding as many as half or more of all stocks in the index.<br />
The tracking error of an enhanced index strategy is generally expected to be in the range of 50 basis points<br />
(0.50%) to 250 basis points (2.50%). The enhanced index category is comprised of managers that have<br />
diversified sources of alpha from three general strategic approaches. A risk-controlled, quantitative<br />
approach is employed by three managers (Goldman, Barclays and Piedmont). PIMCO is a synthetic<br />
enhanced index portfolio, which holds equity index futures to obtain equity market exposure while investing<br />
the remaining cash in short-term, fixed income securities. The internal enhanced portfolio is a low-tomedium<br />
risk fundamental analysis strategy managed by U.S. Equity Internal Management Staff.<br />
The tracking error range for active managers is expected to be 250 basis points (2.50%) to 800 basis points<br />
(8.00%) or more. The active portion of our U.S. Equity allocation is currently spread among five managers,<br />
with two managers being funded in 2007 for the manager of minority manager program. Leading Edge and<br />
Progress are fund of funds programs each comprised of minority managers and were initially funded with<br />
allocations of $75 million and $50 million, respectively. Leading Edge and Progress have manager<br />
selection and allocation authority and currently use twelve and seven managers in their line-ups,<br />
respectively.<br />
56
2 0 1 0 I N V E S T M E N T P L A N<br />
ASSET CLASS STRATEGIES<br />
Performance Objectives and Risk Control<br />
The U.S. Equity asset class benchmark is the Russell 3000 Index, which is a broad-based index of large<br />
and small companies, substantially comprising in dollar value the investable U.S. Equity universe. <strong>OPERS</strong>’<br />
allocations among the indexed, enhanced index and active management categories are managed to<br />
optimize the risk and return profile of the asset class portfolio. The composition of the asset class will<br />
continue to be assessed to determine the appropriate managers and the optimal allocations to achieve the<br />
performance objective while working within an allotted risk budget.<br />
The outperformance objective or alpha expectation for 2010 for the aggregate U.S. Equity asset class<br />
composite is 20 basis points, as shown in the accompanying table. The allocations among the portfolios,<br />
which have varying degrees of expected alpha, determine the aggregate alpha expectation. The sources of<br />
outperformance are from the enhanced index and active management categories. The expected alphas for<br />
these managers fall in the 47 to 178 basis point range. The alpha expectations are based on the<br />
confidence level for each manager as well as the outlook for the specific strategy that each employs.<br />
The asset class tracking error is determined by a risk budgeting process and an analysis of historical and<br />
expected manager tracking errors versus their respective index and the overall asset class benchmark.<br />
Tracking error expectations are established for each portfolio and each category of portfolios (index,<br />
enhanced and active) resulting in an overall portfolio that has a risk budget that remains below the U.S.<br />
Equity policy limit of 70 basis points and is targeted at 32 basis points.<br />
The benefit of diversification among managers, manager strategies and manager benchmarks results in a<br />
lower tracking error estimate than would be computed by a simple weighted average of the individual<br />
portfolio tracking errors. Therefore, despite tracking error estimates for a manager of up to 800 basis<br />
points, the asset class tracking error target is quite low at 32 basis points. The tracking errors of the asset<br />
class, categories and individual portfolios are monitored on a regular basis to assess changes in manager<br />
and portfolio behavior as well as to compare with the targets described in this Annual <strong>Investment</strong> <strong>Plan</strong>.<br />
The Internal Russell 2000 and Internal Russell 1000 portfolios are index-oriented and employ the use of<br />
derivatives such as futures. They are used in tandem for tactical asset allocation at the total fund level for<br />
managing U.S. Equity exposure, as well as at the asset class level for managing small capitalization and<br />
large capitalization exposure. The accounts are also used for conducting transition of funds between<br />
managers or the transfer of assets into or out of the asset class. The use of derivatives and the expertise of<br />
internal Fund Management Staff and the equity trading department allow Staff to often transition U.S. Equity<br />
assets in-house in a very cost effective and operationally efficient manner.<br />
The portfolio composition and strategic allocation are managed to achieve an attractive risk-adjusted return.<br />
A measure of the risk-return efficiency of a portfolio is the information ratio. The aggregate portfolio<br />
outperformance and tracking error are used to calculate the information ratio. The calculation is expected<br />
alpha divided by tracking error. The 2010 U.S. Equity portfolio is expected to have an information ratio of<br />
0.68. The following schedule shows this risk-adjusted performance objective, the tracking error target for<br />
each portfolio and the corresponding active return expectations.<br />
57
2 0 1 0 I N V E S T M E N T P L A N<br />
ASSET CLASS STRATEGIES<br />
The allocations of the Defined Benefit Fund starting in 2010 will require transitioning assets out of the U.S.<br />
Equity asset class while continuing to achieve the outperformance objective within the stated risk parameters.<br />
Average<br />
Assets Under<br />
Management<br />
($ millions)<br />
U.S. Equity<br />
Expected Performance and Tracking Error<br />
% of<br />
Total<br />
U.S.<br />
Equity Benchmark<br />
Portfolio Composition<br />
The table below is a summary of the allocations for the U.S. Equity portfolio, showing the internal and<br />
external management and the active (including enhanced index) and passive asset allocations.<br />
58<br />
Performance<br />
Objectives<br />
(net of fees)<br />
(bps)<br />
Target<br />
Tracking<br />
Error<br />
(bps)<br />
Target<br />
Information<br />
Ratio<br />
Estimated<br />
Annual<br />
Fee<br />
($ millions)<br />
Estimated<br />
Annual<br />
Fee<br />
(bps)<br />
Index<br />
Internal R3000 $17,101.9 65.5% Russell 3000 4 9 0.40 $0.2 0.1<br />
Internal R2000 522.2 2.0% Russell 2000 0 15 0.00 0.1 2.0<br />
Internal R1000 156.7 0.6% Russell 1000 0 35 0.00 0.1 3.5<br />
Total Index<br />
Enhanced Index<br />
17,780.7 68.1% Russell 3000 4 10 0.36 0.4 0.2<br />
Internal Enhanced 3,942.6 15.1% Russell 1000 47 125 0.38 1.8 4.5<br />
BGI 1,671.0 6.4% Russell 1000 44 100 0.44 2.7 16.4<br />
Piedmont 130.5 0.5% S&P 500 57 150 0.38 0.2 17.6<br />
Goldman Sachs 1,227.2 4.7% S&P 500 74 150 0.49 1.9 15.8<br />
PIMCO 652.7 2.5% S&P 500 50 125 0.40 1.6 25.0<br />
Total Enhanced Index<br />
Active<br />
7,650.2 29.3% 51 90 0.57 8.3 10.9<br />
Leading Edge MOMM 130.5 0.5% Russell 3000 41 250 0.16 0.8 58.4<br />
Progress MOMM 26.1 0.1% Russell 3000 20 200 0.10 0.2 60.0<br />
Invesco 235.0 0.9% Russell 2000 72 300 0.24 1.1 47.2<br />
Pyramis 313.3 1.2% Russell 2000 178 800 0.22 1.9 61.6<br />
Total Active 678.9 2.6% 116 450 0.26 4.0 58.3<br />
Total U.S. Equity $26,109.7 100.0% Russell 3000 20 32 0.68 $12.7 4.9<br />
Estimate of Internal/External and Active/Passive Composition<br />
Est. Mid-Year 2009 Est. Mid-Year 2010<br />
Active Passive Total Active Passive Total<br />
Internal 19.2% 65.5% 84.7% 15.1% 68.1% 83.2%<br />
External 15.3% 0.0% 15.3% 16.8% 0.0% 16.8%<br />
Total 34.5% 65.5% 100.0% 31.9% 68.1% 100.0%
2 0 1 0 I N V E S T M E N T P L A N<br />
ASSET CLASS STRATEGIES<br />
Non-U.S. Equity<br />
Strategy<br />
<strong>OPERS</strong>’ seeks to obtain exposure to Non-U.S. Equities across both developed and developing markets to<br />
diversify plan assets and enhance return. To achieve this, the portfolio invests in both passive and active<br />
management strategies, with a bias towards active strategies. The active and enhanced allocations are<br />
approximately 80% of the portfolio and take advantage of the historical ability of active managers to<br />
generate excess returns in this asset class. The passive allocation is approximately 20% and produces risk<br />
controlled, inexpensive, broad market exposure.<br />
Internal management of the asset class through the use of derivatives is authorized. Currently, the program<br />
is 100% externally managed. External managers are selected in accordance with the <strong>OPERS</strong> External<br />
Manager Search Policy for their expertise, risk management skill and ability to add excess returns above<br />
the benchmark return. The asset class benchmark is the Morgan Stanley Capital International All Country<br />
World excluding the United States Standard Index (MSCI ACWIxU.S.), unhedged, and net of dividends.<br />
Portfolio Allocation<br />
While it is Staff’s responsibility to monitor and manage the risk that the sum total of individual manager<br />
performances exceeds the performance of the asset class benchmark, individual managers are sometimes<br />
assigned a benchmark narrower than the one for the asset class. The Non-U.S. Equities portfolio is<br />
composed of 14 different externally managed portfolios benchmarked to four distinct indexes: the MSCI<br />
ACWIxU.S., the MSCl Europe, Australasia and Far East Standard Index (MSCI EAFE), the MSCI Emerging<br />
Market Index (MSCI EM) and the MSCl World excluding U.S. Small Cap Index (MSCIWxU.S.Small Cap).<br />
Most managers have the same benchmark of the asset class.<br />
Active managers benchmarked to the MSCI EAFE Index invest almost exclusively in international<br />
developed markets. Managers within the MSCI ACWIxU.S. category are permitted to invest in both<br />
developed and emerging markets up to a prescribed guideline limit. The portfolio targets a high allocation<br />
to these types of managers. There is a strategic allocation to dedicated emerging market managers that<br />
targets a much smaller portion of total portfolio value. Finally, the portfolio has a small target allocation to<br />
dedicated international small cap managers.<br />
As of September 30, 2009, the Non-U.S. Equity asset class was approximately $14 billion. The portfolio<br />
tracking error was under 130 basis points (1.30%) and the portfolio was overweight small cap, active versus<br />
passive investment strategies and emerging markets versus its benchmark.<br />
59
2 0 1 0 I N V E S T M E N T P L A N<br />
ASSET CLASS STRATEGIES<br />
Performance Objectives and Risk Control<br />
The benchmark for the total Non-U.S. Equity asset class is the MSCI ACWIxU.S. Index and the portfolio is<br />
expected to outperform this benchmark by at least 75 basis points (0.75%) over a three-to-five year market<br />
cycle, net of fees. <strong>Investment</strong> Staff, using risk budgeting and other techniques, determines the asset class<br />
tracking error, or active risk. The tracking error is projected to be 115 basis points (1.15%) in 2010 given<br />
the current portfolio positioning and market volatility. As a result, an information ratio of 0.66 is expected,<br />
which is consistent with other asset classes.<br />
The following table illustrates each existing portfolio, expected performance objectives, and forecasted<br />
contribution to the total asset class returns.<br />
Average<br />
Assets Under<br />
Management<br />
% of<br />
Total<br />
Public<br />
Non-U.S. Equity<br />
Expected Performance and Tracking Error<br />
Performance<br />
Target<br />
Objectives Tracking Target Estimated<br />
(net of fees) Error Information Annual Fee<br />
Estimated<br />
Annual Fee<br />
($ millions) Equity Benchmark (bps) (bps) Ratio ($ millions) (bps)<br />
Index<br />
BGI Index $2,590.8 17.5% ACWIxU.S. 13 25 0.52 0.8 3.0<br />
Total Index<br />
Active ACWIxU.S./EAFE<br />
2,590.8 17.5% ACWIxU.S. 13 25 0.52 0.8 3.0<br />
Acadian Core 695.8 4.7% ACWIxU.S. 144 400 0.36 2.2 31.5<br />
Alliance Bernstein 6.9% ACWIxU.S. 45 350 0.13 3.5 34.2<br />
Baring 1,228.8 8.3% ACWIxU.S. 73 200 0.37 1.7 14.2<br />
BGI Enhanced 3,405.1 23.0% ACWIxU.S. 52 100 0.52 4.7 13.9<br />
Brandes 1,273.2 8.6% ACWIxU.S. 167 700 0.24 4.7 37.1<br />
JP Morgan 1,065.9 7.2% ACWIxU.S. 50 300 0.17 4.0 37.9<br />
LSV 547.8 3.7% EAFE 84 350 0.24 2.3 41.8<br />
TT International 651.4 4.4% ACWIxU.S. 62 450 0.14 2.6 39.2<br />
Walter Scott 4.3% EAFE 137 800 0.17 2.5 39.2<br />
Total Active ACWIxU.S./EAFE<br />
Active Emerging Mkts<br />
10,526.2 71.1% 81 150 0.54 28.3 26.9<br />
Acadian Emerging 370.1 2.5% Emerging 127 500 0.25 1.9 50.6<br />
Lazard 384.9 2.6% Emerging 170 600 0.28 1.5 40.0<br />
T Rowe Price 444.1 3.0% Emerging 107 500 0.21 3.3 74.4<br />
Total Active Emerging Mkts<br />
Active Small Cap<br />
1,184.4 8.0% Emerging 135 350 0.39 6.7 56.7<br />
Acadian Small Cap 503.4 3.4% Small Cap 138 500 0.28 1.9 38.0<br />
Total Active Small Cap 503.4 3.4% Small Cap 138 500 0.28 1.9 38.0<br />
Total Non U.S. Equity $14,804.8 100.0% ACWIxU.S. 75 115 0.66 $37.7 25.4<br />
60
2 0 1 0 I N V E S T M E N T P L A N<br />
ASSET CLASS STRATEGIES<br />
Portfolio Composition<br />
The structure and risk profile of the program has remained virtually the same as that outlined in the 2009<br />
Annual <strong>Investment</strong> <strong>Plan</strong>. The increased allocation will prompt Staff to consider adding managers and<br />
further exploring the passive management of Non-U.S. Equities internally through the use of derivatives.<br />
Estimate of Internal/External and Active/Passive Composition<br />
Est. Mid-Year 2009 Est. Mid-Year 2010<br />
Active Passive Total Active Passive Total<br />
Internal 0.0% 0.0% 0.0% 0.0% 0.0% 0.0%<br />
External 79.7% 20.3% 100.0% 82.5% 17.5% 100.0%<br />
Total 79.7% 20.3% 100.0% 82.5% 17.5% 100.0%<br />
61
2 0 1 0 I N V E S T M E N T P L A N<br />
ASSET CLASS STRATEGIES<br />
Public Fixed Income<br />
Strategy<br />
The Global Bonds asset class is composed of one composite, containing multiple underlying portfolios, and<br />
three dedicated portfolios, each with a specific purpose:<br />
Global Bonds Universal composite: Provides broad exposure to fixed income assets through multiple<br />
underlying portfolios,<br />
Long Duration portfolio (managed internally): Dedicated elements of asset-liability matching against<br />
long-term liabilities,<br />
Treasury Inflation Protected Securities (TIPS) portfolio (managed internally): Dedicated hedge against<br />
inflation in health care costs; and<br />
Short Duration portfolio (managed internally): Dedicated liquidity for the Health Care Fund.<br />
The Global Bonds asset class uses both internal and external portfolio management. The majority of<br />
assets are internally managed. Internally managed portfolios employ fundamental, active, benchmarkfocused<br />
strategies covering the broad U.S. Fixed Income market. External managers are used<br />
predominately for the high yield and emerging market debt sectors.<br />
Global Bonds Universal Composite—Defined Benefit and Health Care Funds<br />
The Global Bonds Universal Composite is managed against the Barclays Universal Index and includes<br />
Core, High Yield and Emerging Market Debt portfolios. Both the Defined Benefit and Health Care Funds<br />
have assets allocated to the Universal Composite.<br />
Average<br />
Assets Under<br />
Management<br />
($ millions)<br />
% of<br />
Total<br />
Defined<br />
Benefit Benchmark<br />
Defined Benefit Public Fixed Income<br />
Expected Performance and Tracking Error<br />
62<br />
Performance<br />
Objectives<br />
(net of fees)<br />
(bps)<br />
Target<br />
Tracking<br />
Error*<br />
(bps)<br />
Target<br />
Information<br />
Ratio<br />
Estimated<br />
Annual Fee<br />
($ millions)<br />
Estimated<br />
Annual Fee<br />
(bps)<br />
Core Fixed $7,106.8 56.2% Barclays Agg 23 75 0.31 $0.8 1.1<br />
Long Bonds 5,492.2 39.3% Barclays Long G/C 15 100 0.15 0.4 0.7<br />
High Yield 808.7 3.3% Barclays HY 82 325 0.25 3.5 43.4<br />
Liquidity $543.7 1.2% 3-Month T-Bill 0 30 0.00 $0.3 5.4<br />
*The tracking error ranges for Defined Benefit Public Fixed Income is 0 - 200 bps.
2 0 1 0 I N V E S T M E N T P L A N<br />
ASSET CLASS STRATEGIES<br />
Health Care Public Fixed Income<br />
Expected Performance and Tracking Error<br />
Average<br />
Assets % of<br />
Performance Target<br />
Estimated<br />
Under Total<br />
Objectives Tracking Target Estimated Annual<br />
Management Health<br />
(net of fees) Error InformationAnnual<br />
Fee Fee<br />
($ millions) Care Benchmark (bps) (bps) Ratio ($ millions) (bps)<br />
Core Fixed $1,359.2 27.8% Barclays Agg 23 75 0.31 $0.2 1.1<br />
TIPS 2,342.3 48.0% Barclays TIPS 15 50 0.30 0.1 0.5<br />
Short Duration 574.6 20.6% Barclays Short G/C 25 75 0.33 0.2 3.9<br />
High Yield 144.6 1.8% Barclays HY 82 325 0.25 0.6 43.4<br />
Emerging Market Debt 386.8 1.8% Barclays EMD 156 385 0.41 1.8 45.6<br />
Liquidity $74.1 0.0% 3-Month T-Bill 0 30 0.00 $0.0 5.4<br />
*The tracking error ranges for Health Care Public Fixed Income is 0 - 200 bps.<br />
The following sections provide details about each individual fixed income investment strategy.<br />
Core Fixed<br />
Internal Staff manages the core assets, with a small portfolio exception. Core portfolios seek to outperform<br />
the benchmark using a diversified set of alpha sources but primarily using sector and security selection.<br />
The Internal Core portfolio emphasizes diversification, liquidity and low volatility versus the benchmark.<br />
The Internal Core portfolio has an excess return target of 23 basis points and a tracking error of 75 bps.<br />
There is one external core bond manager is the AFL-CIO Housing <strong>Investment</strong> Trust. This manager seeks<br />
to generate a competitive risk-adjusted return by investing primarily in multi-family and single-family<br />
mortgage backed securities insured or guaranteed by the U.S. Government. The other primary objective is<br />
to encourage the construction of affordable housing and the employment of union members. The<br />
performance objective is to generate a 40 basis point excess return over the Barclays Aggregate Index.<br />
Average<br />
Assets Under<br />
Management<br />
($ millions)<br />
% of<br />
Total<br />
Core Fixed Benchmark<br />
Core Fixed<br />
Expected Performance and Tracking Error<br />
63<br />
Performance<br />
Objectives<br />
(net of fees)<br />
(bps)<br />
Target<br />
Tracking<br />
Error<br />
(bps)<br />
Target<br />
Information<br />
Ratio<br />
Estimated<br />
Annual Fee<br />
($ millions)<br />
Estimated<br />
Annual Fee<br />
(bps)<br />
Internal Core $ 8,356.7 98.7% Barclays Agg 23 75 0.31 $0.6 0.7<br />
AFL-CIO 109.3 1.3% Barclays Agg 40 75 0.53 0.4 35.0<br />
Total $8,466.0 100.0% Barclays Agg 23 75 0.31 $1.0 1.1
2 0 1 0 I N V E S T M E N T P L A N<br />
ASSET CLASS STRATEGIES<br />
High-Yield Debt<br />
High-yield securities represent approximately 6% of the Lehman Brothers Universal Index. The<br />
outperformance comes from security selection, which is supported by labor-intensive credit research.<br />
High-yield securities are bonds that are rated below investment-grade at the time of purchase. These bonds<br />
have a higher risk of default, but typically pay sufficiently higher yields than investment-grade bonds in order<br />
compensate for losses and still make them attractive to investors. <strong>OPERS</strong> high yield exposure is currently<br />
100% externally managed by three external managers: Fort Washington, Goldman Sachs Asset<br />
Management and Post Advisory. All three managers seek to outperform their performance benchmark by<br />
engaging in fundamental credit research. To take advantage of opportunities in this sector, portfolio guidelines<br />
are formulated to give these managers broad discretion to invest throughout the high-yield universe.<br />
The increased allocation to high yield will result in the addition of external managers in 2010 and further<br />
consideration of ways to internally manage some of this allocation, such as though derivatives exposure.<br />
Average<br />
Assets Under<br />
Management<br />
($ millions)<br />
% of<br />
Total<br />
High<br />
Yield Benchmark<br />
High Yield<br />
Expected Performance and Tracking Error<br />
64<br />
Performance<br />
Objectives<br />
(net of fees)<br />
(bps)<br />
Target<br />
Tracking<br />
Error<br />
(bps)<br />
Target<br />
Information<br />
Ratio<br />
Estimated<br />
Annual Fee<br />
($ millions)<br />
Estimated<br />
Annual Fee<br />
(bps)<br />
Fort Washington $253.0 26.5% Barclays HY 95 400 0.24 $0.6 25.0<br />
Goldman Sachs 460.3 48.3% Barclays HY 40 300 0.13 2.3 50.0<br />
Post 239.9 25.2% Barclays HY 150 500 0.30 1.2 50.0<br />
Total $953.3 100.0% Barclays HY 82 325 0.25 $4.1 43.4
2 0 1 0 I N V E S T M E N T P L A N<br />
ASSET CLASS STRATEGIES<br />
Emerging Market Debt<br />
Emerging market debt is a term used to encompass bonds issued by developing countries. Emerging<br />
market debt tends to have a lower credit rating (and thus a higher yield) than other sovereign debt because<br />
of increased economic, political, and currency risks. To gain exposure to this type of debt, <strong>OPERS</strong> employs<br />
two external managers – Stone Harbor and Capital Guardian – who primarily add value through country<br />
selection. The role of emerging markets debt is evolving under the new allocations for the Defined Benefit<br />
and Health Care Funds, and Staff will be proposing policy adjustments to the Board for 2010 and possibly<br />
adding more managers.<br />
Average<br />
Assets Under<br />
Management<br />
($ millions)<br />
Total<br />
Emerging<br />
Market<br />
Debt Benchmark<br />
Emerging Market Debt<br />
Expected Performance and Tracking Error<br />
65<br />
Performance<br />
Objectives<br />
(net of fees)<br />
(bps)<br />
Target<br />
Tracking<br />
Error<br />
(bps)<br />
Target<br />
Information<br />
Ratio<br />
Estimated<br />
Annual Fee<br />
($ millions)<br />
Estimated<br />
Annual Fee<br />
(bps)<br />
Capital Guardian $ 218.0 56.4% Barclays EM 204 500 0.41 $1.0 46.0<br />
Stone Harbor 168.8 43.6% Barclays EM 95 350 0.27 0.8 45.0<br />
Total $386.8 100.0% Barclays EM 156 385 0.41 $1.8 45.6
2 0 1 0 I N V E S T M E N T P L A N<br />
ASSET CLASS STRATEGIES<br />
Dedicated Portfolios<br />
Long Duration – Defined Benefit Fund<br />
The internally managed Long Duration portfolio was implemented in 2007 as a result of the review of the<br />
Defined Benefit Fund asset allocation completed in 2006. The review recommended that 40% of Defined<br />
Benefit Fund’s global bond assets be in the Long Duration portfolio, with the remaining 60% in the Universal<br />
Composite. The latest allocation reduces the proportion slightly, to 36%. The portfolio is designed to meet<br />
or exceed the return of the Barclays Long Government/Credit Index with a low level of tracking error. The<br />
primary sources of outperformance for the fund are sector rotation and security selection.<br />
Treasury Inflation Protected Securities (TIPS)<br />
The internally managed TIPS portfolio started in 2005 as a result of the segregation of the Defined Benefit<br />
and Health Care Funds. The portfolio is designed to meet the return of the Barclays TIPS Index with a low<br />
level of tracking error.<br />
Short Duration<br />
The Short Duration portfolio was started in 2005 as a result of the segregation of the Defined Benefit and<br />
Health Care Funds. The portfolio is structured to meet or exceed the return of the Barclays 1-3 Year<br />
Government Bond Index with a low level of tracking error. The primary sources of outperformance are<br />
sector rotation and security selection.<br />
Liquidity Allocation<br />
The new Defined Benefit Fund allocation adds a liquidity pool. Policies are being developed and will be<br />
proposed to the Board for 2010.<br />
66
2 0 1 0 I N V E S T M E N T P L A N<br />
ASSET CLASS STRATEGIES<br />
Performance Objectives and Risk Control<br />
The Defined Benefit Fund and the Health Care Fund recently adopted a new policy mix for fixed income<br />
and will be transitioning towards the new target allocations in 2010.<br />
In the past, <strong>OPERS</strong> has used a single broad benchmark for the fixed income asset class. In general, broad<br />
benchmarks are preferable when allocating to asset classes because they capture the full measure of the<br />
securities available for investment. Broad benchmarks also allow the greatest flexibility to add value during<br />
implementation while investing. However, and due in no small measure to the credit crisis of 2007-08, best<br />
practices in fixed income allocations increasingly recognize that using benchmarks which simply reflect the<br />
fixed income universe “as is” are sub-optimal. Fixed income is no longer seen as one monolithic asset<br />
class, driven solely or predominantly by changes in interest rates.<br />
Sub-optimization occurs because of the capitalization weighting of indexes. The more money an entity<br />
borrows, the less worthy its credit is. Yet, the more money an entity borrows, the larger a portion of its<br />
benchmark it becomes. Then, in designing fixed income portfolios which manage tracking error versus<br />
benchmarks, the larger an entity is in the index, the more <strong>OPERS</strong> is induced to buy. An optimal portfolio<br />
limits the amount invested in the riskiest assets rather than adding to them just because tracking error<br />
discipline induces it. This is what we mean when we say capitalization weighting alone sub-optimizes.<br />
This same pattern of “chasing the issuance of bonds” applies to whole fixed income sectors like Treasuries,<br />
Agencies and Corporates. So, for example, the more “Subprime” debt that is issued, the more of it one<br />
needs to buy in order to minimize tracking error to such a benchmark.<br />
Therefore, in order to identify and invest in the fixed income characteristics (interest rates, credit, highly<br />
liquid, inflation-linked, etc.) which improve portfolio efficiency, <strong>OPERS</strong> is unbundling from the broad fixed<br />
income benchmark and allocating to narrower benchmarks. These are the same benchmarks that are<br />
components of the broad fixed income benchmark; however, our allocation weights them differently.<br />
So, while <strong>OPERS</strong> may still allocate to “Subprime,” the allocation target cannot grow without a conscious<br />
decision to change it. Before, <strong>OPERS</strong>’ allocation target would grow simply if the issuance of “Subprime”<br />
grew.<br />
Beginning with the 2010 allocation, there are no overall benchmarks for each fund, but the Board’s<br />
individual bond allocations will each have their own sector benchmark, risk controls and performance<br />
objectives. In the Defined Benefit Fund these include Core Fixed, Long Bonds, High Yield and a Liquidity<br />
Reserve. In the Health Care Fund these include Core Fixed, TIPS, High Yield, Emerging Market Debt and<br />
a Liquidity Reserve.<br />
67
2 0 1 0 I N V E S T M E N T P L A N<br />
ASSET CLASS STRATEGIES<br />
Portfolio Composition<br />
The following is a summary of the allocation of the Global Bonds portfolio between internal and external<br />
managers:<br />
Estimate of Internal/External and Active/Passive Composition<br />
Est. Mid-Year 2009 Est. Mid-Year 2010<br />
Active Passive Total Active Passive Total<br />
Internal 90.5% 0.7% 91.2% 92.3% 0.0% 92.3%<br />
External 8.8% 0.0% 8.8% 7.7% 0.0% 7.7%<br />
Total 99.3% 0.7% 100.0% 100.0% 0.0% 100.0%<br />
68
2 0 1 0 I N V E S T M E N T P L A N<br />
ASSET CLASS STRATEGIES<br />
Securities Lending<br />
The Securities Lending program uses a combination of lending agents to optimize the incremental return<br />
from this investment strategy. This move towards the diversification of agents coincides with the increase in<br />
lending revenue for <strong>OPERS</strong> in recent years. <strong>OPERS</strong> seeks agents who provide competitive fee splits,<br />
while providing adequate risk controls and segment expertise in the asset class being loaned.<br />
There is a bias toward lending assets in an auction environment so that borrowers are providing maximum<br />
return in a competitive environment on a regular basis.<br />
The Securities Lending program currently has the following structure:<br />
Total Assets<br />
($ billions)<br />
Cash Management<br />
The cash portfolios exhibit a low-to-moderate risk profile that results in principal preservation, while<br />
exceeding the performance of the respective benchmarks. The benchmark of the <strong>OPERS</strong> Short Term<br />
<strong>Investment</strong> Funds (STIF) is the 91-day Treasury bill. The benchmark for the Securities Lending STIF is the<br />
Fed Funds Open Rate. Each portfolio is run separately, with Staff targeting assets that are most likely to<br />
generate performance above the respective portfolio benchmarks.<br />
69<br />
Securities Lending Structure<br />
Average<br />
Lendable<br />
($ billions) Lending Agent Auction<br />
U.S. Equity $22.4 $20.4 eSecLending x<br />
Global Bonds 16.1<br />
Corp Bonds 4.8 eSecLending x<br />
Emerging Market Debt 1.6 State Street<br />
Treasuries 5.6 State Street<br />
Agencies 0.8 State Street<br />
FNMA 1.0 eSecLending x<br />
FHLMC/GNMA 0.8 Key Bank<br />
Non U.S. Equity 11.8<br />
Commingled Assets 4.8 BGI<br />
Separate Account Assets $4.2 State Street
2 0 1 0 I N V E S T M E N T P L A N<br />
ASSET CLASS STRATEGIES<br />
Alternatives<br />
The Alternatives asset class is composed of private equity, real estate, hedge funds, infrastructure and<br />
commodities investment strategies. The Defined Benefit and Health Care Funds invest differently in the<br />
Alternatives asset class to meet their unique investment objectives.<br />
The following table summarizes the alternative investment strategies utilized within the Defined Benefit<br />
Fund.<br />
Average<br />
Assets Under<br />
Management<br />
($ millions)<br />
% of<br />
Total<br />
Defined<br />
Benefit<br />
Alternatives Benchmark<br />
Defined Benefit Alternatives<br />
Expected Performance and Tracking Error<br />
The following table summarizes the alternative investment strategies utilized within the Health Care Fund.<br />
The following sections provide details about each Alternatives investment strategy.<br />
70<br />
Performance<br />
Objectives<br />
(net of fees)<br />
(bps)<br />
Target<br />
Tracking<br />
Error*<br />
(bps)<br />
Target<br />
Information<br />
Ratio<br />
Estimated<br />
Annual Fee<br />
($ millions)<br />
Estimated<br />
Annual<br />
Fee<br />
(bps)<br />
Private Equity $2,777.1 36.7% Russell 3000 + 3% 100 750 0.13 $74.0 266.3<br />
Real Estate<br />
Opportunistic/<br />
5,210.0 53.0% NCREIF 0 600 0.00 56.5 108.4<br />
Hedge Funds 754.3 8.3% Custom** 0 300 0.00 5.6 74.8<br />
Infrastructure $176.7 1.9% CPI + 5% 0 300 0.00 $2.9 166.1<br />
*The tracking error ranges for Defined Benefit Alternatives is 0 - 600 bps.<br />
**The Defined Benefit Opportunistic/Hedge Funds custom benchmark is a blend of LIBOR + 4% and 10%.<br />
Average<br />
Assets Under<br />
Management<br />
($ millions)<br />
% of<br />
Total<br />
Health Care<br />
Alternatives Benchmark<br />
Health Care Alternatives<br />
Expected Performance and Tracking Error<br />
Performance<br />
Objectives<br />
(net of fees)<br />
(bps)<br />
Target<br />
Tracking<br />
Error*<br />
(bps)<br />
Target<br />
Information<br />
Ratio<br />
Estimated<br />
Annual Fee<br />
($ millions)<br />
Estimated<br />
Annual<br />
Fee<br />
(bps)<br />
REIT<br />
Opportunistic/<br />
$708.1 78.9% U.S. REIT 50 200 0.25 $0.3 3.9<br />
Hedge Funds 171.7 2.0% Custom** 0 300 0.00 0.8 45.3<br />
Commodities $17.9 19.1% SPGSCITR 0 300 0.00 $0.0 19.0<br />
*The tracking error ranges for Health Care Alternatives is 0 - 300 bps.<br />
**The Health Care Opportunistic/Hedge Funds custom benchmark is a blend of LIBOR + 4% and Barclays High Yield Index.
2 0 1 0 I N V E S T M E N T P L A N<br />
ASSET CLASS STRATEGIES<br />
Private Equity<br />
<strong>Investment</strong> Strategy<br />
<strong>OPERS</strong> seeks to maintain a top-tier Private Equity program that generates attractive, risk-adjusted longterm<br />
returns. The following information details the short and long-term strategic efforts for achieving this<br />
objective.<br />
Beginning in 2010, the Board approved an increase in the target private equity allocation for the Defined<br />
Benefit Fund from 5% to 10%. As of June 30, 2009, the actual allocation was 4.1%, which was well<br />
beneath both the prior allocation target of 5% and the revised target of 10%. It is expected to take 5-years<br />
or longer to reach this new target assuming general economic activity resumes a more normal state<br />
following the significant economic downturn and excessive market swings experienced in 2008 and 2009.<br />
In addition to the traditional approach to portfolio construction (building a concentrated portfolio of new<br />
commitments to a few managers), Staff will be considering other approaches to building allocation to the<br />
asset class if they can be accomplished without fundamentally altering the program’s established strategy.<br />
These tactical approaches may be especially appropriate in the current environment and are intended to<br />
reduce execution risk, shorten the holding period for investments, mitigate the impact of the J-Curve, while<br />
providing the program with attractive risk-adjusted returns.<br />
Performance Objectives and Risk Control<br />
<strong>OPERS</strong> Private Equity performance is benchmarked on a long-term, 7-10 year, rolling basis against the<br />
Russell 3000 plus 300 basis points using the internal rate of return (IRR) cash flow methodology.<br />
Risk Management<br />
Risk management within private equity is based on portfolio parameters designed to control:<br />
Liquidity<br />
Vintage Year Risk<br />
Manager Concentration Risk<br />
Firm Risk<br />
Currency<br />
Industry<br />
Geography<br />
Leverage<br />
71
2 0 1 0 I N V E S T M E N T P L A N<br />
ASSET CLASS STRATEGIES<br />
Actual vs. Targeted Portfolio Composition<br />
The Private Equity portfolio had an unaudited market value of $2,147 million as of June 30, 2009 and<br />
included approximately $2 billion in unfunded commitments to existing managers. The Private Equity<br />
portfolio will continue to be built over time and balances the need for exposure with available opportunities<br />
and vintage year risk. The following table displays the actual diversification of the portfolio by strategy and<br />
geography based on the fair market value of the underlying funds.<br />
Corporate Finance<br />
Venture Capital<br />
Special Situations<br />
Total<br />
Actual<br />
61.3%<br />
14.3%<br />
12.3%<br />
87.9%<br />
Domestic International Total<br />
Target +/- Actual Target +/- Actual Target<br />
45.0%<br />
10.0%<br />
10.0%<br />
65.0%<br />
16.3%<br />
4.3%<br />
2.3%<br />
22.9%<br />
It is anticipated that the special situations allocation may grow to near 20% over the next few years as most<br />
opportunities in today’s environment fall within this class. The geographic allocation differences versus the<br />
target in the table above are the result of assigning managers to domestic or international, rather than using<br />
a global category. The following table displays the geographic allocation based on the fair market value of<br />
the underlying portfolio companies.<br />
Domestic<br />
International<br />
Total<br />
Actual<br />
68.3%<br />
31.7%<br />
100.0%<br />
Target<br />
65.0%<br />
35.0%<br />
100.0%<br />
+/-<br />
3.3%<br />
-3.3%<br />
0.0%<br />
72<br />
10.9%<br />
0.0%<br />
1.3%<br />
12.1%<br />
30.0%<br />
0.0%<br />
5.0%<br />
35.0%<br />
-19.1%<br />
0.0%<br />
-3.7%<br />
-22.9%<br />
72.2%<br />
14.3%<br />
13.6%<br />
100.0%<br />
75.0%<br />
10.0%<br />
15.0%<br />
100.0%<br />
+/-<br />
-2.8%<br />
4.3%<br />
-1.4%<br />
0.0%
$ millions<br />
$ billions<br />
2,500<br />
2,000<br />
1,500<br />
1,000<br />
500<br />
0<br />
16.00<br />
14.00<br />
12.00<br />
10.00<br />
8.00<br />
6.00<br />
4.00<br />
2.00<br />
0.00<br />
0.2 0.3<br />
2 0 1 0 I N V E S T M E N T P L A N<br />
ASSET CLASS STRATEGIES<br />
Commitment Pacing<br />
Multi-factor models are used to determine the rate of commitments to achieve the target market value<br />
exposure over the target period of time. The graph below depicts the updated investment-pacing model in<br />
millions of dollars per year to achieve a 10% target for the Defined Benefit Fund. The pacing model<br />
estimates that the Defined Benefit Fund will reach the desired market value exposure by year-end 2014.<br />
These pacing estimates may vary from year to year depending on realized performance and market<br />
conditions. Vintage year is the year in which a partnership makes its first investment; this sometimes differs<br />
from the year in which <strong>OPERS</strong> makes its commitment. The information below shows the actual and<br />
projected commitments made each year, rather than vintage year commitments.<br />
0.6% 0.7% 0.7% 0.8%<br />
Actual Aggregate<br />
Commitments<br />
Annual Commitment Pacing<br />
2001 2002 2003 2004 2005 2006 2007 2008 2009 2010E 2011E 2012E 2013E 2014E<br />
0.7 0.3<br />
1.4<br />
0.4<br />
1.4%<br />
2.1%<br />
3.2%<br />
Actual Annual Commitments Projected Annual Commitments<br />
2.1<br />
0.8<br />
2.9<br />
1.4<br />
FMV and Commitment Growth<br />
3.8<br />
2.3<br />
4.5<br />
2002 2003 2004 2005 2006 2007 2008 2009 2010E 2011E 2012E 2013E 2014E<br />
Actual FMV Projected Aggregate<br />
Commitments<br />
73<br />
2.5<br />
4.3% 4.4% 4.4%<br />
4.9<br />
2.2<br />
6.9<br />
2.5<br />
4.4%<br />
8.9<br />
3.3<br />
7.3%<br />
10.9<br />
Projected FMV<br />
4.4<br />
8.6%<br />
12.9<br />
9.8%<br />
5.5<br />
16.0%<br />
14.0%<br />
12.0%<br />
10.0%<br />
8.0%<br />
6.0%<br />
4.0%<br />
2.0%<br />
0.0%<br />
14.9<br />
6.6
2 0 1 0 I N V E S T M E N T P L A N<br />
ASSET CLASS STRATEGIES<br />
Commitments in 2010<br />
The 2010 investment pacing targets $2,000 million in commitments. The expectation is that the number of<br />
commitments will be between 11 and 16. The size of commitments is expected to range between $75 and<br />
$350 million, depending on the strategy.<br />
Corporate Finance<br />
Venture Capital<br />
Special Situations<br />
Fund of Funds<br />
Ranges<br />
Domestic<br />
Anticipated Commitments in 2010 ($ millions)<br />
International Total<br />
250 - 750<br />
0 - 200<br />
300 - 750<br />
0 - 75<br />
420 - 1,120<br />
General Partners<br />
General partner selection is critical for out-performance and Staff proactively seeks relationships with<br />
experienced, top-tier general partners. Working with the private equity advisors, peers and all available<br />
resources, Staff filters and reviews the general partners in each subclass and initiates a dialogue regarding<br />
potential participation in their new partnerships. Further, Staff limits exposure to first-time general partners.<br />
The private equity general partner selection procedures describe the due diligence process and factors for<br />
consideration.<br />
The vast majority of our commitments will be through primary participation in general partnerships. This is<br />
so that partnership rights can be fully exercised and Staff can participate in all meetings and actively<br />
monitor partnerships.<br />
Asset Management Fees<br />
The following table estimates the private equity asset management fees for 2009. Note that private equity<br />
fees relative to market value are skewed in formative years due to the lag between commitments and<br />
investments. Significant portions of the fees are recoverable before general partners receive carry.<br />
Estimate of Management Fees - 2010 ($ millions and bps)<br />
Estimated Average Commitments $5,920<br />
Estimated Average Market Value $2,777<br />
Estimated Average Fee 1.25%<br />
Estimated Management Fee ($ millions) $74.0<br />
Estimated Management Fee (bps) 266<br />
74<br />
0 - 250<br />
0 - 0<br />
0 - 250<br />
0 - 250<br />
0 - 460<br />
250 - 1,000<br />
0 - 200<br />
300 - 1,000<br />
0 - 325<br />
1,500 - 2,500
2 0 1 0 I N V E S T M E N T P L A N<br />
ASSET CLASS STRATEGIES<br />
Real Estate<br />
Private Markets<br />
Market Conditions and Outlook<br />
Staff believes that the recession of 2007-2009 will provide <strong>OPERS</strong> with attractive commercial real estate<br />
investment opportunities in 2010. To raise the needed capital, Staff further believes that owners will be<br />
incented to sell their highest quality and most desirable properties first. <strong>OPERS</strong> should have the<br />
opportunity to acquire high quality properties at attractive prices.<br />
There is an estimated $1 trillion of commercial real estate debt scheduled to mature over the next three<br />
years. There is currently a limited supply of new debt for commercial real estate. Many owners will not be<br />
able to refinance the balances owed on maturing loans because of tighter lending standards and lower<br />
anticipated property level cash flows.<br />
Commercial real estate property fundamentals, occupancy and rental rates, continue to deteriorate. Staff<br />
believes that property level cash flows may continue to deteriorate for the next two years because of this<br />
combination of lower occupancy and rental rates. From 2002 to mid-2007, abundant and inexpensive debt<br />
and equity capital led to increased commercial real estate prices. Capitalization rates (caps, or cap rates)<br />
for stabilized assets, historically in the range of 7.50% to 8.25%, fell to a range of 4.75% to 6.25%. Staff<br />
anticipates that the market will over-correct and that high quality properties will trade at caps in the range of<br />
8.00% to 9.50%. The consensus opinion anticipates that the 2010 total return for the NCREIF Property<br />
Index (NPI) will be a negative 8%, according to the total return swap derivative pricing found on Markit.com.<br />
The consensus view is that while commercial real estate prices continue to decline, investors should “sit on<br />
the sidelines” until property fundamentals begin to improve.<br />
75
2 0 1 0 I N V E S T M E N T P L A N<br />
ASSET CLASS STRATEGIES<br />
<strong>Investment</strong> Strategy and Portfolio Construction<br />
The Private Market Real Estate program consists of a stable, or beta portfolio and a high-return, or alpha<br />
portfolio. The Beta portfolio is comprised of stable cash-flowing core properties and constitutes no less<br />
than 65% of the Private Market Real Estate portfolio, according to the Real Estate policy. The high-return<br />
alpha portfolio consists of all private market real estate investments that are not in the beta portfolio. The<br />
high-return portfolio includes both U.S. and Non-U.S. Real Estate investments. The alpha strategy may<br />
include investments in non-core real estate activities such as development, redevelopment or repositioning<br />
of all property types. The following graph shows to composition of the private market portfolio by<br />
investment style as of June 30, 2009.<br />
Allocation by <strong>Investment</strong> Style as of June 30, 2009<br />
19%<br />
Beta<br />
Projected <strong>Investment</strong>s by Channel<br />
Staff believes that both top-down portfolio construction and a bottom-up asset review is necessary for<br />
successful portfolio construction. In 2010, Staff currently plans to allocate additional capital to private<br />
market real estate through all three investment channels: separate accounts, open-end commingled funds<br />
(OECFs) and closed-end funds. The 2010 investment emphasis will be on stable assets and motivated<br />
sellers.<br />
Separate Accounts<br />
Staff is allocating an estimated $683 million to separate account managers in 2010, consisting of an<br />
estimated $189 million to complete the repositioning/redevelopment of existing assets plus an anticipated<br />
$494 million for new acquisitions. Staff has also approved up to $124 million of property sales, to allow<br />
managers to cull the portfolio and make opportunistic sales. By year-end 2010, Staff anticipates the value<br />
of the separate account portfolio will be $2.93 billion.<br />
Open-End Commingled Funds<br />
The managers of the OECFs aggressively wrote down the values of their portfolios in 2009. Staff believes<br />
that these open-end funds will present <strong>OPERS</strong> with an opportunity to access portfolios of stabilized<br />
properties at attractive pricing at some time in the future. Staff may invest up to $600 million in OECFs in<br />
2010 depending on market fundamentals and portfolio valuations.<br />
76<br />
Alpha<br />
81%
2 0 1 0 I N V E S T M E N T P L A N<br />
ASSET CLASS STRATEGIES<br />
Closed-End Funds<br />
Staff anticipates that the general partners will call the remaining $428 million of <strong>OPERS</strong>’ commitments over<br />
the next three years. Staff intends to make renewed commitments to select general partners and to new<br />
ones. Staff also intends to continue to invest in Non-U.S. Real Estate through the closed-end fund channel.<br />
Staff anticipates committing $225 million to $275 million in three to five partnerships during 2010.<br />
Projected Portfolio Composition<br />
Assuming all discussed investments were made, the following table and graphs show the anticipated<br />
composition of the private market real estate portfolio by property type, investment channel and investment<br />
style by year-end 2010.<br />
Property Type<br />
Percentage<br />
50%<br />
40%<br />
30%<br />
20%<br />
10%<br />
0%<br />
Anticipated Total Private Market Real Estate <strong>Investment</strong> Activity for 2010 ($ millions)<br />
Market Value<br />
June 30, 2009<br />
2010<br />
Dispositions<br />
Projected 2010 Property Type Exposure and Policy Ranges<br />
Apartment Industrial Office Retail Other<br />
77<br />
2010<br />
Income<br />
2010<br />
Acquisitions<br />
Projected<br />
Market Value*<br />
December 30, 2010<br />
Apartment $738 $50 $29 $335 $994<br />
Industrial 457 39 20 247 643<br />
Office 1,453 38 58 460 1,954<br />
Retail 583 6 23 393 1,009<br />
Other 910 3 6 118 1.026<br />
Total $4,141 $137 $135 $1,553 $5,626<br />
*Includes 2nd half 2009 acquisitions, dispositions and cumulative appreciation/(depreciation) as of 12/31/2010.<br />
(subject to change)<br />
50%<br />
40%<br />
30%<br />
20%<br />
10%<br />
0%
2 0 1 0 I N V E S T M E N T P L A N<br />
ASSET CLASS STRATEGIES<br />
Projected 2010 Allocation by Channel<br />
23%<br />
Separate<br />
Accounts<br />
Projected 2010 Allocation by <strong>Investment</strong> Style<br />
25%<br />
25%<br />
Beta<br />
Performance and Risk Control Parameters<br />
The Private Market Real Estate portfolio performance is expected to meet or exceed the National Property<br />
Index (NPI) over rolling five-year periods. The portfolio is measured net of all fees, (which average 100<br />
basis points annually). NPI is not adjusted for fees.<br />
78<br />
OECFs Closed End Funds<br />
Alpha<br />
75%<br />
52%
2 0 1 0 I N V E S T M E N T P L A N<br />
ASSET CLASS STRATEGIES<br />
The tables below show the anticipated year-end 2010 portfolio construction by the following risk control<br />
parameters: life cycle; geography; and leverage.<br />
Life Cycle Exposure<br />
Type Policy Limit Projected<br />
Core >65% 82%<br />
Non-Core 75% 92%<br />
International
2 0 1 0 I N V E S T M E N T P L A N<br />
ASSET CLASS STRATEGIES<br />
Real Estate<br />
Public Markets<br />
Defined Benefit Fund<br />
<strong>OPERS</strong> no longer has a strategic allocation to real estate investment trusts (REITs) in the Defined Benefit<br />
Fund. Staff intends to use REITs as tactical investments to augment the private market portfolio.<br />
Advantages to adding REITs to the real estate portfolio include:<br />
Diversification – REIT price movements to not coincide with the movement of the NPI, therefore REITs<br />
have historically provided some diversification benefits to a private market real estate portfolio<br />
Property Type Access – Staff may invest in REITs to gain access to property specific portfolios that<br />
would be difficult to acquire on a direct basis, such as a portfolio of super-regional malls<br />
Pricing Anomalies – Staff also envisions an investment in REITs when public market real estate<br />
securities trade at discounts to private market real estate prices.<br />
REIT investments in the Defined Benefit Fund will no longer have a separate benchmark. <strong>OPERS</strong> will<br />
invest in REITs if Staff believes that adding public real estate securities to the real estate portfolio will<br />
increase the probability that the <strong>OPERS</strong> Real Estate portfolio will outperform the NPI. Staff may use the<br />
internal active portfolio, a passive portfolio, derivatives or private placements to invest in pubic real estate<br />
securities.<br />
Health Care Fund<br />
Strategy<br />
<strong>OPERS</strong> has retained an allocation to publically traded real estate securities in the Health Care Fund. The<br />
public market real estate allocation serves as the only real estate exposure in the Health Care Fund. The<br />
public real estate securities portfolio (the REIT portfolio) will be invested in an internal, actively managed<br />
domestic portfolio. The real estate securities portfolio is managed using a blend of quantitative and<br />
qualitative analysis to identify companies that are trading significantly below their intrinsic value or are<br />
priced inefficiently relative to their peer set. The strategy results in a diversified portfolio that is able to<br />
produce consistent risk-adjusted returns.<br />
Performance Objectives & Risk Control<br />
The Internal Active Real Estate Securities performance is benchmarked against the Wilshire Real Estate<br />
Securities Index (WRESI). The Internal Active Real Estate securities portfolio is measured net of fees (not<br />
including overhead expenses). WRESI is not adjusted for fees. The Internal Active Real Estate Securities<br />
portfolio is expected to exceed the benchmark returns by 50 basis points annually. The Real Estate policy<br />
establishes the program risk controls (liquidity and diversification) and investable instruments.<br />
80
2 0 1 0 I N V E S T M E N T P L A N<br />
ASSET CLASS STRATEGIES<br />
Opportunistic/Hedge Funds<br />
Strategy<br />
Opportunistic investing allows <strong>OPERS</strong> to access investment strategies and new instruments that do not fit<br />
within one of the traditional asset class categories. There is no overall strategy for the asset class. Each<br />
potential strategy, such as those described below, will be evaluated on its own merit and whether the<br />
strategy is feasible and scalable.<br />
Hedge Funds<br />
This strategy is presently accessed through fund-of-funds and is 100% externally managed by Crestline<br />
Investors, Inc. and Pacific Alternative Asset Management Company. Each was initially funded with $25<br />
million in early 2006. In May 2007, the Board approved, and Staff completed, an additional funding of $25<br />
million for each manager. The Board has increased its allocation to hedge funds/opportunistic beginning in<br />
2010. Staff will be evaluating its approach to the asset type and making further recommendations on<br />
implementation to the Board.<br />
Active Currency<br />
The hiring of external managers to manage active currency mandates was approved by the Board in August<br />
2006. Several managers in the Non-U.S. Equity asset class manage currencies actively. However, no<br />
dedicated currency managers have been hired.<br />
Opportunistic Portfolio<br />
Staff currently manages “distressed debt-like” funds within the hedge funds/opportunistic allocation because<br />
this is not presently recognized as a long-term strategic objective. This use of a portion of the opportunistic<br />
allocation will continue to be evaluated.<br />
The limited size of the Opportunistic program is the primary risk-control mechanism. It is envisioned that<br />
eventually no single program or strategy will account for more than 35% of the total market value of the<br />
Opportunistic asset class. Risk-adjusted performance of the Opportunistic program is expected to be<br />
competitive with <strong>OPERS</strong>’ total fund return benchmark.<br />
Commodities<br />
Staff successfully invested over $50 million in commodity futures in 2008 and continued to study the asset<br />
class in 2009.<br />
Infrastructure<br />
The Board approved a 2% allocation to infrastructure investing beginning in 2010. Staff is evaluating<br />
accessing the asset class through both public and private investments, as well as other relevant aspects of<br />
the proposed asset class policy. The allocation seeks to participate in the favorable risk/reward<br />
characteristics of investments in real assets with stable cash flows, as well as the long-term nature of<br />
investments and their tendency to produce returns which keep pace with inflation. Infrastructure<br />
investments may also be an ideal way to gain exposure to developing economies. <strong>OPERS</strong> exists to serve<br />
public employees, so there is no desire to invest in, or encourage others to invest in, assets where the<br />
welfare of public employees would be diminished.<br />
81
2 0 1 0 I N V E S T M E N T P L A N<br />
Appendix
2 0 1 0 I N V E S T M E N T P L A N<br />
APPENDIX A<br />
Advisors’ Reviews<br />
Date: November 25, 2009<br />
Subject: The Annual <strong>Plan</strong><br />
To: <strong>OPERS</strong> Board<br />
Cc: <strong>OPERS</strong> Staff<br />
From: Steve Burns<br />
The Townsend Group<br />
The Real Estate Consultant (“Townsend” or “Consultant”) to the Ohio Public Employees<br />
Retirement System ("<strong>OPERS</strong>") has reviewed the 2010 Real Estate Department Annual <strong>Plan</strong><br />
("Annual <strong>Plan</strong>"). The Annual <strong>Plan</strong> is consistent with accomplishing the goals and objectives set<br />
forth in the <strong>OPERS</strong> Real Estate Policy ("Policy") which was revised and approved in 2007. We<br />
recommend that the board approve the Annual <strong>Plan</strong>, and we offer the following comments.<br />
The 2010 Annual <strong>Plan</strong> recommends placing additional capital in each of the three investment<br />
channels (separate accounts, open-end funds and closed-end funds) in the real estate portfolio.<br />
The focus will be on purchasing stable, income producing property opportunistically from<br />
motivated sellers. Current capital projections will target $1.3 billion to new investments and<br />
$189 million for current investments resulting in total capital commitment activity of $1.5<br />
billion. In addition, $428 million in unfunded commitments remain outstanding from past<br />
investment commitments and are expected to be drawn over the next several years. Given the<br />
recent re-pricing of the real estate asset class, and consensus view that the market is reaching a<br />
bottom, capital deployed throughout 2010 is expected to yield attractive returns.<br />
The market value of the private real estate program (“Program”) was approximately $4.2 billion<br />
as of June 30, 2009. Following projected acquisitions of $1.5 billion and $137 million of<br />
strategic dispositions in 2010, the projected year-end market value is approximately $5.6 billion.<br />
These figures are dependent upon the resumption of a normal transaction environment in the<br />
real estate markets, which has been minimal through 2009.<br />
With a focus on stable, income producing properties during 2010, an increase in allocation to the<br />
separate accounts and open-end funds is an effective and efficient manner in which to execute<br />
the plan. Separate accounts will be allocated $683 million ($189 for current projects) which is<br />
expected to increase the market value of this channel to $2.9 billion at year end (assuming $124<br />
million in planned strategic disposition activity) or 52% of the real estate portfolio. Open-end<br />
funds are being allocated $600 million, which would bring the year-end 2010 projected market<br />
value to $1.28 billion or 23% of the portfolio. Both of these allocations are intended to provide<br />
the Program access to stable, income producing properties at attractive pricing while providing<br />
diversification. The open-end funds may be delayed in drawing capital as both deposit and<br />
redemption queues have formed over the past year.<br />
82
2 0 1 0 I N V E S T M E N T P L A N<br />
APPENDIX A<br />
This situation occurs when fund management becomes uncomfortable with current pricing and<br />
will clear when the valuation activity settles, which is expected in the near future. Maintaining a<br />
conservative focus in the separate accounts and open-end funds is a prudent course of action.<br />
Closed-end fund vehicles have outstanding unfunded commitments of $428 million that will be<br />
called over the next several years. An additional $225-275 million will be allocated to this<br />
channel during 2010 bringing their allocation to 25% of the portfolio. Given the recent real<br />
estate market events, the most common investment theme observed has been distress. Distress<br />
can be observed in many ways including a need for rescue capital or a seller disposing of assets<br />
at a discount when motivated by the need for liquidity. The allocation to the closed-end funds<br />
will be used to take advantage of this distress and yield attractive opportunities for the program.<br />
In addition, the capital will be used to expand the global nature of the real estate portfolio, which<br />
is currently at the lower end (less than 5%) of the allowable range (up to 25%) of investments<br />
outside the US.<br />
The Annual <strong>Plan</strong> projects the amount of capital that will be invested by property type for each<br />
investment channel (separate accounts, open-end funds and closed-end commingled funds).<br />
Following the current allocations, the portfolio is expected to be comprised of 52% separate<br />
accounts, 23% open-end funds and 25% closed-end commingled funds. Additionally, the<br />
portfolio projects to be in compliance with diversification guidelines set forth in the Policy. We<br />
believe that it is important to ensure that the total Program is developed in a manner consistent<br />
with the Policy including diversification by property type. We also believe that it is important to<br />
have flexibility by investment channel. Maintaining flexibility in this environment is more<br />
important than ever before and will provide the ability to take advantage of opportunities as they<br />
arise.<br />
Given the challenging economic environment, it is our opinion that the Annual <strong>Plan</strong> applies a<br />
disciplined and pragmatic approach, which is consistent with the Policy. Current capital market<br />
conditions will continue to require diligent oversight and judgment on the part of Staff and<br />
Townsend.<br />
Please do not hesitate to contact me if there are any questions.<br />
Regards,<br />
Steve Burns<br />
Principal<br />
83
2 0 1 0 I N V E S T M E N T P L A N<br />
APPENDIX A<br />
MEMORANDUM<br />
To: Ohio Public Employees Retirement System (“<strong>OPERS</strong>”)<br />
From: Hamilton Lane<br />
Date: November 23, 2009<br />
Re: 2010 Annual <strong>Investment</strong> <strong>Plan</strong><br />
Hamilton Lane has worked in conjunction with <strong>OPERS</strong> Staff in developing the 2010 Annual <strong>Investment</strong> <strong>Plan</strong><br />
(the “<strong>Plan</strong>”) with respect to the private equity program of the Defined Benefit Fund (the “DB Fund”).<br />
Recognizing the planned elimination of a private equity allocation within the Healthcare Fund, our collective<br />
work for the 2010 plan centered on the DB Fund. As part of our strategic planning process, we have<br />
employed our Horizon Model, a proprietary, multi-state/multi-period investment pacing model. Particular<br />
focus was given to the increase of the targeted private equity allocation to 10% for the DB Fund, and the<br />
steps necessary to move the fund’s actual exposure towards that target over the course of the following five<br />
or more years. The inputs for this analysis, which employs multi-variable modeling, combines over 20<br />
years of historical data in our investment database, Hamilton Lane’s and <strong>OPERS</strong>’ Staff’s views of the<br />
private equity market risk and returns, commitment size, total number of relationships and asset sub-class<br />
diversification among other factors.<br />
Hamilton Lane believes that the <strong>Plan</strong> is tailored to meet <strong>OPERS</strong>’ long- and short-term objectives relative to<br />
the private equity asset class and is in conformance with Policy restrictions and guidelines.<br />
84
2 0 1 0 I N V E S T M E N T P L A N<br />
APPENDIX B<br />
85
2 0 1 0 I N V E S T M E N T P L A N<br />
APPENDIX B<br />
86
2 0 1 0 I N V E S T M E N T P L A N<br />
APPENDIX B<br />
87
2 0 1 0 I N V E S T M E N T P L A N<br />
APPENDIX B<br />
88
2 0 1 0 I N V E S T M E N T P L A N<br />
APPENDIX B<br />
89
2 0 1 0 I N V E S T M E N T P L A N<br />
APPENDIX B<br />
90
2 0 1 0 I N V E S T M E N T P L A N<br />
APPENDIX B<br />
91
2 0 1 0 I N V E S T M E N T P L A N<br />
APPENDIX C<br />
Name<br />
Steven F. Barker<br />
Joshua<br />
Biddinger<br />
Teresa Black<br />
John C. Blue<br />
Joseph D.<br />
Boushelle<br />
David<br />
Buchholz<br />
Department/Title Hire Date Experience Education Designations<br />
U.S. Equity<br />
Internal<br />
Management –<br />
Senior <strong>Investment</strong><br />
Analyst<br />
Fund<br />
Management –<br />
Portfolio<br />
Assistant<br />
Global Bonds<br />
Internal<br />
Management –<br />
Cash/Securities<br />
Lending Analyst<br />
External Public<br />
Markets –<br />
Senior <strong>Investment</strong><br />
Analyst<br />
U.S. Equity<br />
Internal<br />
Management –<br />
<strong>Investment</strong><br />
Analyst<br />
Fund<br />
Management –<br />
Portfolio<br />
Assistant<br />
June 1999 10 years<br />
April 2009 5 years<br />
November<br />
2000<br />
October<br />
1993<br />
September<br />
2008<br />
January<br />
2009<br />
92<br />
14 years<br />
18 years<br />
7 years<br />
3 years<br />
1993: B.S. Business Administration,<br />
The Ohio State University<br />
1999: M.B.A., The Ohio State<br />
University<br />
2002: A.A.B., North Central State<br />
College<br />
2004: B.S. Business<br />
Administration, Ashland University<br />
2008: M.B.A., Ashland University<br />
1995: B.S. Finance,<br />
The Ohio State University<br />
1989: B.S. Business<br />
Administration, The Ohio State<br />
University<br />
1993: M.B.A. The Ohio State<br />
University<br />
1996: B.A. Economics, University<br />
of Chicago<br />
2006: M.B.A., Cornell University<br />
2005: B.S. Finance, Wright State<br />
University<br />
Level I Candidate in<br />
CFA Program<br />
1997: CFA<br />
Charterholder<br />
2009: Chartered<br />
Alternative<br />
<strong>Investment</strong> Analyst<br />
2006: CFA<br />
Charterholder<br />
Level III Candidate<br />
in CFA Program
2 0 1 0 I N V E S T M E N T P L A N<br />
APPENDIX C<br />
Name<br />
Erik Cagnina<br />
Louis Darmstadter<br />
Alan J. Davidson<br />
Pat Edgington<br />
Mark Ehresman<br />
Tony Enderle<br />
Department/Title Hire Date Experience Education Designations<br />
Global Bonds<br />
Internal<br />
Management –<br />
Portfolio Manager<br />
Private Equity –<br />
Portfolio<br />
Manager<br />
Office of the<br />
CEO –<br />
<strong>Investment</strong><br />
Compliance<br />
Officer<br />
Office of the<br />
CEO –<br />
<strong>Investment</strong><br />
Reporting<br />
Manager<br />
Global Bonds<br />
Internal<br />
Management –<br />
Senior <strong>Investment</strong><br />
Analyst<br />
Global Bonds<br />
Internal<br />
Management –<br />
Senior <strong>Investment</strong><br />
Analyst<br />
March 2006 15 years<br />
March 2007 11 years<br />
September<br />
2006<br />
46 years<br />
July 2000 31 years<br />
June 2002 8 years<br />
January<br />
2002<br />
8 years<br />
93<br />
1992: B.S. Finance, Miami<br />
University<br />
1998: M.B.A. Case Western<br />
Reserve<br />
1985: B.A. History, Tulane<br />
University<br />
1992: M.B.A. University of Chicago<br />
1992: M.A. Middle Eastern Studies,<br />
University of Chicago<br />
1960: B.A. Political Science,<br />
Pennsylvania State University<br />
1963: J.D. Harvard Law School<br />
1985: B.S. Finance, Miami<br />
University<br />
1997: B.S. Finance, Miami<br />
University<br />
2002: M.B.A. Case Western<br />
Reserve<br />
1994: B.S. Business<br />
Administration, Bowling Green<br />
University<br />
2008: CFA<br />
Charterholder<br />
2002: CFA<br />
Charterholder<br />
Attorney<br />
2005: CFA<br />
Charterholder<br />
2002: CFA<br />
Charterholder
2 0 1 0 I N V E S T M E N T P L A N<br />
APPENDIX C<br />
Name<br />
Roger Fox<br />
Eric France<br />
Dan German<br />
Paul Greff<br />
Christopher<br />
Gregson<br />
Xinyang Gu<br />
Department/Title Hire Date Experience Education Designations<br />
Fund<br />
Management –<br />
<strong>Investment</strong><br />
Adviser<br />
Global Bonds<br />
Internal<br />
Management –<br />
Portfolio Manager<br />
Office of the CIO<br />
– Risk Manager<br />
Global Bonds<br />
Internal<br />
Management –<br />
Senior Portfolio<br />
Manager<br />
U.S. Equity<br />
Internal<br />
Management –<br />
Senior <strong>Investment</strong><br />
Analyst<br />
Fund<br />
Management –<br />
Quantitative<br />
Analyst<br />
July 2000 18 years<br />
January<br />
2004<br />
94<br />
24 years<br />
April 2008 11 years<br />
March 2009 20 years<br />
July 2000 9 years<br />
October<br />
2000<br />
9 years<br />
1989: B.S. Mathematics, Purdue<br />
University<br />
2005: M.B.A. Franklin University<br />
1968: B.A. European History, Yale<br />
University<br />
1977: M.A. History, Ohio University<br />
1985: M.A. Finance, The Ohio<br />
State University<br />
1989: B.S. Economics,<br />
Allegheny College<br />
1990: M.B.A., University of<br />
Pittsburgh<br />
1983: B.A. Political Science,<br />
Kalamazoo College<br />
1990: M.B.A. Economics,<br />
University of Detroit<br />
1992: B.A. Psychology,<br />
Indiana University<br />
1993: B.S. Business Finance,<br />
Indiana University<br />
1982: B.S. Physics, Nanjing<br />
Institute of Technology China<br />
1989: M.S. Physics, The Ohio<br />
State University<br />
2001: CFA<br />
Charterholder<br />
1989: CFA<br />
Charterholder<br />
2006: CFA<br />
Charterholder<br />
1993: CFA<br />
Charterholder<br />
2001: CFA<br />
Charterholder
2 0 1 0 I N V E S T M E N T P L A N<br />
APPENDIX C<br />
Name<br />
Mary Ann Kabbaz<br />
Nick Kotsonis<br />
Jack Lake<br />
Deryck Lampe<br />
Brian Langenberg<br />
J.G. Lee<br />
Department/Title Hire Date Experience Education Designations<br />
Office of the CIO<br />
– Executive<br />
Assistant<br />
Global Bonds<br />
Internal<br />
Management –<br />
Senior <strong>Investment</strong><br />
Analyst<br />
U.S. Equity<br />
Internal<br />
Management –<br />
<strong>Investment</strong><br />
Analyst<br />
U.S. Equity<br />
Internal<br />
Management –<br />
Senior Portfolio<br />
Manager<br />
U.S. Equity<br />
Internal<br />
Management –<br />
Senior <strong>Investment</strong><br />
Analyst<br />
Fund<br />
Management –<br />
Fund Manager<br />
January<br />
2000<br />
95<br />
10 years<br />
April 2008 5 years<br />
July 2008 16 years<br />
March 2007 17 years<br />
January<br />
2009<br />
January<br />
2002<br />
21 years<br />
13 years<br />
2004: A.S. Business,<br />
Ohio Dominican University<br />
2003: B.S. Finance, Miami (OH)<br />
University<br />
1989: B.S. Business, Marist College<br />
1999: M.B.A. Finance, Case<br />
Western Reserve University<br />
1989: B.S. Mathematics, Purdue<br />
University<br />
1991: M.S. Statistics, University of<br />
Cincinnati<br />
1992: M.B.A. University of Cincinnati<br />
1988: B.A. Economics, St. Norbert<br />
College<br />
1995: M.B.A. Finance and<br />
Transportation, Kellogg Graduate<br />
School<br />
1996: PhD. Economics, The Ohio<br />
State University<br />
2007: CFA<br />
Charterholder<br />
1999: CFA<br />
Charterholder<br />
1997: CFA<br />
Charterholder<br />
1992: CFA<br />
Charterholder<br />
2001: CFA<br />
Charterholder<br />
2004: Financial<br />
Risk Manager<br />
2004: Professional<br />
Risk Manager
2 0 1 0 I N V E S T M E N T P L A N<br />
APPENDIX C<br />
Name<br />
Kevin Martin<br />
Jerry May<br />
William Miller<br />
Scott Murray<br />
Michael J. Parker<br />
DeAnne B. Rau<br />
Department/Title Hire Date Experience Education Designations<br />
U.S. Equity<br />
Internal<br />
Management –<br />
Senior <strong>Investment</strong><br />
Analyst<br />
Global Bonds<br />
Internal<br />
Management –<br />
Cash/Securities<br />
Lending Manager<br />
Fund<br />
Management –<br />
Deputy Chief<br />
<strong>Investment</strong> Officer<br />
U.S. Equity<br />
Internal<br />
Management –<br />
Portfolio Manager<br />
U.S. Equity<br />
Internal<br />
Management –<br />
<strong>Investment</strong><br />
Analyst<br />
External Public<br />
Markets –<br />
Portfolio Manager<br />
June 1998 11 years<br />
February<br />
2004<br />
96<br />
18 years<br />
July 2005 28 years<br />
June 2005 19 years<br />
October<br />
2008<br />
7 years<br />
June 2001 15 years<br />
1994: B.A. Accounting, Thomas<br />
More College<br />
1998: M.B.A. University of<br />
Cincinnati<br />
1991: B. Business Administration,<br />
Abilene Christian University<br />
2002: M.B.A. Ashland University<br />
1979: B.S. Mechanical<br />
Engineering, Kettering University<br />
1981: M.B.A. University of<br />
Pennsylvania<br />
1985: B.S. Political Science,<br />
University of Connecticut<br />
1991: M.B.A. Washington<br />
University<br />
2002: B.S. Economics, Wharton<br />
School, University of Pennsylvania<br />
1993: B.A. History, Mt. Holyoke<br />
College<br />
1994: B.A. Economics, The Ohio<br />
State University<br />
2007: M.B.A. The Ohio State<br />
University<br />
1999: CPA<br />
2009: CTP –<br />
Certified Treasury<br />
Professional<br />
1985: CFA<br />
Charterholder<br />
2000: CFA<br />
Charterholder<br />
Level III candidate<br />
in the CFA program<br />
Level II candidate<br />
in the CFA program
2 0 1 0 I N V E S T M E N T P L A N<br />
APPENDIX C<br />
Name<br />
Chris Rieddle<br />
Christy Ruoff<br />
Daniel J. Sarver<br />
Richard Shafer<br />
Matthew Sherman<br />
Samir Sidani<br />
Department/Title Hire Date Experience Education Designations<br />
Global Bonds<br />
Internal<br />
Management –<br />
Portfolio Manager<br />
Fund<br />
Management –<br />
Equity Trader<br />
External Public<br />
Markets –<br />
Portfolio Manager<br />
External Public<br />
Markets – Deputy<br />
Chief <strong>Investment</strong><br />
Officer<br />
Fund<br />
Management –<br />
Senior Equity<br />
Trader<br />
Private Equity –<br />
Senior <strong>Investment</strong><br />
Analyst<br />
October<br />
2007<br />
97<br />
20 years<br />
July 1982 27 years<br />
June 1984 25 years<br />
1979: B.S. Finance, Indiana<br />
University<br />
1982: M.B.A. Indiana University<br />
1982: B.S. Business Administration<br />
and Mathematics, Marietta College<br />
1984: M.B.A. The Ohio State<br />
University<br />
May 2009 36 years 1973: B.A. Dartmouth College<br />
May 2006 15 years<br />
June 2006 8 years<br />
1994: B.A. Economics, The Ohio<br />
State University<br />
2000: M.B.A. Otterbein College<br />
2000: B.A. Economics, University<br />
of Rochester<br />
1993: CFA<br />
Charterholder<br />
1988: CFA<br />
Charterholder<br />
1980: CFA<br />
Charterholder<br />
2005: CFA<br />
Charterholder<br />
2007: Chartered<br />
Alternative<br />
<strong>Investment</strong> Analyst
2 0 1 0 I N V E S T M E N T P L A N<br />
APPENDIX C<br />
Name<br />
Todd Soots<br />
Joan Stack<br />
Stephen<br />
Stuckwisch<br />
Bradley E. Sturm<br />
Timothy J. Swingle<br />
Roger Tong<br />
Department/Title Hire Date Experience Education Designations<br />
Global Bonds<br />
Internal<br />
Management –<br />
Senior <strong>Investment</strong><br />
Analyst<br />
Fund<br />
Management –<br />
Trading Manager<br />
Real Estate –<br />
Portfolio Manager<br />
Real Estate –<br />
Portfolio Manager<br />
U.S. Equity<br />
Internal<br />
Management –<br />
Senior <strong>Investment</strong><br />
Analyst<br />
Fund<br />
Management –<br />
Quantitative<br />
Analyst<br />
May 2002 11 years<br />
October<br />
2003<br />
October<br />
1995<br />
February<br />
1988<br />
August<br />
1998<br />
98<br />
34 years<br />
14 years<br />
16 years<br />
11 years<br />
March 2004 15 years<br />
1995: B.S. Finance, The Ohio State<br />
University<br />
2002: M.B.A. The Ohio State<br />
University<br />
1974: B.A. Economics, Mount<br />
Holyoke College<br />
1977: M.B.A. Fordham University<br />
1986: B.A. Economics, Hanover<br />
College<br />
1991: M.B.A. The Ohio State<br />
University<br />
1979: B.A. Economics, University<br />
of Cincinnati<br />
1982: M.A. Economics, University<br />
of Cincinnati<br />
1982: M.A. Industrial Relations,<br />
University of Cincinnati<br />
1993: M.B.A. The Ohio State<br />
University<br />
1980: B.S. Business<br />
Administration, The Ohio State<br />
University<br />
1991: M.S. Mathematics, New<br />
Jersey Institute of Technology<br />
1994: M.B.A. The college of<br />
Insurance<br />
2005: CFA<br />
Charterholder<br />
2000: CFA<br />
Charterholder<br />
1983: CPA (inactive)<br />
1988: CMA<br />
1995: CFA<br />
Charterholder<br />
2007: CMT
2 0 1 0 I N V E S T M E N T P L A N<br />
APPENDIX C<br />
Name<br />
Lewis Tracy<br />
Kimberly<br />
Van Gundy<br />
Erick D. Weis<br />
JoAnn Yocum<br />
Department/Title Hire Date Experience Education Designations<br />
Real Estate –<br />
Senior <strong>Investment</strong><br />
Analyst<br />
External Public<br />
Markets –<br />
<strong>Investment</strong><br />
Administration<br />
Analyst<br />
Fund<br />
Management –<br />
Fund Manager<br />
Fund<br />
Management –<br />
<strong>Investment</strong><br />
Assistant<br />
August<br />
2000<br />
99<br />
9 years<br />
April 1999 8 years<br />
June 1994 17 years<br />
December<br />
2000<br />
24 years<br />
1980: B.A. Economics, U.C.<br />
Berkeley<br />
1994: PhD. Russian Literature, The<br />
Ohio State University<br />
2000: M.B.A. The Ohio State<br />
University<br />
1993: B.S. Accounting, University<br />
of Dayton<br />
2001: M.B.A. Franklin University<br />
1990: B.S. Business<br />
Administration, University of Toledo<br />
1994: M.B.A. The Ohio State<br />
University<br />
1987: A.S. Business, Bliss<br />
Business College<br />
2009: Chartered<br />
Alternative<br />
<strong>Investment</strong> Analyst<br />
2001: CFA<br />
Charterholder