Investment Plan - OPERS
Investment Plan - OPERS
Investment Plan - OPERS

You also want an ePaper? Increase the reach of your titles
YUMPU automatically turns print PDFs into web optimized ePapers that Google loves.
2 0 1 0 I N V E S T M E N T P L A N<br />
FUND STRATEGIES<br />
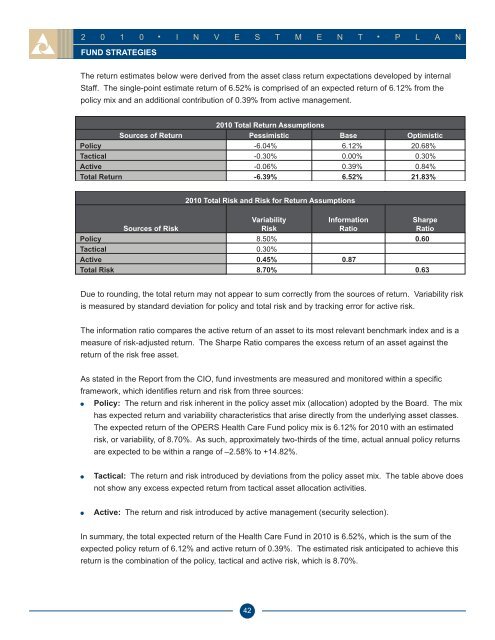
The return estimates below were derived from the asset class return expectations developed by internal<br />
Staff. The single-point estimate return of 6.52% is comprised of an expected return of 6.12% from the<br />
policy mix and an additional contribution of 0.39% from active management.<br />
2010 Total Return Assumptions<br />
Sources of Return Pessimistic Base Optimistic<br />
Policy -6.04% 6.12% 20.68%<br />
Tactical -0.30% 0.00% 0.30%<br />
Active -0.06% 0.39% 0.84%<br />
Total Return -6.39% 6.52% 21.83%<br />
Sources of Risk<br />
2010 Total Risk and Risk for Return Assumptions<br />
Due to rounding, the total return may not appear to sum correctly from the sources of return. Variability risk<br />
is measured by standard deviation for policy and total risk and by tracking error for active risk.<br />
The information ratio compares the active return of an asset to its most relevant benchmark index and is a<br />
measure of risk-adjusted return. The Sharpe Ratio compares the excess return of an asset against the<br />
return of the risk free asset.<br />
As stated in the Report from the CIO, fund investments are measured and monitored within a specific<br />
framework, which identifies return and risk from three sources:<br />
Policy: The return and risk inherent in the policy asset mix (allocation) adopted by the Board. The mix<br />
has expected return and variability characteristics that arise directly from the underlying asset classes.<br />
The expected return of the <strong>OPERS</strong> Health Care Fund policy mix is 6.12% for 2010 with an estimated<br />
risk, or variability, of 8.70%. As such, approximately two-thirds of the time, actual annual policy returns<br />
are expected to be within a range of –2.58% to +14.82%.<br />
Tactical: The return and risk introduced by deviations from the policy asset mix. The table above does<br />
not show any excess expected return from tactical asset allocation activities.<br />
Active: The return and risk introduced by active management (security selection).<br />
In summary, the total expected return of the Health Care Fund in 2010 is 6.52%, which is the sum of the<br />
expected policy return of 6.12% and active return of 0.39%. The estimated risk anticipated to achieve this<br />
return is the combination of the policy, tactical and active risk, which is 8.70%.<br />
42<br />
Variability<br />
Risk<br />
Information<br />
Ratio<br />
Sharpe<br />
Ratio<br />
Policy 8.50% 0.60<br />
Tactical 0.30%<br />
Active 0.45% 0.87<br />
Total Risk 8.70% 0.63