Investment Plan - OPERS
Investment Plan - OPERS
Investment Plan - OPERS

You also want an ePaper? Increase the reach of your titles
YUMPU automatically turns print PDFs into web optimized ePapers that Google loves.
2 0 1 0 I N V E S T M E N T P L A N<br />
FUND STRATEGIES<br />
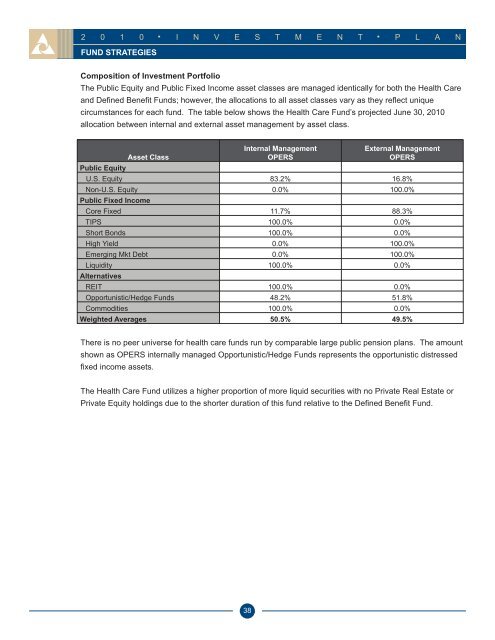
Composition of <strong>Investment</strong> Portfolio<br />
The Public Equity and Public Fixed Income asset classes are managed identically for both the Health Care<br />
and Defined Benefit Funds; however, the allocations to all asset classes vary as they reflect unique<br />
circumstances for each fund. The table below shows the Health Care Fund’s projected June 30, 2010<br />
allocation between internal and external asset management by asset class.<br />
Internal Management<br />
External Management<br />
Asset Class<br />
<strong>OPERS</strong><br />
<strong>OPERS</strong><br />
Public Equity<br />
U.S. Equity 83.2% 16.8%<br />
Non-U.S. Equity<br />
Public Fixed Income<br />
0.0% 100.0%<br />
Core Fixed 11.7% 88.3%<br />
TIPS 100.0% 0.0%<br />
Short Bonds 100.0% 0.0%<br />
High Yield 0.0% 100.0%<br />
Emerging Mkt Debt 0.0% 100.0%<br />
Liquidity<br />
Alternatives<br />
100.0% 0.0%<br />
REIT 100.0% 0.0%<br />
Opportunistic/Hedge Funds 48.2% 51.8%<br />
Commodities 100.0% 0.0%<br />
Weighted Averages 50.5% 49.5%<br />
There is no peer universe for health care funds run by comparable large public pension plans. The amount<br />
shown as <strong>OPERS</strong> internally managed Opportunistic/Hedge Funds represents the opportunistic distressed<br />
fixed income assets.<br />
The Health Care Fund utilizes a higher proportion of more liquid securities with no Private Real Estate or<br />
Private Equity holdings due to the shorter duration of this fund relative to the Defined Benefit Fund.<br />
38