
You also want an ePaper? Increase the reach of your titles
YUMPU automatically turns print PDFs into web optimized ePapers that Google loves.
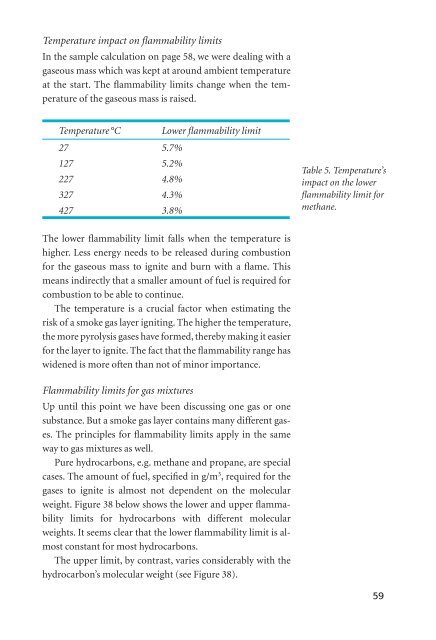
Temperature impact on fl ammability limits<br />
In the sample calculation on page 58, we were dealing with a<br />
gaseous mass which was kept at around ambient temperature<br />
at the start. The fl ammability limits change when the temperature<br />
of the gaseous mass is raised.<br />
Temperature °C Lower fl ammability limit<br />
27 5.7%<br />
127 5.2%<br />
227 4.8%<br />
327 4.3%<br />
427 3.8%<br />
The lower fl ammability limit falls when the temperature is<br />
higher. Less energy needs to be released during combustion<br />
for the gaseous mass to ignite and burn with a fl ame. This<br />
means indirectly that a smaller amount of fuel is required for<br />
combustion to be able to continue.<br />
The temperature is a crucial factor when estimating the<br />
risk of a smoke gas layer igniting. The higher the temperature,<br />
the more pyrolysis gases have formed, thereby making it easier<br />
for the layer to ignite. The fact that the fl ammability range has<br />
widened is more often than not of minor importance.<br />
Flammability limits for gas mixtures<br />
Up until this point we have been discussing one gas or one<br />
substance. But a smoke gas layer contains many different gases.<br />
The principles for fl ammability limits apply in the same<br />
way to gas mixtures as well.<br />
Pure hydrocarbons, e.g. methane and propane, are special<br />
cases. The amount of fuel, specifi ed in g/m3 , required for the<br />
gases to ignite is almost not dependent on the molecular<br />
weight. Figure 38 below shows the lower and upper fl ammability<br />
limits for hydrocarbons with different molecular<br />
weights. It seems clear that the lower fl ammability limit is almost<br />
constant for most hydrocarbons.<br />
The upper limit, by contrast, varies considerably with the<br />
hydrocarbon’s molecular weight (see Figure 38).<br />
Table 5. Temperature’s<br />
impact on the lower<br />
fl ammability limit for<br />
methane.<br />
59