JM FINANCIAL PRODUCTS LIMITED - Bombay Stock Exchange
JM FINANCIAL PRODUCTS LIMITED - Bombay Stock Exchange
JM FINANCIAL PRODUCTS LIMITED - Bombay Stock Exchange

You also want an ePaper? Increase the reach of your titles
YUMPU automatically turns print PDFs into web optimized ePapers that Google loves.
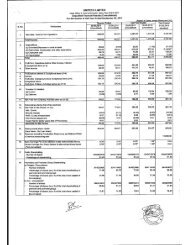
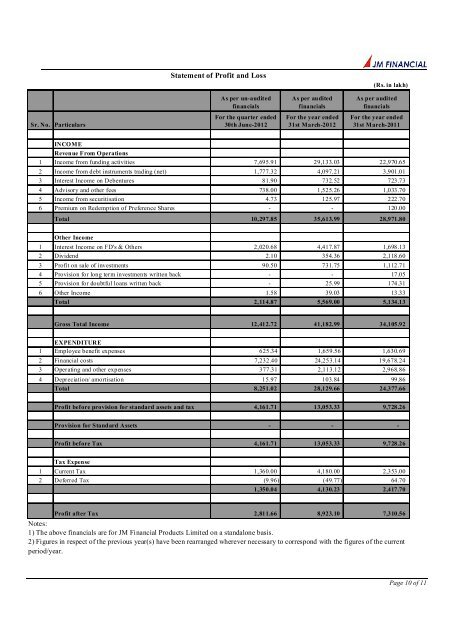
Sr. No. Particulars<br />
INCOME<br />
As per un-audited<br />
financials<br />
For the quarter ended<br />
30th June-2012<br />
Revenue From Operations<br />
1 Income from funding activities 7,695.91<br />
2 Income from debt instruments trading (net) 1,777.32<br />
3 Interest Income on Debentures 81.90<br />
4 Advisory and other fees 738.00<br />
5 Income from securitisation 4.73<br />
6 Premium on Redemption of Preference Shares -<br />
Total 10,297.85<br />
Other Income<br />
1 Interest Income on FD's & Others 2,020.68<br />
2 Dividend 2.10<br />
3 Profit on sale of investments 90.50<br />
4 Provision for long term investments written back -<br />
5 Provision for doubtful loans written back -<br />
6 Other Income 1.58<br />
Total 2,114.87<br />
Gross Total Income 12,412.72<br />
As per audited<br />
financials<br />
For the year ended<br />
31st March-2012<br />
29,133.03<br />
4,097.21<br />
732.52<br />
1,525.26<br />
125.97<br />
-<br />
35,613.99<br />
4,417.87<br />
354.36<br />
731.75<br />
-<br />
25.99<br />
39.03<br />
5,569.00<br />
41,182.99<br />
(Rs. in lakh)<br />
As per audited<br />
financials<br />
For the year ended<br />
31st March-2011<br />
22,970.65<br />
3,901.01<br />
723.73<br />
1,033.70<br />
222.70<br />
120.00<br />
28,971.80<br />
1,698.13<br />
2,118.60<br />
1,112.71<br />
17.05<br />
174.31<br />
13.33<br />
5,134.13<br />
34,105.92<br />
EXPENDITURE<br />
1 Employee benefit expenses 625.34 1,659.56 1,630.69<br />
2 Financial costs 7,232.40 24,253.14 19,678.24<br />
3 Operating and other expenses 377.31 2,113.12 2,968.86<br />
4 Depreciation/ amortisation 15.97<br />
Total 8,251.02<br />
Profit before provision for standard assets and tax 4,161.71<br />
Provision for Standard Assets -<br />
Profit before Tax 4,161.71<br />
Tax Expense<br />
Statement of Profit and Loss<br />
1 Current Tax 1,360.00<br />
2 Deferred Tax (9.96)<br />
1,350.04<br />
Profit after Tax 2,811.66<br />
103.84<br />
28,129.66<br />
13,053.33<br />
-<br />
13,053.33<br />
4,180.00<br />
(49.77)<br />
4,130.23<br />
8,923.10<br />
99.86<br />
24,377.66<br />
9,728.26<br />
-<br />
9,728.26<br />
2,353.00<br />
64.70<br />
2,417.70<br />
7,310.56<br />
Notes:<br />
1) The above financials are for <strong>JM</strong> Financial Products Limited on a standalone basis.<br />
2) Figures in respect of the previous year(s) have been rearranged wherever necessary to correspond with the figures of the current<br />
period/year.<br />
Page 10 of 11