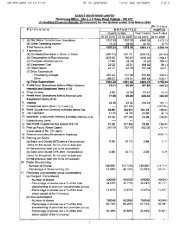
<strong>JM</strong> <strong>FINANCIAL</strong> <strong>PRODUCTS</strong> LTD STATEMENT OF PROFIT & LOSS ACCOUNT FOR THE YEAR ENDED MARCH 31, 2012 10 Previous Year Note No. Rupees Rupees Revenue from operations 20 3,561,399,275 2,897,179,752 Other Income 21 556,899,814 513,412,523 TOTAL REVENUE 4,118,299,089 3,410,592,275 EXPENSES Employee benefit expenses 22 165,955,773 163,069,411 Financial costs 23 2,425,314,495 1,967,824,469 Depreciation/ amortisation 10,383,608 9,985,604 Operating and other expenses 24 211,311,775 296,886,297 TOTAL EXPENSES 2,812,965,651 2,437,765,781 PROFIT BEFORE TAX 1,305,333,438 972,826,494 TAX EXPENSE: Current tax 418,000,000 235,300,000 Deferred tax (4,976,560) 6,470,217 Total 413,023,440 241,770,217 PROFIT AFTER TAX 892,309,998 731,056,277 Earning Per Equity Share (Face value of Rs. 10/- each) Basic and Diluted 30 1.64 1.34 Notes to the financial statements 1 to 38 In terms of our report attached For Deloitte Haskins & Sells For <strong>JM</strong> Financial Products Limited Chartered Accountants Vishal Kampani V. P. Shetty A. Siddharth Partner Mumbai, dated: May 14, 2012 Managing Director Chairman Ankur Shah Company Secretary Mumbai, dated: May 14, 2012
<strong>JM</strong> <strong>FINANCIAL</strong> <strong>PRODUCTS</strong> LTD STATEMENT OF CASH FLOW FOR THE YEAR ENDED MARCH 31, 2012 11 Previous Year PARTICULARS Rupees Rupees A Net Profit before tax 1,305,333,438 972,826,494 Adjustment for : Depreciation/ Amortisation 10,383,608 9,985,604 Loss on fixed assets sold / discarded (net) 7,434,033 - Loss on diminution in value of non-current investments (non trade) (net) 16,699,682 - Loan funds written off 2,599,347 17,430,554 Provision for doubtful loans 7,688,835 - Interest expenses - Others 837,072 472,554 Provision for doubtful loans written back (2,599,347) (17,430,554) Interest Income (441,787,334) (169,813,500) Dividend on non trade investments (35,435,892) (211,860,437) Profit on sale of non-current investments (non trade) - (79,372,674) Profit on sale of current investments (non trade) (73,174,557) (31,897,930) Provision for non-current investments (non trade) written back - (1,704,775) Operating Profit before Working Capital Changes 797,978,885 488,635,336 Adjustment for : (Increase) in loans and advances and other current assets (1,144,308,281) (6,756,523,989) Decrease/ (Increase) in stock-in-trade 1,738,190,192 (2,882,907,990) (Increase) in other bank balances - (250,000,000) (Decrease)/ Increase in trade payables, other liabilities and provisions (165,708,737) 182,054,438 Increase/ (Decrease) in accrued interest expenses related to operating activities 139,548,950 (435,048,230) (Increase) in accrued interest income related to operating activities (72,853) (5,067,583) Cash generated from/ (used in) operations 1,365,628,156 (9,658,858,018) Direct taxes paid (370,480,658) (258,200,760) Net Cash from/(used in) Operating Activities (A) 995,147,498 (9,917,058,778) B Cash flow from Investing Activities Purchase of fixed assets (9,343,345) (10,069,965) Sale of fixed assets 980,513 - Purchase of non-current investments (504,686,462) (650,000,000) Sale/ Redemption of non-current investments 563,446,000 623,101,058 Investment in subsidiaries - (433,499,940) Sale of investment in a subsidiary 80,000,000 - Purchase of current investments (89,655,563,388) (348,706,818,471) Sale of current investments 91,303,223,328 350,072,763,065 (Increase) in other bank balances (2,384,689,657) (4,000,000,000) Interest received 547,747,058 38,828,633 Dividend received 35,435,892 211,860,437 Net Cash (used in) Investing Activities (B) (23,450,061) (2,853,835,183)