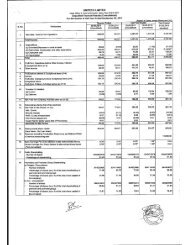
(iv) Government Securities - (v) Others (Please Specify) - 2. Unquoted: (i) Shares: (a) Equity 1,113,335,258 38 (-) (-) (1,033,068,796) (b) Preference 355,420,000 (11,000,000) (ii) Debentures and Bonds 0 (86,554,000) (iii) Units of Mutual Funds 48,550,318 (65,250,000) (iv) Government Securities - (v) Others (Please Specify) (5) Borrower group – wise classification of assets financed as in (2) and (3) above: Amount net of provisions Category Secured Unsecured Total 1) Related Parties (a) Subsidiaries - - - (-) - (-) (-) (16,214,153) (16,214,153) (b) Companies in the same group - 197,193,396 197,193,396 (-) (-) (-) (c) Other related parties - - - (-) (-) (-) 2) Other than related parties 21,048,373,680 879,182,155 21,927,555,835 (20,100,898,348) (933,536,109) (21,034,434,457) Total 21,048,373,680 1,076,375,551 22,124,749,231 (20,100,898,348) (949,750,262) (21,050,648,610) (6) Investor group-wise classification of all investments (current and long term) in shares and securities (both quoted and unquoted): Category Market Value/ Breakup or fair value or NAV Book Value (Net of Provisions) 1) Related Parties (a) Subsidiaries # 1,910,083,171 961,499,940 (1,881,979,940) (1,041,499,940) (b) Companies in the same group * 160,266,462 160,266,462 (-) (-) (c) Other related parties - - (-) (-) 2) Other than related parties * 578,666,876 582,093,173 (2,376,587,901) (2,392,304,238) Total 2,649,016,509 1,703,859,575 (4,258,567,841) (3,433,804,178) (7) Other Information:
Particulars Amount (i) Gross Non – Performing Assets (a) Related Parties - (b) Other than related parties 21,273,334 (ii) Net Non – Performing Assets (a) Related Parties - (b) Other than related parties 2,398,655 (iii) Assets acquired in satisfaction of debt 5,336,100 (figures in brackets indicates previous year figures) * In view of non availability of latest audited financial statements, in respect of certain investments, cost is considered as break-up value/ fair value. # Based on break-up value. 39 (-) (-) (-) (-) (-)