JM FINANCIAL PRODUCTS LIMITED - Bombay Stock Exchange
JM FINANCIAL PRODUCTS LIMITED - Bombay Stock Exchange
JM FINANCIAL PRODUCTS LIMITED - Bombay Stock Exchange

You also want an ePaper? Increase the reach of your titles
YUMPU automatically turns print PDFs into web optimized ePapers that Google loves.
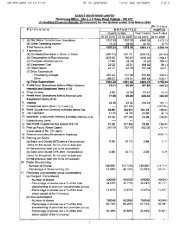
35 Segment Information:<br />
Primary Segment of the Company is business segment. The Company has identified two business segments:<br />
- Fund Based Activities: This includes Margin Funding, Initial Public Offering Funding, Loan Against Shares, etc.<br />
- Trading in Debt Securities: This includes purchase and sale of debt securities and related interest income<br />
thereon.<br />
Segments have been identified and reported taking into account the nature of services, the differing risks and<br />
returns and the internal reporting structure.<br />
Segment information for primary segment reporting (by Business Segment):<br />
Particulars<br />
40<br />
Funding based<br />
activities<br />
Trading in Debt<br />
Securities<br />
Segment Revenue 3,158,180,043 409,721,262 3,567,901,305<br />
Less:<br />
2,525,841,941 390,101,018 2,915,942,959<br />
Other Income 6,502,030 - 6,502,030<br />
18,763,207 - 18,763,207<br />
Enterprise Revenue 3,151,678,013 409,721,262 3,561,399,275<br />
2,507,078,734 390,101,018 2,897,179,752<br />
Segment Results before interest and taxes 675,719,968 106,686,474 782,406,442<br />
530,780,146 (50,130,414) 480,649,732<br />
Unallocable Corporate Income/(Expenses) (Net) 523,764,068<br />
492,649,316<br />
Less, Interest Expense 837,072<br />
472,554<br />
Profit before Tax 1,305,333,438<br />
972,826,494<br />
Tax Expense 413,023,440<br />
241,770,217<br />
Net Profit after Tax 892,309,998<br />
731,056,277<br />
Other Information:<br />
Segment Assets 22,788,950,931 5,734,505,527 28,523,456,458<br />
21,359,312,872 7,469,226,588 28,828,539,460<br />
Unallocable Corporate Assets 8,097,482,546<br />
7,442,229,826<br />
Total Assets 36,620,939,004<br />
36,270,769,286<br />
Segment Liabilities 22,387,005,220 5,718,279,778 28,105,284,998<br />
20,950,502,499 7,448,740,204 28,399,242,703<br />
Unallocable Corporate Liabilities 544,486,555<br />
318,045,496<br />
Total Liabilities 28,649,771,553<br />
28,717,288,199<br />
Capital Expenditure (including CWIP) 9,343,345 - 9,343,345<br />
10,069,965 - 10,069,965<br />
Depreciation/ Amortisation 10,383,608 - 10,383,608<br />
9,985,604 - 9,985,604<br />
Non Cash Expenditure (Loan Funds Written Off) 2,599,347 - 2,599,347<br />
17,430,554 - 17,430,554<br />
Figures in italics indicates previous year figures.<br />
The Company operates in only one geographical segment and hence no further information is provided.<br />
Total