ACTA - DECIMOCTAVA REUNION ORDINARIA DEL COMITE ...
ACTA - DECIMOCTAVA REUNION ORDINARIA DEL COMITE ...
ACTA - DECIMOCTAVA REUNION ORDINARIA DEL COMITE ...

You also want an ePaper? Increase the reach of your titles
YUMPU automatically turns print PDFs into web optimized ePapers that Google loves.
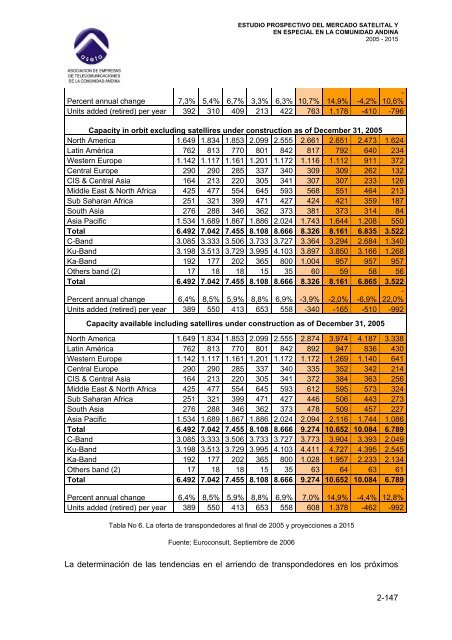
ESTUDIO PROSPECTIVO <strong>DEL</strong> MERCADO SATELITAL Y<br />
EN ESPECIAL EN LA COMUNIDAD ANDINA<br />
2005 - 2015<br />
Percent annual change 7,3% 5,4% 6,7% 3,3% 6,3% 10,7% 14,9% -4,2%<br />
-<br />
10,6%<br />
Units added (retired) per year 392 310 409 213 422 763 1.178 -410 -796<br />
Capacity in orbit excluding satellires under construction as of December 31, 2005<br />
North America 1.649 1.834 1.853 2.099 2.555 2.661 2.651 2.473 1.624<br />
Latin América 762 813 770 801 842 817 792 640 234<br />
Western Europe 1.142 1.117 1.161 1.201 1.172 1.116 1.112 911 372<br />
Central Europe 290 290 285 337 340 309 309 262 132<br />
CIS & Central Asia 164 213 220 305 341 307 307 233 126<br />
Middle East & North Africa 425 477 554 645 593 568 551 464 213<br />
Sub Saharan Africa 251 321 399 471 427 424 421 359 187<br />
South Asia 276 288 346 362 373 381 373 314 84<br />
Asia Pacific 1.534 1.689 1.867 1.886 2.024 1.743 1.644 1.208 550<br />
Total 6.492 7.042 7.455 8.108 8.666 8.326 8.161 6.835 3.522<br />
C-Band 3.085 3.333 3.506 3.733 3.727 3.364 3.294 2.684 1.340<br />
Ku-Band 3.198 3.513 3.729 3.995 4.103 3.897 3.850 3.166 1.268<br />
Ka-Band 192 177 202 365 800 1.004 957 957 957<br />
Others band (2) 17 18 18 15 35 60 59 58 56<br />
Total 6.492 7.042 7.455 8.108 8.666 8.326 8.161 6.865 3.522<br />
-<br />
Percent annual change 6,4% 8,5% 5,9% 8,8% 6,9% -3,9% -2,0% -6,9% 22,0%<br />
Units added (retired) per year 389 550 413 653 558 -340 -165 -510 -992<br />
Capacity available including satellires under construction as of December 31, 2005<br />
North America 1.649 1.834 1.853 2.099 2.555 2.874 3.974 4.187 3.338<br />
Latin América 762 813 770 801 842 892 947 836 430<br />
Western Europe 1.142 1.117 1.161 1.201 1.172 1.172 1.269 1.140 641<br />
Central Europe 290 290 285 337 340 335 352 342 214<br />
CIS & Central Asia 164 213 220 305 341 372 384 363 256<br />
Middle East & North Africa 425 477 554 645 593 612 595 573 324<br />
Sub Saharan Africa 251 321 399 471 427 446 506 443 273<br />
South Asia 276 288 346 362 373 478 509 457 227<br />
Asia Pacific 1.534 1.689 1.867 1.886 2.024 2.094 2.116 1.744 1.086<br />
Total 6.492 7.042 7.455 8.108 8.666 9.274 10.652 10.084 6.789<br />
C-Band 3.085 3.333 3.506 3.733 3.727 3.773 3.904 3.393 2.049<br />
Ku-Band 3.198 3.513 3.729 3.995 4.103 4.411 4.727 4.395 2.545<br />
Ka-Band 192 177 202 365 800 1.028 1.957 2.233 2.134<br />
Others band (2) 17 18 18 15 35 63 64 63 61<br />
Total 6.492 7.042 7.455 8.108 8.666 9.274 10.652 10.084 6.789<br />
-<br />
Percent annual change 6,4% 8,5% 5,9% 8,8% 6,9% 7,0% 14,9% -4,4% 12,8%<br />
Units added (retired) per year 389 550 413 653 558 608 1.378 -462 -992<br />
Tabla No 6. La oferta de transpondedores al final de 2005 y proyecciones a 2015<br />
Fuente: Euroconsult, Septiembre de 2006<br />
La determinación de las tendencias en el arriendo de transpondedores en los próximos<br />
2-147