Informe Votos Nulos - Tribunal Supremo Electoral
Informe Votos Nulos - Tribunal Supremo Electoral
Informe Votos Nulos - Tribunal Supremo Electoral

You also want an ePaper? Increase the reach of your titles
YUMPU automatically turns print PDFs into web optimized ePapers that Google loves.
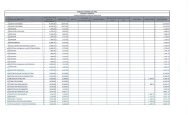
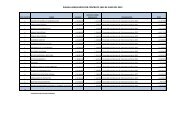
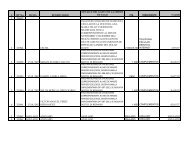
Anexo3: Cuadros y Tablas<br />
Tabla 1: PORCENTAJES DE VOTOS NULOS POR DEPARTAMENTO PERÍODO 1981-2009 Nivel Presidencial.<br />
DEPARTAMENTOS 1981 1985 1989 1993 1997 2001 2005 2009<br />
ATLÁNTIDA 1,88% 1,65% 1,31% 2,40% 4,23% 3,42% 6,99% 3,81%<br />
CHOLUTECA 1,53% 1,89% 1,15% 1,64% 4,41% 4,92% 6,12% 4,47%<br />
COLÓN 2,03% 2,14% 2,04% 3,21% 4,64% 4,15% 7,48% 4,93%<br />
COMAYAGUA 1,22% 1,62% 1,69% 3,22% 4,99% 4,81% 9,37% 5,87%<br />
COPÁN 1,60% 2,24% 1,72% 3,42% 5,73% 2,96% 4,96% 3,32%<br />
CORTÉS 1,85% 1,53% 1,68% 3,30% 3,71% 3,70% 7,83% 4,25%<br />
EL PARAÍSO 1,06% 1,69% 1,78% 2,93% 4,93% 4,08% 8,20% 4,43%<br />
FCO. MORAZÁN 1,71% 1,62% 1,57% 1,71% 3,46% 2,82% 5,54% 4,03%<br />
GRACIAS A DIOS 0,73% 2,45% 3,35% 2,47% 2,90% 5,28% 6,14% 3,25%<br />
INTIBUCÁ 1,20% 2,16% 1,60% 1,82% 4,53% 4,54% 4,68% 4,09%<br />
ISLAS DE LA BAHÍA 0,36% 0,85% 1,44% 1,89% 2,46% 2,41% 1,98% 2,41%<br />
LA PAZ 1,58% 2,46% 1,41% 2,79% 4,22% 4,23% 5,36% 4,35%<br />
LEMPIRA 1,22% 2,32% 1,73% 2,52% 5,88% 4,88% 9,07% 6,29%<br />
OCOTEPEQUE 1,13% 1,48% 1,16% 2,17% 3,54% 3,33% 2,06% 3,06%<br />
OLANCHO 1,18% 1,99% 1,50% 2,41% 4,40% 4,25% 7,64% 4,82%<br />
STA. BÁRBARA 1,04% 1,74% 1,23% 2,43% 5,63% 5,06% 8,26% 5,12%<br />
VALLE 1,44% 1,74% 1,33% 2,06% 4,32% 4,11% 4,32% 3,16%<br />
YORO 1,11% 1,97% 1,39% 3,48% 5,43% 4,41% 9,67% 5,09%<br />
20