GNP SEGUROS
GNP SEGUROS
GNP SEGUROS

Create successful ePaper yourself
Turn your PDF publications into a flip-book with our unique Google optimized e-Paper software.
2<br />
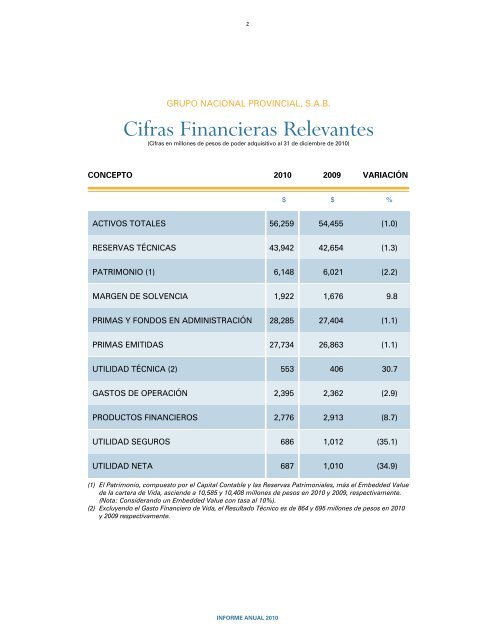
GRUPO NACIONAL PROVINCIAL, S.A.B.<br />
Cifras Financieras Relevantes<br />
(Cifras en millones de pesos de poder adquisitivo al 31 de diciembre de 2010)<br />
CONCEPTO 2010 2009 Variación<br />
$ $ %<br />
ACTIVOS TOTALES 56,259 54,455 (1.0)<br />
RESERVAS TÉCNICAS 43,942 42,654 (1.3)<br />
PATRIMONIO (1) 6,148 6,021 (2.2)<br />
MARGEN DE SOLVENCIA 1,922 1,676 9.8<br />
PRIMAS Y FONDOS EN ADMINISTRACIÓN 28,285 27,404 (1.1)<br />
PRIMAS EMITIDAS 27,734 26,863 (1.1)<br />
UTILIDAD TÉCNICA (2) 553 406 30.7<br />
GASTOS DE OPERACIÓN 2,395 2,362 (2.9)<br />
PRODUCTOS FINANCIEROS 2,776 2,913 (8.7)<br />
UTILIDAD <strong>SEGUROS</strong> 686 1,012 (35.1)<br />
UTILIDAD NETA 687 1,010 (34.9)<br />
(1) El Patrimonio, compuesto por el Capital Contable y las Reservas Patrimoniales, más el Embedded Value<br />
de la cartera de Vida, asciende a 10,585 y 10,408 millones de pesos en 2010 y 2009, respectivamente.<br />
(Nota: Considerando un Embedded Value con tasa al 10%).<br />
(2) Excluyendo el Gasto Financiero de Vida, el Resultado Técnico es de 864 y 695 millones de pesos en 2010<br />
y 2009 respectivamente.<br />
INFORME ANUAL 2010